
Experimental Study of the Effect of Waves on SPAR Responses with
and without Heave Plate in Intact and Damaged Mooring Systems
Murdjito
1
, Gilrandi Adi Negoro
1
, Eko Budi Djatmiko
1
and Baharuddin Ali
2
1
Department of Ocean Engineering, Institut Teknologi Sepuluh Nopember, Surabaya, Indonesia
2
Balai Teknologi Hidrodinamika (BTH) – BPPT, Surabaya, Indonesia
Keywords: SPAR, Heave Plate, Irregular Waves, Dynamic Responses.
Abstract: This research discusses the effects of heave plate utilization against dynamic responses of SPAR due to
random waves. The analysis has been done by numerical and experimental methods. The experimental method
was held in Maneuvering Ocean Engineering Basin of Balai Teknologi Hidrodinamika (BTH) – BPPT. The
model scale of SPAR was constructed based on the classic SPAR prototype with taut mooring systems using
four identical moorings in a 1:125 scale factor. Both experimental and numerical studies were conducted in
time domain analysis with heave plate utilization in the keel of SPAR as the main variable. The diameter of
the heave plate has a 1.5 ratio to the outer diameter of SPAR. Each analysis was conducted in intact and
damaged mooring systems. The analyzed variables of dynamic responses are the surge, heave, pitch, and
maximum offset of the SPAR. Results of both the experimental and numerical studies were then be compared,
showing that the heave plate does not affect surge and pitch responses significantly. On the other hand, it
significantly and consistently reduces the SPAR heave responses in every condition of analysis in both the
numerical and experimental methods. The most significant reduction of SPAR heave response occurred when
the mooring systems were in damaged condition, i.e., 33.29% and 27.84% heave reduction in the experimental
and numerical method, respectively. The study also shows that the heave plate reduces SPAR maximum offset
up to 31.69% in experimental analysis and 11.22% in numerical analysis.
1 INTRODUCTION
The necessity of hydrocarbon fuel which keep
growing each year, demands hydrocarbon exploration
in deep water to fulfil the hydrocarbon shortage.
Therefore, the needs of structural and technology
advancement for deep-water exploration cannot be
neglected any further (Soeb et al, 2017). Between all
development in deep-water exploration technology,
SPAR floating platform has been the most optimal,
efficient, and economic solution to be used as deep-
water drilling and production facility (Glanville et al,
1991) (Horton and Halkyard, 1992).
SPAR floating platform has also been developed
even further as a floater of floating offshore wind
turbine (FOWT), which economically efficient
choice in water depth above 50 meters (Jonkman and
Matha, 2011).
The motion responses of SPAR is relatively low
due to its very deep draught. This advantage,
enhances the security of rigid risers below SPAR in
deep-water production facility (Tao, Lim and
Thiagarajan, 2004). SPAR is also easier to be moved
to another location, and also does not affected by
water depth or earthquake (Soeb et al, 2017). Some of
SPAR excellences are:
- Can be operated in deep-water up to 3000 m water
depth, as drilling or production facility.
- It has absolute stability because of its center of
buoyancy, which always above the center of
gravity.
- Can be utilized as mobile drilling rig.
- It has better sea keeping characteristics compared
to the other mobile drilling unit.
- Simplify the installation and operation of mooring
and cable systems.
- Risers or other drilling units are protected inside
its hull.
These advantages, makes SPAR more likely to be
chose and more superior than the other alternative in
utilization as drilling or production facility in deep-
water (Jain and Agarwal, 2003).
The cylindrical hull of SPAR, which has a
massive draft, provides wave load reduction to the
Murdjito, ., Negoro, G., Djatmiko, E. and Ali, B.
Experimental Study of the Effect of Waves on SPAR Responses with and without Heave Plate in Intact and Damaged Mooring Systems.
DOI: 10.5220/0010060101810190
In Proceedings of the 7th International Seminar on Ocean and Coastal Engineering, Environmental and Natural Disaster Management (ISOCEEN 2019), pages 181-190
ISBN: 978-989-758-516-6
Copyright
c
2021 by SCITEPRESS – Science and Technology Publications, Lda. All rights reserved
181

SPAR system due to its massive displacement which
produces damping effect (Jain and Agarwal, 2003).
SPAR also requires mooring systems to ensure its
position still and stable (station – keeping). The
dynamic responses of SPAR significantly affects the
mooring lines tension. Yet, the type and
characteristics of the mooring systems also govern the
dynamic responses of SPAR (Seebai and
Sundaravadivelu, 2009). Between all of dynamic
loads experienced by SPAR, wave load has the most
impact to SPAR dynamic responses. It is because the
more closer the natural period of the structure to the
wave period, the bigger dynamic responses produced
(Djatmiko, 2012). Therefore, it is important to inspect
the correlation of natural period of the structure and
its environment in design consideration.
A collision between dynamic loads of waves and
SPAR will produces dynamic responses in six degree
of freedom. Those are surge, sway, heave, roll, pitch,
and yaw. These dynamic responses, which hazardous
to risers integrity, need to be minimalized (Tao, Lim
and Thiagarajan, 2004). Heave response also has been
found harmful in small SPAR platform (Fischer and
Gopalkhrisnan, 1998). Some solutions to reduce the
heave responses of SPAR has been offered by
previous studies, which are: increase the damping of
the system, dissociate the natural period of the
structure further from the wave period, and reduce the
wave excitation forces acting on the structure
(Haslum and Faltinsen, 1999). The utilization of
heave plate at the SPAR keel will provide a
significant increase in the damping of the system,
which will also reduce the heave response of the
structure (Tao, Lim and Thiagarajan, 2004). Further
research results shows that the diameter of the heave
plate, affects the increase of added mass, which will
affects the damping of the system and the motion
responses of the structure (Sudhakar and Nallayarasu,
2014). The utilization of double heave plates in the
keel and the hull of classic SPAR also significantly
affects the heave response of the SPAR. The diameter
of the heave plates, and the distance between the
heave plates, are the main variable, which contributes
to the change in SPAR viscous damping
(Subbulakshmi et al, 2015).
This research, discusses about the effects of the
heave plate utilization in the keel of SPAR to its
dynamic responses against irregular waves in intact
and damaged mooring systems. The research has
been done in numerical and experimental method,
using classic SPAR model, which has been studied by
Ivandito Herdayanditya in his research and has 1:125
scale factor, with heave plate utilization as the main
modification. The numerical study has been done
using Orcaflex 9.2a, and the experimental study was
held in Maneuvering and Ocean Engineering Basin
(MOB) of Balai Teknologi Hidrodinamika (BTH) –
Badan Pengkajian dan Penerapan Teknologi (BPPT).
2 LITERATURE REVIEW
The research about non-linear response of SPAR
platform due to wave, and current load in ultra-deep
water and how water depth affects its responses has
been studied in detail (Soeb et al, 2017). Chitrapu, et
al. had also researched about non-linear responses of
SPAR in varies of environment using time domain
simulation (Chitrapu, Saha and Salpekar, 1998). Jain
and Agarwal also accomplished a dynamic analysis
of SPAR using time domain simulation, which
concludes that the responses of SPAR due to waves
and currents need to be restricted, since SPAR
platform usually used as production and drilling
facility (Jain and Agarwal, 2003). Tao, et al. also
studied the correlation between heave response in
classic SPAR and its viscous damping (Tao, Lim and
Thiagarajan, 2004). Fischer and Gopalkrishman
numerically and experimentally analyzed the
characteristics of SPAR heave response, and
represented the importance of heave response
consideration in SPAR (Fischer and Gopalkhrisnan,
1998). Halsum and Faltinsen offered some solutions
to reduce the heave responses of SPAR (Haslum and
Faltinsen, 1999), which are:
- Increase the total damping of the system.
- Dissociate the natural period of the structure
further from the wave period.
- And significantly reduce the wave load excitation
forces.
Tao, et al. research, shows that the heave response
of SPAR platform may be reduced by heave plate
utilization around its hull, which will dramatically
increase the damping of the structure (Tao, Lim and
Thiagarajan, 2004). Yet, Halsum and Faltinsen
mentioned that after using heave plate, the heave
response of SPAR still in a critical state (Haslum and
Faltinsen, 1999). Aside from heave plate utilization,
an additional damping system of a SPAR may be
achieved by installing helical strakes around its hull
or increasing its draught. Sudhakar and Nallayarasu
studied even further about the effects of heave plate
utilization and its diameter to the SPAR responses,
and found the optimal heave-plate diameter ratio to
SPAR diameter (Sudhakar and Nallayarasu, 2014).
Subbulakshmi, et al. also studied the effects of double
heave plates utilization to the heave response
ISOCEEN 2019 - The 7th International Seminar on Ocean and Coastal Engineering, Environmental and Natural Disaster Management
182
reduction of SPAR, and found the optimal diameter
ratio of the heave plates and the optimal distance
between them to reduce the heave response
(Subbulakshmi et al, 2015).
3 OBJECTIVES AND SCOPE OF
STUDY
The objective of this research is to comprehend how
far the heave plate utilization in the SPAR keel affects
the stochastic parameter of its dynamic responses.
The dynamic responses which to be analysed are
surge, heave, pitch, and maximum offset. The scope
of study and boundaries of this research are as
follows.
- Experimental and numerical study only
considered one wave characteristic with 0º wave
heading.
- The type of mooring systems is taut mooring
system, with four identical mooring lines.
- The experimental and numerical study was
conducted in the condition of intact and damaged
mooring system.
- The influence of low frequency wave was not
included in the consideration of the analysis.
- The only mooring line tension considered in this
study is the pre-tension of mooring lines, which is
similar for each mooring lines.
- Numerical study was conducted in Orcaflex 9.2a
as a comparison of the experimental study.
4 METHODOLOGY
The flow and procedure of this research was
conducted in stages as follows.
- The literature reviews was performed by referring
to the previous study. The data collection of the
laboratory, scale model, and any other
experimental and numerical aspects was also
conducted in this step.
- The determination of design criteria like scale
factor, acceptance criteria, and so on.
- Modeling of the scale model, which comprised:
the design aspects of the scale model, instrument
preparation, trials, processing and analyzing the
experimental data result.
- Numerical modeling of the structure, which
consists: modeling stage in the software,
numerical model validation, and numerical trials.
- Analyzing and comparing the results of the
experimental and numerical study followed by
conclusions.
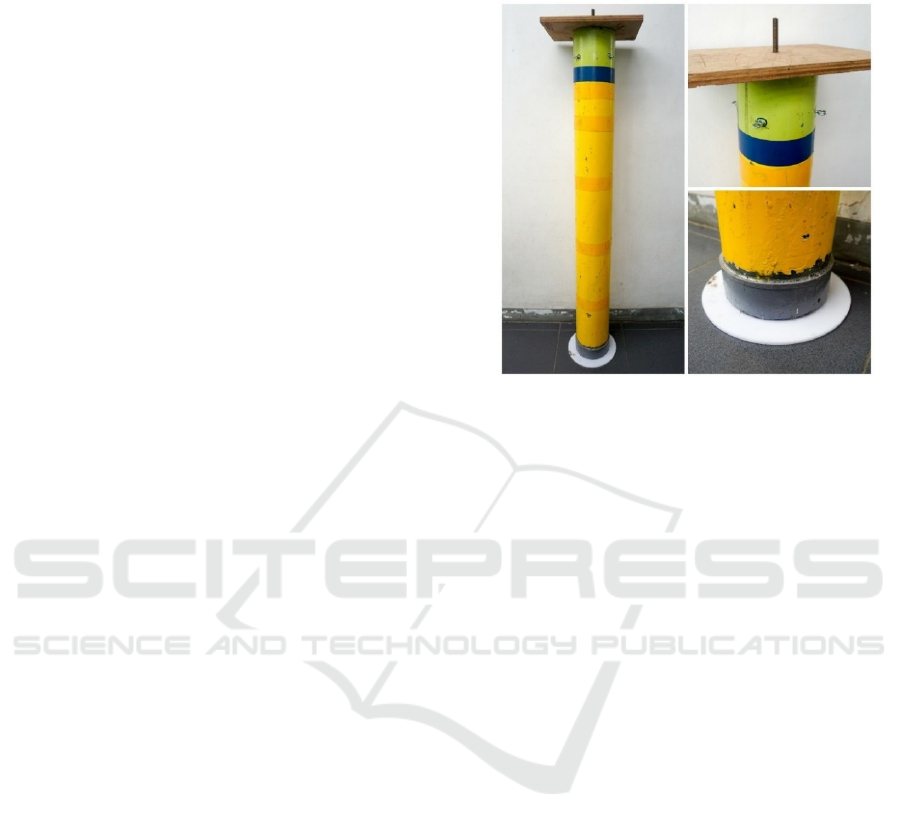
Figure 1: Scale model the SPAR with heave plate.
5 RESULTS AND DISCUSSION
5.1 Experimental Modeling
The experimental modeling consists two main
section, which are scale model modeling, and
mooring system modeling. The scale model of the
SPAR hull was made of PVC pipe with 14 cm
diameter. The heave plate was made of acrylic, while
the topside was made of plywood as can be seen in
Figure 1. The ballasting system of the SPAR was
installed inside of the hull, which was made of six
cylindrical steel with a shaft in the middle piercing
each cylindrical steel. These cylindrical steel’s
position can be optimized inside the hull to achieve
the desired stability equilibrium in water, its weight
distribution parameter like keel to gravity (KG) and
radius of gyration was obtained by a series of
calibration. The ballasting system of the scale model
was divided into two blocks of cylindrical steel. The
first block consists four cylindrical steel which
located in the keel of the SPAR, and the other blocks
consists two cylindrical steel which located at 91.5
cm above the keel. The mooring system model was
made of two section. The first section was rubber, and
the second section was steel wire sling. The stiffness
of the mooring lines, which need to be considered,
was obtained by a series of calibration and calculation
using Hooke’s law equation. The data results from
experimental modeling can be seen at table 1. The
mooring system of the SPAR model was installed in
Experimental Study of the Effect of Waves on SPAR Responses with and without Heave Plate in Intact and Damaged Mooring Systems
183

a configuration like Figure 2, 5.5, and 5.6. While the
ballast of the SPAR and its configuration can be seen
in figure 5.1.
Figure 2: Cylindrical steel as ballast (left) and its
configuration inside the SPAR hull (right).
Figure 3: Side view of mooring system configuration.
Table 1: SPAR data and properties.
SPAR PROPERTIES (SCALE 1:125)
Parameters
Scale
Model
Dim.
Scale
Factor
Full Scale
Dim.
Hull diameter (m) 0.140 λ 17.500
Keel diameter (m) 0.150 λ 18.750
Draft
without
heave
plate (m)
Free
floating
1.029 λ 128.681
Moored 1.111 λ 138.896
Draft with
heave
plate (m)
Free
floating
1.034 λ 129.305
Moored 1.116 λ 139.520
Hull height (m) 1.245 λ 155.625
Keel cylinder height
(m)
0.053 λ 6.625
Fairlead height of
SPAR without from
keel (m)
1.165 λ 145.625
Fairlead height with
heave plate from keel
(m)
1.170 λ 146.250
Mass of SPAR
without heave plate
(ton)
0.016 λ
3
31949.219
Mass of SPAR with
heave plate (ton)
0.017 λ
3
32295.918
Keel to Gravity of
SPAR without heave
plate, KG (m)
0.457 λ 57.125
Keel to Gravity of
SPAR with heave
plate, KG (m)
0.452 λ 56.508
Roll radius of
gyration, Rxx (m)
0.550 λ 68.750
Pitch radius of
gyration, Ryy (m)
0.550 λ 68.750
HEAVE PLATE PROPERTIES (SCALE 1:125)
Parameters
Scale
Model
Dim.
Scale
Factor
Full Scale
Dim.
Heave plate diameter
(m)
0.210 λ 26.250
Heave plate thickness
(m)
0.005 λ 0.625
Mass of heave plate
(ton)
0.000
15
λ
3
283.203
SELECTED MOORING LINES PROPERTIES
(SCALE 1:125)
Parameters
Scale
Model
Dim.
Scale
Factor
Full Scale
Dim.
Pre-tension (KN) 0.003 λ
3
ε 6835.771
Rubber
Axial stiffness, EA
(MN)
0.000
0196
λ
3
ε 39.278
Length (m) 0.2 λ 25.000
Steel wire sling
Axial stiffness, EA
(MN)
0.003
53
λ
3
ε 7075.487
Length (m) 2.040 λ 255.000
5.2 Numerical Modeling
The numerical model was built based on experimental
data structure in full scale. The numerical modeling
also consists two main modeling section, which are
structural modeling and mooring system modeling.
First of all, numerical model of the SPAR was built
using 3D diffraction theory in MOSES at its operation
draught. The structure was modelled while using
heave plate and not. Modeling in MOSES was
intended to obtain the hydrodynamic and hydrostatic
parameter of SPAR in a particular draught, such as
damping matrix, added mass matrix, wave load RAO,
and so on. After the validation of the numerical
model, the numerical model of SPAR has also been
analysed in Orcaflex 9.2a to simulate the random
waves while SPAR in moored condition, using the
ISOCEEN 2019 - The 7th International Seminar on Ocean and Coastal Engineering, Environmental and Natural Disaster Management
184

hydrodynamic and hydrostatic data obtained from
MOSES as an input in Orcaflex 9.2a. The result of
numerical modeling stages can be seen in Figure 4
and Figure 5.
Figure 4: Numerical moored model of SPAR in Orcaflex
9.2a (Full scale) without heave plate (left), and with heave
plate (right).
Figure 5: Numerical model of SPAR in MOSES (Full scale)
wihout heave plate (left), and with heave plate (right).
5.3 Experimental Analysis
The experimental analysis was conducted in
Maneuvering and Ocean Engineering Basin (MOB)
of Balai Teknologi Hidrodinamika (BTH) – BPPT.
SPAR and its mooring systems was attached together
in the MOB based on the planned configuration. The
experiment was conducted in four trial conditions,
which are:
1. SPAR without heave plate in intact mooring
system.
2. SPAR with heave plate in intact mooring system.
3. SPAR without heave plate in damaged mooring
systems.
4. SPAR with heave plate in damaged mooring
systems.
Each trial was conducted in time domain method
with 6 minutes duration, which equivalent as 67
minutes in full scale referring to Froude’s model
scaling law. Qualysis motion capture camera, which
placed under the moving bridge above the MOB, was
used to record the translational and rotational
responses of SPAR. During the simulation, Qualysis
recorded the whole SPAR’s movement based on the
coordinate of passive marker position shift, which
located on the topside of the SPAR. The output from
Qualysis was time history responses in six degree of
freedom. Whereas the elevation of the trial’s waves
was measured using wave probe, which placed under
the moving bridge, in front of the SPAR. The trial’s
wave characteristics can be seen in Table 2. The
configuration of intact and damaged mooring systems
used in the trials can be seen in Figure 6 and Figure
7. While the documentation of the moored model in
MOB can be seen in Figure 8.
Table 2: Trial's wave characteristics.
Parameters Values Units
Full Scale
Wave spectrum
theory
JONSWAP -
Hs 6.35 m
Tp 14.5 s
γ
3.3 -
Wave heading 0 Degree
Model (Scale 1:125)
Wave spectrum
theory
JONSWAP -
Hs 0.0508 m
Tp 1.297 s
γ
3.3 -
Wave heading 0 Degree
Figure 6: Intact mooring system configuration.
Figure 7: Damaged mooring system configuration.
Experimental Study of the Effect of Waves on SPAR Responses with and without Heave Plate in Intact and Damaged Mooring Systems
185

Figure 8: Moored scale model in MOB.
5.4 Numerical Analysis
Firstly, the numerical analysis was conducted in
MOSES in frequency domain while SPAR in free-
floating state using the operation draught. This
analysis was intended to obtain the hydrostatic and
hydrodynamic data of SPAR while in operation
draught. Then, these data obtained by MOSES such
as damping matrix, added mass matrix, and wave load
RAO, will be used in Orcaflex 9.2a as an input, then
further analyzed in moored condition. All trial set
conducted in MOSES can be seen in Table 3.
Table 3: Trial set conducted in MOSES.
Condition
Analysis
code
Operation draught
Without heave
plate
1 Intact, 138.896 m
2
Damaged, 136.845 m
(based on static
analysis in Orcaflex
9.2a)
With heave
plate
3 Intact, 138.896 m
4
Damaged, 137.473 m
(based on static
analysis in Orcaflex
9.2a)
In Orcaflex 9.2a, analysis was conducted using
time domain simulation, in intact and damaged
mooring system. Every aspects of simulation such as
the duration of the simulation, wave heading, wave
characteristics, was based on experimental data in full
scale and adjusted as similar as possible. The water
depth data in numerical analysis also based on the
depth of MOB that scaled into full scale, which is
312.5 meters. The intact and damaged mooring
system configuration in Orcaflex 9.2a is the same as
experimental configurations.
5.5 Data Results Processing and
Discussion
There are several steps conducted to obtain the
stochastic parameter of the SPAR responses. The
time history responses both from numerical and
experimental analysis need to be converted into
spectral density response in full scale condition for
each dynamic responses. Then further analysis had
been done in surge, heave, and pitch responses to
obtain their stochastic parameters. Whilst the
maximum offset can be obtained directly by plotting
the surge and sway responses together, then measure
the furthest movement of SPAR during simulation
from the initial coordinate. The time history
responses obtained from experimental analysis was
scaled into full scale using Froude’s law. The
example of time history responses in full scale can be
seen in Figure 9.
Figure 9: Time history responses output example.
Random waves and responses time history have
similar characteristics, so both of them can be
processed with the same method. First, the time
history data need to be prepared by dividing each
wave record into some segment. Every segment has a
same point of measurement with the same interval
length, which can be the point of zero-up crossing
period, zero-down crossing period, or peak period.
After that, incremental frequency or usually called
ISOCEEN 2019 - The 7th International Seminar on Ocean and Coastal Engineering, Environmental and Natural Disaster Management
186

Nyquist frequency can be determined. The Nyquist
frequency was used as the interval of the frequency in
the converted time history responses, which was
converted into a frequency domain record graphic.
When the time history data ready, the conversion
process was conducted in MATLAB using its Fast
Fourier Transform (FFT) feature. The results, which
was a record of amplitude of waves or responses in
each frequency, further converted into an ordinate of
spectral density curve using equation (1) (Djatmiko,
2012). The example of converted time history
responses in time domain into frequency domain can
be seen in Figure 10. And the example of the
conversion results into the spectral density curves can
be seen in Figure 11 until Figure 13.
2
(1)
Where,
= Spectral density ordinate
(m
2
/(rad/s))
= Nyquist frequency (rad/s)
= Wave or responses amplitude (m)
Figure 10: Example of time history FFT output (full scale).
After every component of amplitude in each
recorded frequency has been converted into an
ordinate of spectral density curve, each set of it was
plotted into a diagram with Nyquist frequency as the
abscissa. Then, the stochastic value of each diagram
can be calculated based on the variants of the wave or
responses elevations, which is equivalent with the
area under the spectral density curve. The second, and
fourth moment of spectral area can also be calculated
using equation (2).
(2)
Where m
0
is the variant of wave elevations or
response amplitudes. m
1
, m
2
, and m
4
are the first,
second, and fourth moment of spectral area. By
knowing the value of these parameters, the stochastic
values of each responses can be calculated. In
accordance with the scope and boundaries stated
before, the contribution of the low frequency
components are neglected. Therefore, the stochastic
value calculations are started from the wave
frequency of 0.26 rad/s, which is the lower limit
frequency in wave energy spectrum density.
The stochastic responses calculated in this
research are: significant responses, mean of 1/10
highest responses, mean responses, the most probable
extreme responses, and the most probable extreme
responses with a probability of 99% confidence not
exceeded. Those stochastic responses can be
calculated using equations as follows.
2
(3)
2.5
2
(4)
/
5.08
2
(5)
⌢
2
60
2
(6)
⌢
2
60
2
(7)
Where,
= Significant responses (m)
= Mean responses (m)
/
= Mean of 1/10 highest responses (m)
⌢
= The most probable extreme
responses (m)
⌢
= The most probable extreme
responses with a probability of 99%
confidence not exceeded (m)
= Duration of waves-making (s)
= confidence number, 0.01 for 99%
confidence not exceeded (m)
According to the results, the response changes
between before and after heave plate utilization in
each type of stochastic responses are all the same in
percentage. Therefore, to simplify the analysis in
seeing the changes that occurs, the significant
responses was chosen as a representation of the SPAR
responses in each motion, which was compared
between each condition.
Experimental Study of the Effect of Waves on SPAR Responses with and without Heave Plate in Intact and Damaged Mooring Systems
187
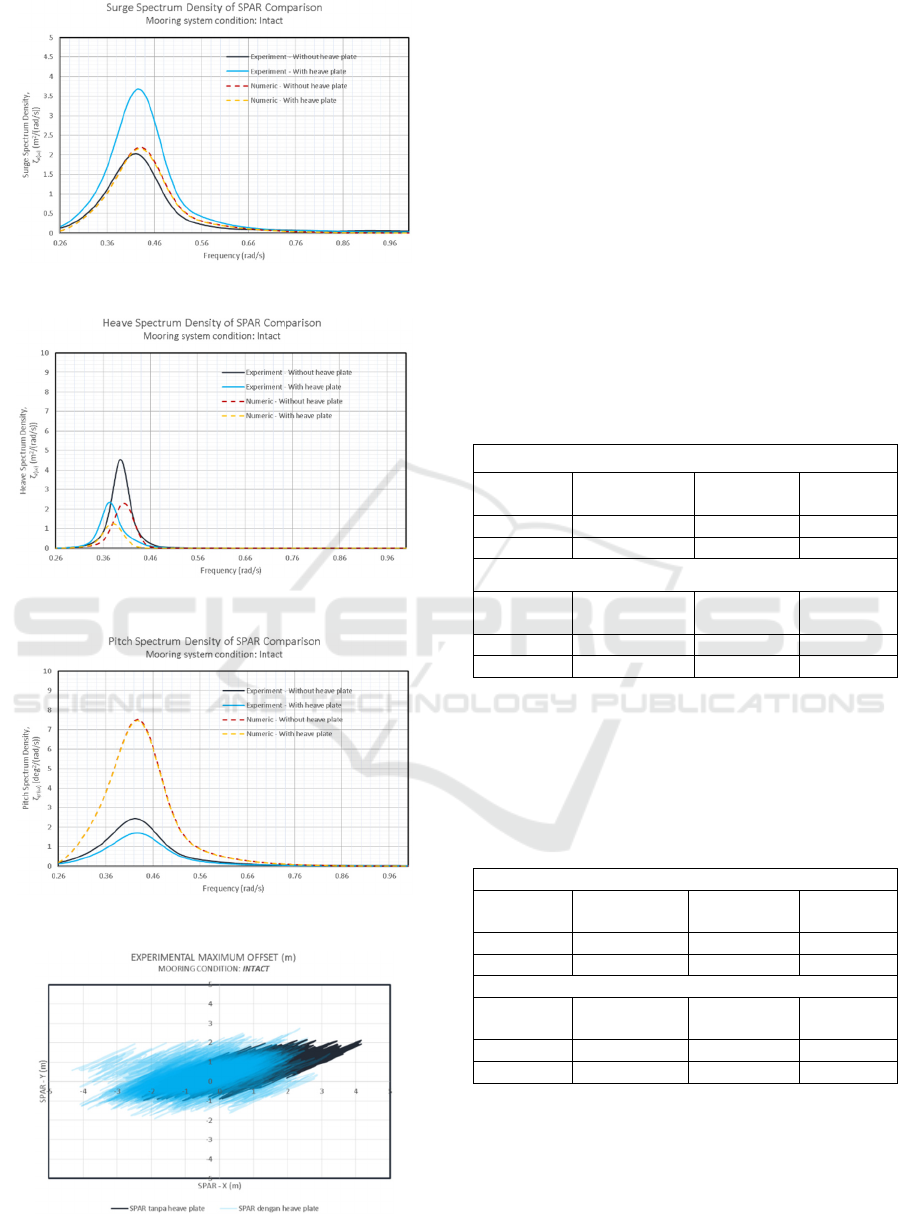
Figure 11: Example of surge responses spectrum density.
Figure 12: Example of heave responses spectrum density.
Figure 13: Example of pitch responses spectrum density.
Figure 14: Offset of SPAR graphic example.
All responses assessed from experiment and
numeric method was plotted together in both intact
and damaged condition to observe the responses
reduction due to heave plate utilization more clearly.
As discussed above, the area below the spectral
density graph is the response’s energy which equals
to the response’s value. Thus, from those comparative
graphics, it can be concluded that there are some
cases of response amplifications and reductions after
heave plate utilizations. All the results are presented
in Table 4 to Table 7 below.
5.5.1 Surge Responses
All of the calculation’s results of surge significant
response’s changes in each conditions are presented
in Table 4 below.
Table 4: Significant surge of SPAR.
Significant surge responses (m) – Experimental
Condition
Without
heave plate
With heave
plate
Reduction
Intact 1.64 1.74 -6.15%
Damaged 1.83 1.82 0.60%
Significant surge responses (m) – Numerical
Condition
Without
heave plate
With heave
plate
Reduction
Intact 1.16 1.15 0.84%
Damaged 1.06 1.05 0.86%
5.5.2 Heave Responses
All of the calculation’s results of heave significant
response’s changes in each conditions are presented
in Table 5 below.
Table 5: Significant heave of SPAR.
Significant heave responses (m) – Experimental
Condition
Without
heave plate
With heave
plate
Reduction
Intact 0.97 0.73 24.16%
Damaged 1.06 0.71 33.29%
Significant heave responses (m) – Numerical
Condition
Without
heave plate
With heave
plate
Reduction
Intact 0.73 0.54 26.39%
Damaged 1.12 0.71 27.84%
5.5.3 Pitch Responses
All of the calculation’s results of pitch significant
response’s changes in each conditions are presented
in Table 6 below.
ISOCEEN 2019 - The 7th International Seminar on Ocean and Coastal Engineering, Environmental and Natural Disaster Management
188

Table 6: Significant pitch of SPAR.
Significant pitch responses (m) – Experimental
Condition
Without
heave plate
With heave
plate
Reduction
Intact 1.46 1.20 17.65%
Damaged 1.34 1.40 -4.56%
Significant pitch responses (m) – Numerical
Condition
Without
heave plate
With heave
plate
Reduction
Intact 2.14 2.13 0.44%
Damaged 2.00 1.99 0.44%
5.5.4 Maximum Offsets
All of the calculation’s results of maximum offsets
changes in each conditions are presented in Table 7
below.
Table 7: Maximum offsets of SPAR.
Maximum offsets of SPAR (m)
Intact mooring system
Method
Without
heave plate
With heave
plate
Reduction
Experiment 4.65 4.36 6.22%
Numeric 2.46 2.23 9.61%
Damaged mooring system
Method
Without
heave plate
With heave
plate
Reduction
Experiment 5.02 3.43 31.69%
Numeric 2.37 2.11 11.22%
As stated before, the maximum offsets value was
obtained by plotting the surge and sway responses in
each condition during simulation together, then the
furthest SPAR movement from the initial condition
was calculated as the maximum offset. The plotted
graphic example can be seen in Figure 14.
6 CONCLUSIONS
The findings of the study could be revealed as
follows:
Heave plate utilization does not constantly and
significantly reduce surge responses. It is
indicated by the biggest reduction of surge
responses that occurs during simulation was only
0.86%, which happened in numerical analysis.
There were some inconsistency happened in
experimental method, which the surge responses
was amplified by 6.15% in intact mooring system.
This inconsistency potentially caused by the
couple response between surge and pitch. On the
contrary, the heave plate utilization does reduce
the heave responses of SPAR, consistently and
significantly. It is indicated by the significant
reduction that occurs in every condition of
experimental and numerical study. The biggest
reduction happened in damaged mooring system
during experimental study, which was 33.29%. As
for pitch, the heave plate utilization numerically
does not affects the responses significantly, it is
indicated by the reduction are only 0.44% in each
condition. Yet, in the experimental study the pitch
responses inconsistently changes. Where in intact
mooring system it was reduced up to 17.65%, and
while in damaged mooring system it was
amplified by 4.56%. In some conditions, SPAR
model satisfies the requirements of Matthieau
instability to occurs, this phenomenon potentially
become the cause of the inconsistency in pitch
responses.
Heave plate utilization does reduce SPAR
maximum offsets consistently in every
conditions. The biggest reduction happened in
damaged mooring system of experimental
analysis, which was 31.69%.
The comparison between two methods has found
that in surge responses, inconsistency happened
while in intact mooring system. In the numerical
analysis, the surge responses are slightly reduced,
yet in experiment it was amplified. In heave
responses the results of the two method shows a
convenient agreement, where it has been reduced
consistently and significantly in both methods. As
for pitch, inconsistency happened while in
damaged mooring system, where experimentally
it was a bit amplified, but numerically it was
slightly reduced.
REFERENCES
Soeb, M. R., Islam, A. B. M. S., Jumaat, M. Z., Huda, N.,
dan Arzu, F., 2017. Response of Non-linear Offshore
SPAR Platform under Wave and Current. Ocean Eng.
144, 296-304.
Glanville, R., Paulling, J., Halkyard, J., Lehtinen, T., 1991.
Analysis of the SPAR Floating Drilling Production and
Storage Structure. In: Proceedings of the Offshore
Technology Conference, 6–9 May, Houston, Texas.
Offshore Technology Conference.
Horton, E., Halkyard, J., 1992. A SPAR Platform for
Developing Deep Water Oil Fields. MTS 998–1005.
Jonkman, J. M. and Matha, D. (2011), "Dynamics of
Offshore Floating Wind Turbines-analysis of Three
Concepts", Wind Energy, vol. 14, no. 4, pp. 557-569.
Experimental Study of the Effect of Waves on SPAR Responses with and without Heave Plate in Intact and Damaged Mooring Systems
189

Tao, Longbin, Lim, K. Y., and Thiagarajan K., 2004. Heave
Response of Classic SPAR with Variable Geometry.
Journal of Offshore Mechanics and Arctic Engineering.
Jain, A. K., and Agarwal A. K., 2003. Dynamic Analysis of
Offshore SPAR Platforms. Defence Science Journal,
Vol. 53, No. 2, 211-219. Indian Institute of Technology
Delhi, New Delhi – 110 016.
Seebai, T, and R Sundaravadivelu. 2009. “Effect of Taut
and Catenary Mooring on Spar Platform with 5MW
Wind Turbine.” Proceedings of the Eighth (2009)
ISOPE Ocean Mining Symposium. Chennai: ISOPE.
52-58.
Djatmiko, Eko Budi. 2012. Perilaku dan Operabilitas
Bangunan Laut di Atas Gelombang Acak. Surabaya:
ITS Press.
Fischer, F.J., Gopalkrishnan, R., 1998. Some observations
on the heave behaviour of spar platforms. Journal of
Offshore Mechanics and Arctic Engineering, 120, pp.
221—225.
Haslum, H. A. and Faltinsen, O. M., 1999. Alternative
Shape of Spar Platforms for Use in Hostile Areas.
Offshore Technology Conference, OTC 10953,
Houston, Texas.
Sudhakar, S. Dan Nallayarasu, S. “Hydrodynamic
Responses of a SPAR Hull with Single and Double
Heave Plates in Random Waves”. Internasional
Journal of Ocean System Engineering. Chennai, India
(2014).
Subbulakshmi, A., Jose, J., Sundaravadivelu, R., and
Selvam, R. P., 2015. Effect of Viscous Damping on
Hydrodynamics Response of SPAR with Heave Plate.
International Conference on Water Resources, Coastal
and Ocean Engineering (ICWRCOE 2015).
Department of Ocean Engineering, Indian Institute of
Technology Mardras, Chennai – 600 036, India.
Herdayanditya, I. 2017. Studi Analitis, Numeris, dan
Eksperimen Olah Gerak dan Dinamika Tegangan Tali
Tambat SPAR dengan Variasi Heading Gelombang.
Surabaya: Tugas Akhir Akhir Jurusan Teknik Kelautan,
ITS.
Chitrapu, A.S., Saha, S., Salpekar, V.Y. 1998. Time domain
simulation of spar platform response in random waves
and current. In: 17th International Conference on
Offshore Mechanics and Arctic Engineering,
(OMAE98-0380), pp. 1-8.
ISOCEEN 2019 - The 7th International Seminar on Ocean and Coastal Engineering, Environmental and Natural Disaster Management
190
