
Transmission Coefficient Analysis Floating Breakwater using
Computational Fluid Dynamics (CFD)
Asfarur Ridlwan
1
, Haryo Dwito Armono
2
and Shade Rahmawati
2
1
Department of Ocean Engineering, Institut Teknologi Sumatera, Jati Agung, South Lampung, Indonesia
2
Department of Ocean Engineering, Institut Teknologi Sepuluh Nopember, Sukolilo, Surabaya, Indonesia
Keywords: Computational Fluid Dynamics, Floating Breakwater, Porous Breakwater, Transmission Coefficient.
Abstract: Breakwater is one of the coastal structures that was built with the aim to protect the coastal area against
waves. This structure is generally designed to protect ships and facilities at the Port. Breakwaters that are
often applied are conventional breakwaters such as the rubble mound type. Climate change that causes tidal
variations and sea level height which tends to change at any time, as well as unsuitable soil conditions to
receive large structural loads will be costly and more economical if using floating breakwater. Over time, the
demand for floating breakwater development increased so that scientists and engineers did a lot of research
development both in physical experiments and numerical models. In this study numerical simulations will be
conducted by exploring the porous shape of floating breakwater from the Christensen experiment. The aim is
to get the most optimal transmission coefficient. Numerical simulations using the Computational Fluid
Dynamics (CFD) method with the help of Flow 3D Software. Validation is done first between numerical tests
and experiments to get a valid approach before exploring the development of shape.
1 INTRODUCTION
Breakwater is one of the coastal structures that was
designed to protect ships, marine ecosystems, port
facilities, and for coastal protection against waves.
Conventional breakwater is generally used in shallow
water and the geometry is bottom founded.
Unconventional breakwater is known as floating
breakwater for the deeper the water. However, there
are several advantages using a Floating Breakwater
(FB). For example, more environmentally friendly to
pollution and sedimentation problems because it does
not inhibit water circulation (Dai et. al, 2018), a little
effort to move another location (Christensen et. al,
2018). When sea water level (SWL) rises due to tides
or climate change, FB can adjust so that is more
economical than bottom founded. Further, floating
breakwater may be the only solution for high load
structures to poor soil conditions.
Floating breakwater (FB) was the first applied in
1811 to protect marinas and ships against waves at the
port of Plymouth, England (Hales, 1981). Starting in
20th century, the demand of floating breakwater
increased to anticipate infrastructures development of
ocean space. So, Scientist and Engineers did a great
developing FB research either experimentally,
numerically, or combination of both. Most research is
usually done on various geometric shapes,
configurations, or bilge keels of FB on the wave
characteristics.
Experimentally and numerically of floating
breakwaters have been studied. For instance,
(Christensen et al., 2018) conducted physical
experiments and numerical modeling to evaluate
transmission, reflection, and performances of Regular
Pontoon (RG), WP, and WP-P100. The study showed
that wing plates (WP) reduced the motions of floating
breakwater, while wing plates and porous media
(WP-P100) reduced the refection and transmission
most effectively. (Ji Chunyan et al., 2018) conducted
experimental study for a dual rectangular pontoon
floating breakwater with two treatments (single-row
and double-row). The result indicated that double-
row floating breakwater significantly reduced
transmission especially for short-period wave than
single-row floating breakwater. (Cho, 2011)
investigated transmission of incident waves
interacting with vertical porous side plates using
matched eigenfunction expansion method (MEEM).
(Wang and Sun, 2010) conducted experimental study
of a porous floating breakwater with fabricated large
numbers of diamond-shaped blocks to reduce
Ridlwan, A., Armono, H. and Rahmawati, S.
Transmission Coefficient Analysis Floating Breakwater using Computational Fluid Dynamics (CFD).
DOI: 10.5220/0010059301430149
In Proceedings of the 7th International Seminar on Ocean and Coastal Engineer ing, Environmental and Natural Disaster Management (ISOCEEN 2019), pages 143-149
ISBN: 978-989-758-516-6
Copyright
c
2021 by SCITEPRESS – Science and Technology Publications, Lda. All rights reserved
143
transmitted wave height and mooring force. (Dong et
al., 2008) conducted two-demensional physics model
test on three types of structures: the single box, the
double box, and the board net floating breakwaters.
The result showed that transmission coefficient
depend on the width of board, and the length of the
mooring chain lying on the sea bottom. (Rahman et
al., 2006) conducted numerical study of single
pontoon floating breakwater to estimate the nonlinear
dynamics using the volume of fluid (VOF) method.
This paper presents numerical study or simulation
to analysis transmission coefficients using
computational fluid dynamics (CFD) method. The
basic geometry is regular ponton floating breakwater
that modified in several notched shape on the side of
structure. Data parameters and numerical model
verifications based on the result of experiments that
conducted by (Christensen et al., 2018).
2 NUMERICAL SIMULATIONS
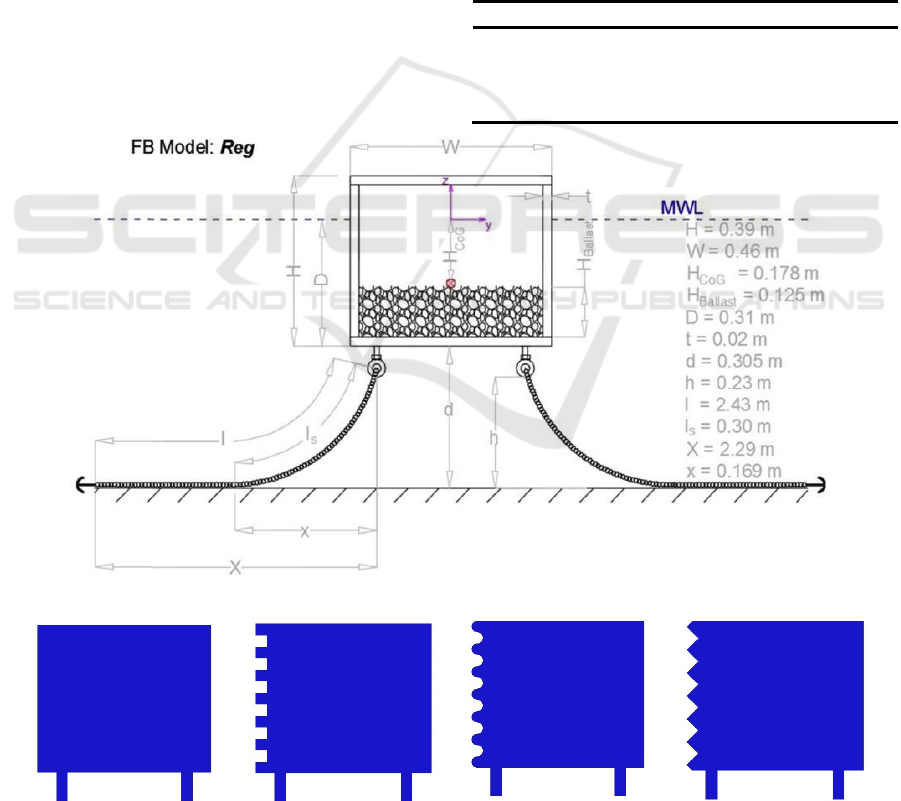
2.1 Floating Breakwater Geometry
Floating breakwater geometry is based on Regular
Pontoon (RG) experiment test conducted by
(Christensen et al., 2018). The experiment conducted
two-dimensional physical model test where cross-
sections were tested and analysed in wave flume. The
data parameters are shown in Table 1 and illustrated in
Figure 1. Furthermore, the experimental model will be
developed on porous shape on side plates with
numerical simulations using computational fluid
dynamics (CFD) to optimalization wave transmission.
The developed shapes can be seen in Figure 2.
Table 1: Regular Pontoon Dimensions.
No Geometry Dimensions [m]
1 Length (L) 0.58
2 Width (W) 0.46
3 Draft (D) 0.31
4 Height (H) 0.39
Figure 1: Basic Cross-section Regular Pontoon FB.
(a) (b) (c) (d)
Figure 2: Developed Model Floating Breakwater (Notched Shape).
ISOCEEN 2019 - The 7th International Seminar on Ocean and Coastal Engineering, Environmental and Natural Disaster Management
144
2.2 Data Parameters
The data were composed of wave parameters that are
scaled. The scale is assumed to use Froude scalling
by 1:65. Froude scalling was considered valid as long
as viscous effects are negligible. The 2
nd
stokes wave
was used on this simulation. Table 2 shows conditions
for numerical simulations.
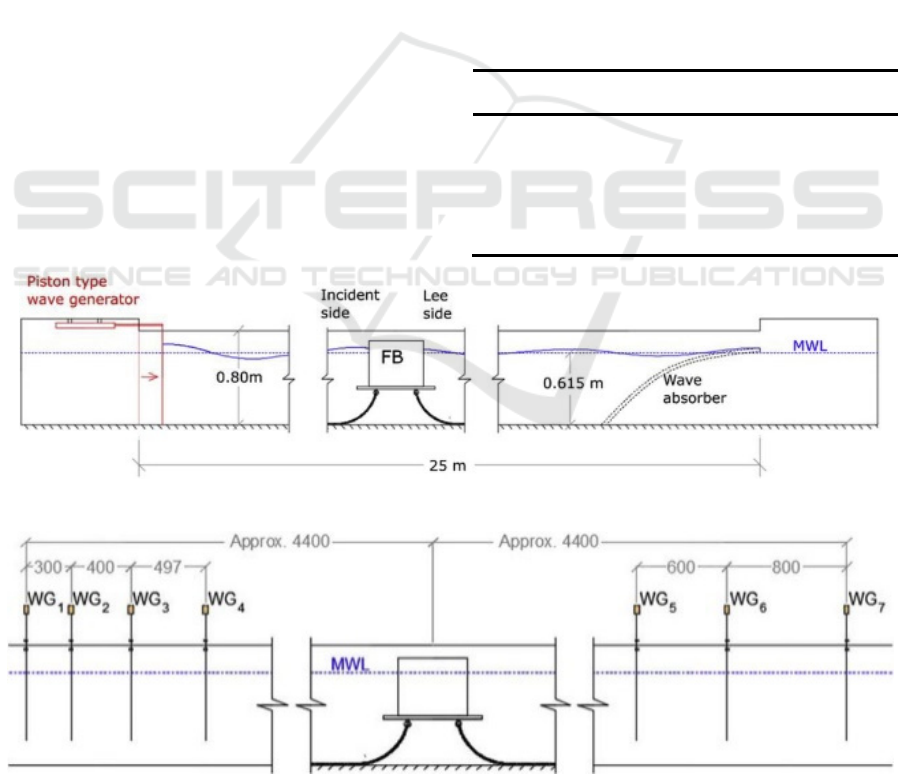
2.3 The Wave Flume
The flume is 28 m long, 0.6 m wide, 0.8 m high, and
0.615 m initial surface elevation. The flume was filled
water with density of 1000 kg/m
3
. The flume was
equipped with wave maker at one and wave absorber
at the other end. Where, the floating breakwaters were
placed almost cover the entire width of flume to
reduce the effect of sidewalls. See, Fig. 3 for
ilustraton.
2.4 Wave Measurements and Analysis
The objective of this study was to obtain the
transmission coefficient (C
T
), the ratio of transmitted
wave height (H
T
) to incident wave height (H
i
). See
equation 1 below:
C
T
= H
T
/ H
i
(1)
Measurement of transmitted and incident wave
heights were represented by surface elevation using
wave gauges. 4 wave gauges were placed on the
incident side, while 3 wave gauges were placed on the
lee side. See figure 4.
2.5 Mooring System
The mooring lines were installed only to keep floating
breakwater on position. The mooring system have an
effect on the performances of stability and the
mooring forces, but in this study no analysis of both.
There are four mooring lines on each corner of
floating breakwater, two on each side of the cross-
section. The submerged weight of the mooring line
was w =0.589 N/m. The mooring line made from
polyethylene (PE) with density of 880 kg/m
3
and
diameter of 0.01 m. The dimension of mooring line
was illustrated on figure 1.
Table 2: Parameters Wave Data.
No.
Wave
Length
Wave
Period
Frequency
Depth
Ratio
Wave
Height
L[m] T[s] f[Hz] h/L[] H
{
2%
}
1 1.174 0.868 1.152 0.524 0.023
2 1.883 1.116 0.896 0.327 0.036
3 2.252 1.240 0.806 0.273 0.041
5 3.333 1.613 0.620 0.185 0.052
6 4.024 1.861 0.538 0.153 0.055
Figure 3: Sketch of the wave flume.
Figure 4: Position Wave Gauges in Unit [mm].
Transmission Coefficient Analysis Floating Breakwater using Computational Fluid Dynamics (CFD)
145
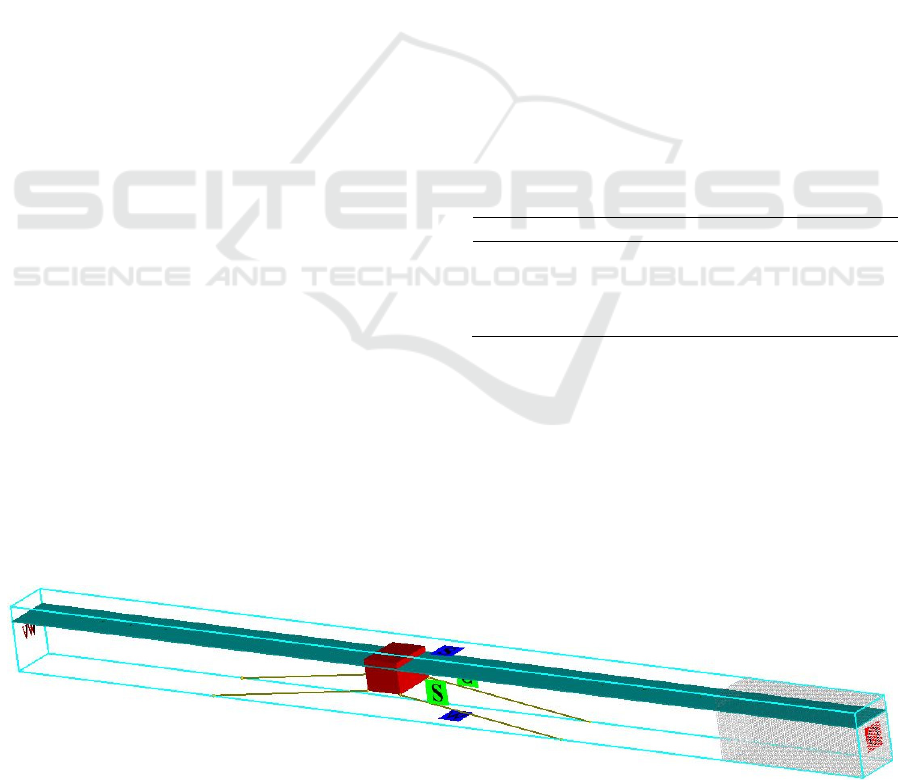
2.6 Boundary Conditions
The purpose of boundary conditions was to determine
model conditions that represented experiment
conditions. See figure 5. Boundary conditions used in
the model are as follow:
(1) Free surface (Wave): A wave boundary condition
was defined at left (X Min). A surface wave
entered the computational domain and
propagated in the direction normal to the
boundary. The wave was set 2
nd
stokes as wave
generator represent the physical wave conditions
at the boundary.
(2) Outflow: The outflow boundary condition was
defined at right (X Max). It allowed users to
numerically investigate the effects of wave
interactions with structures. The capability
permited a reduction in the extent of the
computing mesh needed for accurate
computations. A wave-absorbing layer used to
reduce reflection of periodic wave at an open
boundary.
(3) Symmetry: The symmetry condition was defined
at front (Y Min), behind (Y Max), below (Z
Min), and up (Z Max). No-slip conditions were
imposed using the wall shear-stress options
described in the Prandtl Mixing Length model. A
symmetry condition can be specified as free-slip
conditions that have a non-zero wall shear-stress.
2.7 Meshing
Mesh block was used to determine the area that
modelled. The smaller mesh will be more detailed,
but the output files will be larger and simulations run
longer. Floating breakwater modelling used one mesh
block with a meshing size of 0.04 m at total length
(X-axis) is 28 m, total width (Y-axis) is 0.6 m, and
total height (Z-axis) is 0.8 m.
3 RESULTS AND DISCUSSION
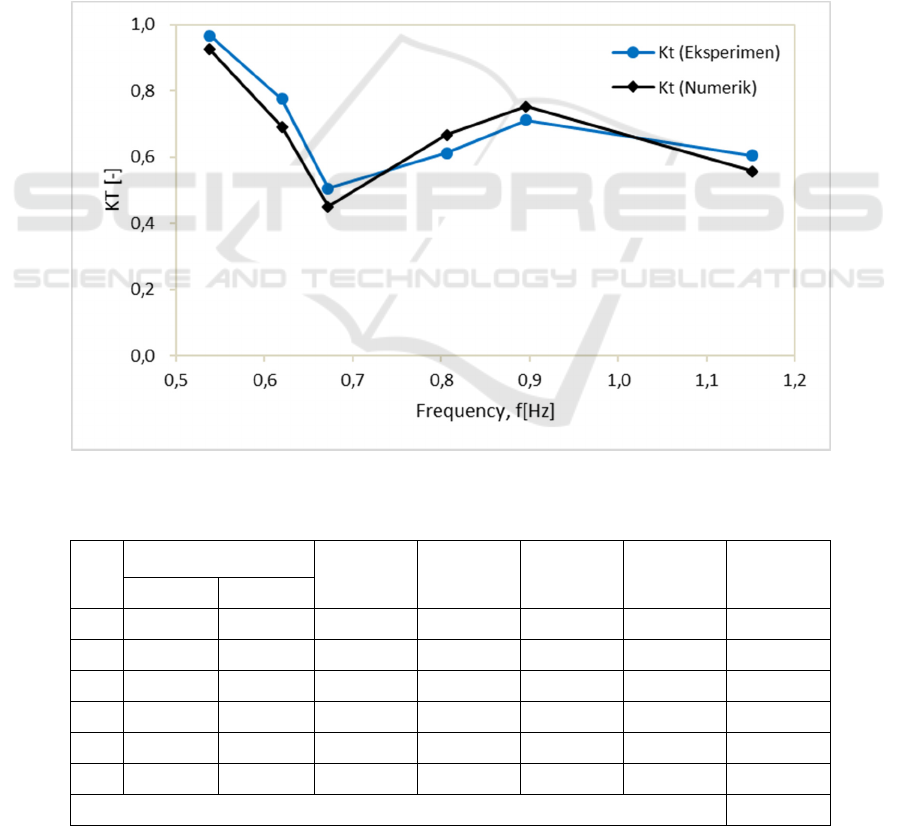
3.1 Validation
Validation is done by comparing the results of
transmission coefficient of the (Christensen, 2018)
study with the numerical study of the Computational
Fluid Dynamics (CFD) aided by Flow 3D Software.
Christensen has conducted study on three shapes of
floating breakwater, but only one shape of floating
breakwater validated in this study is Regular Pontoon
(RG). The purpose of validation is to find out whether
the numerical study conducted is in accordance with
the experimental test. Validation is done in a simpler
shape (RG). If validation are represented, then the
development of the model can be done to more
optimal shapes.
In this study, validation is based on comparison of
the transmission coefficient of numerical test
simulation and experimental test. The error rate refers
to Mean Absolute Percentage Error (MAPE) theory.
MAPE theory can be seen on table 3. As for
validation results can be seen in figure 6. Based on
MAPE theory, this study can be said to be validated
and can be developed more optimal shapes.
Table 3: MAPE Theory.
No MAPE Value Prediction
1
MAPE ≤ 10%
High
2
10% < MAPE ≤ 20%
Good
3
20% < MAPE ≤ 50%
Reasonable
4
MAPE > 50%
Low
3.2 Transmission Coefficient Regular
Pontoon (RG)
Regular Pontoon is one type of floating breakwater
that was examined by (Christensen, 2018). In this
section, the results of transmission coefficient of
numerical simulation results can be seen in table 4.
The transmission coefficient is obtained from the
analysis of the output surface elevation results in
Figure 5: Boundary Conditions Model.
ISOCEEN 2019 - The 7th International Seminar on Ocean and Coastal Engineering, Environmental and Natural Disaster Management
146
Flow 3D software. Surface elevation data used to
analyze the transmission coefficient are obtained
from wave gauge 1 (in front of the structure) and
wave gauge 5 (behind the structure). Surface
elevation data is converted into wave height using
Wave Analysis (WAVAN) software. Then, to get the
transmission coefficient the calculation is according
to formula (1). The results of regular pontoon
coefficient transmission are shown in table 4.
3.3 Transmission Coefficient
Development Notched Shape
It is still planned to analyze the transmission
coefficient of porous shapes floating breakwater.
There are 3 exploratory shapes of porous floating
breakwater, see figure 2. In this analysis, it used Flow
3D software such as what was done in getting the
transmission coefficient of without porous shape
floating breakwater (RG).
4 CONCLUSIONS
Four porous shapes of floating breakwater will be
examined in experimentally and numerically. But,
still planned. The porous shape is placed in lee side
and back side of the structure. The basic shape of the
structure is regular box. This experiment was
conducted by (Christensen, 2018) in a wave flume in
the hydraulic laboratory at the Technical University
of Denmark. As well as numerical simulations carried
out by the authors by taking Christensen’s
experimental data. Numerical analysis using
Figure 6: Validation Results.
Table 4: Value of Validation Results.
No
Data Input
H
I
H
T
C
T (experiment)
C
T (numeric)
Error (%)
H [m] T [s]
1 0,0230 0,8680 0,0353 0,0197 0,6046 0,5581 8,3370
2 0,0360 1,1160 0,0329 0,0248 0,7114 0,7538 5,6248
3 0,0410 1,2400 0,0491 0,0328 0,6125 0,6680 8,3117
4 0,0490 1,4880 0,0521 0,0235 0,5054 0,4511 12,0483
5 0,0520 1,6130 0,0589 0,0408 0,7756 0,6927 11,9677
6 0,0550 1,8610 0,0498 0,0461 0,9673 0,9257 4,4936
Mean Absolute Precentage Error (MAPE) 8,4638
Transmission Coefficient Analysis Floating Breakwater using Computational Fluid Dynamics (CFD)
147

Computational Fluid Dynamics (CFD) method with
the help of Flow 3D software. The aim is to optimize
the transmission coefficient by exploring the porous
shape, due to limited experiments. Previously,
validation was done between numerical and
experimental.
ACKNOWLEDGEMENTS
This study is a requirement to pass the Master of
Oceang Enginering. The author is very grateful to the
supervisor who has helped in providing the sciences
so that this research is complete.
REFERENCES
Ali, A., 2006. Floating Transshipment Container Terminal.
Master of Science Thesis. Delft University of
Technology: Netherlands
Armono, H.D., Supriadi, H., Yuniardo, R.K., 2009.
Pemakaian Floaton untuk Gelombang Pemecah
Terapung (Floating Brakwater). Prosiding Seminar
Nasional Teori dan Aplikasi Teknologi Kelautan IX,
Kampus ITS Surabaya
Armono, H.D., Suastika, K.S., Sujantoko., Sholihin.,
Supriadi, H., 2011. Laporan Akhir Riset Andalan
Perguruan Tinggi dan Industri: Rancang Bangun
Floating Breakwater High Density Polyethylene untuk
Pulau-pulau Kecil di Indonesia. LPPM ITS Surabaya
Biesheuvel, A.C., 2013. Effectiveness of Floating
Breakwaters: wave attenuating floating structures.
Master of Science Thesis. Delft University of
Technology: Netherlands
Bleck, M., Oumeraci, H., 2001. Wave Damping and
Spectral Evolution at Art Reef. Proceedings 4
th
international Symphosium on Ocean Wave
Measurement and Analysis. San Fransisco, California,
USA.
Chakrabarti, S.K. 1987. Hydrodinamics of Offshore
Structures. CBI Industries, Inc: USA.
Cho., I., H., 2016. “Transmission coefficients of a floating
rectangular breakwater with porous side plates,” Int. J.
Nav. Archit. Ocean Eng., vol. 8, no. 1, pp. 53–65, doi:
10.1016/j.ijnaoe.2015.10.002.
Christensen, E.D., Bingham, H.B., Friis, A.P.S., 2018. An
Experimental and Numerical Study of Floating
Breakwaters. Ocean Eng. 137, 43-58.
https://doi.org/10.1016/j.coastaleng.2018.03.002.
Dai, J., Wang, C.M., Utsunomiya, T., Duan, W., 2018.
Review of Recent Research and Developments on
Floating Breakwaters. Ocean Eng. 158, 132-151.
https://doi.org/10.1016/j.oceaneng.2018.03.083.
De Roiij, G.V.P., 2006. A Very Large Floating Container
Terminal. Delft University of Technology: Netherlands
Dong, G.H., Zheng, Y.N., Li, Y.C., Teng, B., Guan, C.T.,
Lin, D.F., 2008. Experiments on Wave Transmission
Coefficients of Floating Breakwaters. Ocean Eng. 35,
931-938.https://doi.org/10.1016/j.oceaneng.2008.01.010
Fatnanta, F., 2009. Kajian Perilaku Transmisi dan
Stabilitas Pemecah Gelombang Kantong Pasir Tipe
Tenggelam. Disertasi: ITS Surabaya
Fauzi, M.A.R., 2017. Perbandingan Perfoma Bentuk
Terumbu Buatan dalam Mengurangi Tinggi
Gelombang. Laporan Thesis: Institut Teknologi
Sepuluh Nopember, Surabaya
Fousert, M.W., 2006. Floating Breakwater “A Theoretical
Study of a Dynamic Wave Attenuating System”. Final
Report of Master Thesis: Delf University of
Technology
Hales, L.Z., 1981. “Floating Breakwater: State of The Art,
Litrature Review,” TR 81-1, U.S. Army Coastal
Engineering Research Center, CE, Fort Belvior,
Virginia, October.
Harms, V.W., Westerink, J.J., Sorensen, R.M.,
AAcTamany, J.E., 1982. Coastal Engineering
Research Center
Headland, J.R., 1990. Floating Breakwaters. Dalam Buku:
Marine Structures Engineering: Specialized
Applicationsi. Chapman & Hall An International
Thomson Publishing: USA
Holthuijsen, L.H., 2007. Wave in Oceanic and Coastal
Waters. Cambridge University Press: United Kingdom
Integrated Publishing. 2019. Breakwaters and Jetties.
http://constructionmanuals.tpub.com/14044/css/Offsho
re-296.htm. (di akses 11 Agustus 2019)
Kim, C.G., Kim, S.H., Kim, T.H., Baik, C.I., 2001.
Monitoring of Floating Fish Reef Installed in Koje
Coastal Waters. Ocean and Polar Research. 23(3), 305-
310.
Leach, P.A., McDougal, W.G., Sollitt, C.K., 1985. Hinged
Floating Breakwater. J. Waterway, Port, Coastal,
Ocean Eng. 111(5), 895-909. https://doi.org/10.1061/
(ASCE)0733-950X(1985)111:5(895)
Le Mehaute, B. 1976. An Introduction to Hydrodinamics
and Water Wave. Springer Verlag: Berlin
Massie, W.W., Journee, J.M.J., 2001. Offshore
Hydromechanics. Delft University of Technology:
Netherlands
McCartney., Bruce, L., Asce, M., 1985. Floating
Breakwater Design. J. Waterway, Port, Coastal, Ocean
Eng. 111(2), 304-318. https://doi.org/10.1061/
(ASCE)0733-950X(1985)111:2(304)
PIANC. 1994. Floating Breakwaters: A Practical Guide for
Design and Construction. PIANC: Belgium
Rahman, Md.A., Mizutani, N., Kawasaki, K., 2006.
Numerical Modeling of Dynamic Responses and
Mooring Forces of Submerged Floating Breakwater.
Coastal Eng. 53, 799-815. https://doi.org/10.1016/
j.coastaleng.2006.04.001
Akhwady, R., 2012. Kinerja Terumbu Buatan Silinder
Berongga (Bottle Reef) sebagai Pemecah Gelombang
Ambang Terbenam. Laporan Disertasi: Institut
Teknologi Sepuluh Nopember, Surabaya.
ISOCEEN 2019 - The 7th International Seminar on Ocean and Coastal Engineering, Environmental and Natural Disaster Management
148

SF Marina. 2019. Floating Brakwaters. https://www.
sfmarina.com/solutions/breakwaters/. (diakses 11
Agustus 2019)
Triatmodjo, B., 1999. Teknik Pantai. Beta Offset:
Yogyakarta.
Tsinker, G.P., 1995. Marine Structures Engineering:
Specialized Applicationsi. Chapman & Hall An
International Thomson Publishing: USA
U.S. Navy Corps of Engineers., 1984. Shore Protection
Manual: Coastal Engineering Research Center
(CERC). Washington DC.
U.S. Navy Corps of Engineers., 2008. Coastal Engineering
Manual: Complete All Parts, All Sections. Washington
DC.
Verhagen, H.J., D’Angremond, K., dan Van Roode, F.,
2008. Breakwaters and Closure dams. VSSD
Publising: Delft Netherlands.
Transmission Coefficient Analysis Floating Breakwater using Computational Fluid Dynamics (CFD)
149
