
Experimental Study on the Effect of Mooring Angle on Mooring
Tension of Porous Saw Type Floating Breakwater
Sujantoko, E. B. Djatmiko, W. Wardhana, H. D. Armono, Sholihin and M. F. Ali
Department of Ocean Engineering, Institut Teknologi Sepuluh Nopember, Surabaya, Indonesia
Keywords: Floating Breakwater, Porous, Mooring Tension, Model.
Abstract: The floating breakwater is commonly used as an alternative solution to conventional fixed breakwaters and
can be used effectively in coastal areas in environments with relatively small waves, poor soil conditions,
deep-sea depth, and shore with intense erosion rate. Since it is a floating structure, a mooring system is used
to maintain its position. This study aims to determine the mooring tension that occurs on each mooring rope
with a physical model test. This research was conducted on the type of pontoon and porous saw. In this study,
it was found that on a porous saw type, the greatest maximum tension occurred at the mooring angle 30⁰ (3.98
N) while the smallest maximum tension occurred at the mooring angle 60⁰ (0.73 N). The pontoon type also
gives the same result where the 30⁰ mooring angle gives the highest maximum tension (4.91 N) while the 60⁰
mooring gives the smallest maximum tension (1.27 N). Besides, the porous saw type of floating breakwaters
can provide smaller mooring tension than the pontoon type. The porous saw type can reduce mooring tension
by 10% up to 15% at an angle of 30⁰ - 60⁰.
1 INTRODUCTION
In recent years, a lot of efforts have been made to
manage and utilize the coastal areas of Indonesia.
Such as industry, trade, transportation, residential,
and the tourism sector. Thus, in line with population
growth and the increase of socio-economic
development activities, the value of coastal areas
continues to grow. Coastal areas, despite having high
economic value, are vulnerable to many threats. One
of the serious threats faced by coastal areas is
abrasion which can cause coastal area reduction, due
to the large amount of wave energy that comes
directly to the coastal area without the wave energy
being absorbed beforehand.
Because it is considered important to avoid
negative effects due to abrasion, it is very necessary
to build and install a coastal protection structure that
can reduce wave energy towards the coast area. One
of the coastal protection structures that can protect
the shore area from abrasion and erosion is the
breakwater. A breakwater is a structure built to
protect the area behind it from a wave attack. There
are two types of breakwaters. Fixed breakwater and
floating breakwater, that are built depending on the
water depth and tides condition where the structure is
placed. Floating breakwater has several advantages
than the fixed breakwater. Its efficiency is almost
independent of tides and sea-level rise, its
dependence on the environment is low, the impact of
a floating breakwater to the environment is low, the
cost of construction and decommissioning is low, the
time required for installation is short, and it is
possible to reset the module and/or to set the layout if
there is a change in the future (Ruol et. al., 2012).
However, since it is a floating structure, the anchor
system is required which is placed at the bottom of
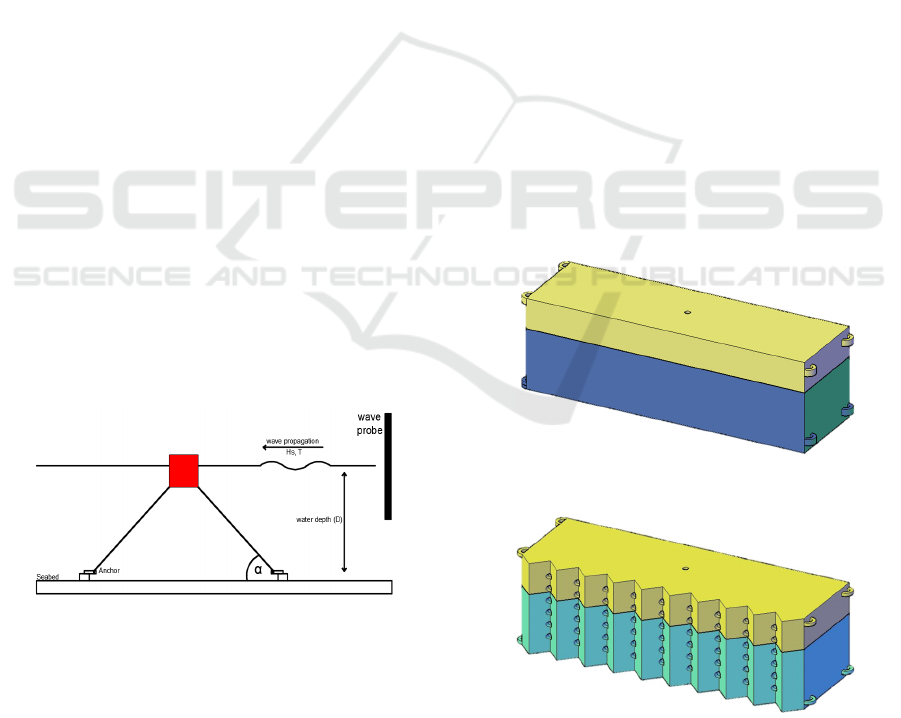
the sea (Fousert, 2006). Figure 1 shows two types of
floating breakwater schematically (Pianc, 1994).
Figure 1: Two types of floating breakwater schematically.
There are so many types of floating breakwater,
the most commonly used is the pontoon type which
is connected and tethered to the seabed using a cable
94
Sujantoko, ., Djatmiko, E., Wardhana, W., Armono, H., Sholihin, . and Ali, M.
Experimental Study on the Effect of Mooring Angle on Mooring Tension of Porous Saw Type Floating Breakwater.
DOI: 10.5220/0010057000940099
In Proceedings of the 7th International Seminar on Ocean and Coastal Engineering, Environmental and Natural Disaster Management (ISOCEEN 2019), pages 94-99
ISBN: 978-989-758-516-6
Copyright
c
2021 by SCITEPRESS – Science and Technology Publications, Lda. All rights reserved
or chain. A floating breakwater is a floating structure
that requires a mooring system to keep the structure
stay in place (McCartney, 1985). One of the aspects
that must be considered when designing floating
breakwater is the mooring system of the structure.
Moorings, whether constructed of piles or mooring
lines and anchors, must hold a breakwater in place
and a careful assessment of mooring forces during
design storm wave attacks must be made to ensure
the survival of the breakwater. Waves loading
generally dictates the design of floating breakwater
and its mooring system (Tsinker and Gregory, 1995).
In this study, a physical model test will be carried out
to find the maximum tension value on several types
of floating breakwater then examine by comparing
type. Two types are being considered: porous saw
type, and pontoon type. This test will be carried out
by varying the water level as a simulation of tidal
conditions. In the test, the mooring angle will also be
varied by referring to previous research so that the
optimum results are obtained.
2 MATERIALS AND METHODS
2.1 Research Scenario
The floating breakwater model is tied by a mooring
rope with a mooring angle α at water level D and
placed in wave characteristics under significant wave
height Hs and period T (see Figure 2). These four
environmental parameters are independent variables
that will be varied. The effect monitored and recorded
in this test is the mooring rope tension as the response
variable.
Figure 2: Layout sketch of floating breakwater physical
model tests.
2.2 Floating Breakwater Design
The material used in the floating breakwater
prototype is K300 concrete with a concrete density of
2300 kg/m3. The thickness used is 0.2 m. The porous
saw type floating breakwater has the same basic
dimensions (length 10 m, height 3 m and width 3 m)
and also use the same material as the pontoon type.
There is a slight difference between the two models
where the porous saw has a pore which is penetrated
the structure from the front to the back. There is also
a triangle shape lined up in the front of the structure.
In the porous saw type floating breakwater, pipes
are used so that the front and rear sides of the
breakwater are perforated. The pipe used has an
outside diameter of 20 cm using High-Density
Polyethylene (HDPE) material with a density of 960
kg/m3. The two breakwater types above float with a
2-meter draft. The pore in the porous saw type
floating breakwater is take up to 5% area of the
overall area in the side of the structure. The
difference between these two models requires the
thickness of the porous saw type floating breakwater
to be 0.18 m or 0.02 m smaller to keep both drafts are
the same. The reduction was caused by the loss of
buoyant force due to a hole in the floating
breakwater.
2.3 Test Modelling and Scaling
Tests are carried out in the laboratory so a model is
needed from both the structure and the environmental
conditions. in this test a 1:50 scale of length was used.
Figure 3 and 4 show image of both type of floating
breakwaters to be tested.
Figure 3: Floating breakwater type pontoon.
Figure 4: Floating breakwater type porous saw.
Experimental Study on the Effect of Mooring Angle on Mooring Tension of Porous Saw Type Floating Breakwater
95
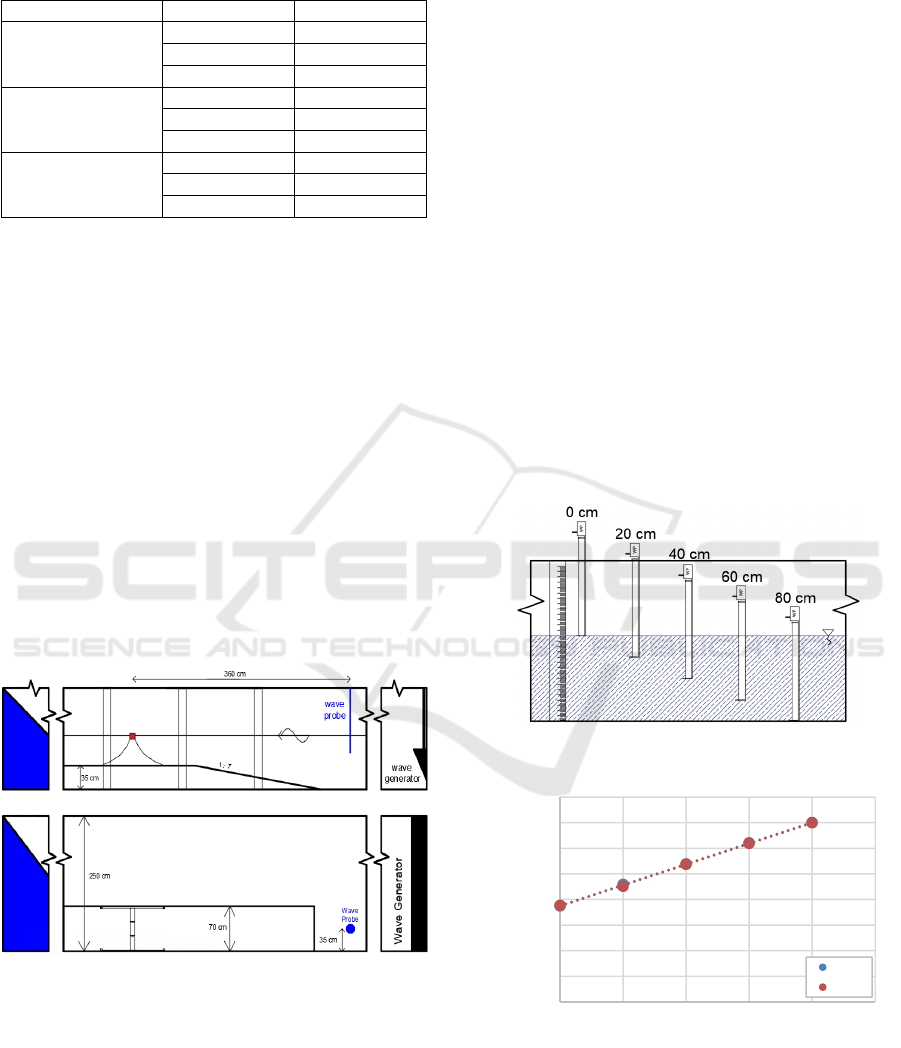
Table 1: The model scale of environmental condition tested
(scale 1: 50 for D and Hs, 1 : √50 for T).
Parameter Prototype Model
Water level
elevation (D)
21,5 m 41 cm
21,5 m 43 cm
22,5 m 45 cm
Wave height (Hs) 1,5 m 3 cm
2 m 4 cm
2,5 m 5 cm
Wave period (T) 7,8 s 1,1 s
9,2 s 1,3 s
11,3 s 1,6 s
The mooring angle (α) are at 30⁰, 45⁰ and 60⁰.
2.4 Physical Model Tests Layout
Setting
Several factors important for conducting the
experiments include physical model design, the
structure layout, and the measurement equipment
used in Wave Flume Laboratory. These factors help
researchers better understand the experiments. A
Wave Probe is placed to record the wave height and
wave period. In this test, an 35 cm artificial seabed
was built at the bottom of the Wave Flume. This
seabed used to adjust the designed water level
scenario. Since the Wave Flume only works if the test
was carried out at a water depth between 41 - 45 cm.
Figure 5 depicts a sketch of the top and side view of
the layout test.
Figure 5: Model sketcth layout of the test.
2.5 Equipment Calibration
The equipment to measure water elevation is Wave
Probes, while Load Cells used to measure mooring
tension. Both types of equipment are calibrated to see
the equipment's condition whether it is still in good
condition to be used in this test or not.
a. Wave Probe calibration
In general, the following steps required in the Wave
Probe calibration process is explained below:
1. The Wave Probe is positioned where the tip of
the Wave Probe touches the surface of the
water. The voltage shown on the control
computer will change slightly and the voltage
will be recorded 3 times which will be averaged.
2. The Wave Probe then moved 20 cm deeper into
the water. The voltage results are then recorded
again 3 times and averaged. This process
repeats until it reaches a depth of 80 cm from
the tip of the probe. The illustration can be seen
in Figure 6.
After the calibration process is carried out, the values
obtained from each water depth are then arranged
into a graph. Figure 7 shows the results of the Wave
Probe calibration before and after the experiment.
From the graph, it can be seen that there is no
significant change and the value of the coefficient of
determination is close to 1 (0.999) which indicates
that the stability of the Wave Probe is still very good
.
Figure 6: Wave Probe calibration process.
Figure 7: Wave Probe calibration graph.
b. Load Cell calibration
Four Load Cells with a capacity of 5 kg are being
installed at the end of the bottom of the floating
breakwater. Calibration is carried out by weighing
y = 20.36x + 1879.6
R² = 0.9999
y = 20.315x + 1871.6
R² = 0.9997
0
500
1000
1500
2000
2500
3000
3500
4000
0 20406080100
Capacitance value (mili volt)
Water Level Elevation (cm)
Before
After
ISOCEEN 2019 - The 7th International Seminar on Ocean and Coastal Engineering, Environmental and Natural Disaster Management
96
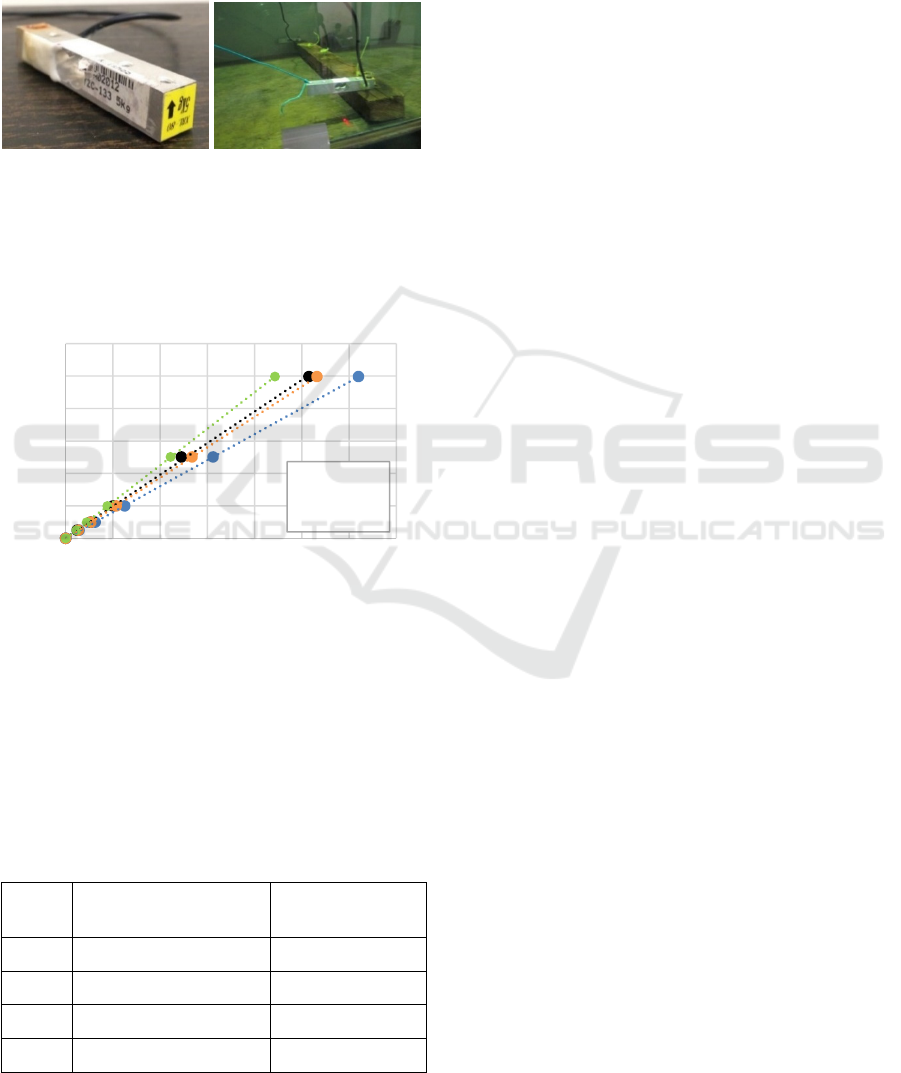
five different loads i.e. 1000 grams, 500 grams, 200
grams, 100 grams, and 50 grams. The load is weighed
using a digital scale beforehand so the actual weight
of each load used is already known. The recorded
load show on the computer will be compared to the
actual weight of each load. The Load Cell used in this
experiment can be seen in Figure 8.
Figure 8: Load Cell with a capacity of 5 kg.
Calibration is done by changing the load on the Load
Cell using a rope freely. Figure 9 shows the
calibration results of each Load Cell used to validate
the results of tension mooring recorded when the test
takes place.
Figure 9: Load Cell calibration graph.
Figure 9 shows that each Load Cell has a different
calibration value. Therefore, during data processing
data, each Load Cell has a different regression
equation. All regression equations (see Table 2) have
the determination coefficient (R
2
) really good (close
to 1). These regression equations used as the
correction factor for the load shown by the recorded
computer.
Table 2: Load Cell calibration equation.
Load
Cell
Calibration Equation
Determination
Coefficient (R
2
)
1 y = 0,9369x – 0,4691 1
2 y = 0,8026x + 0,6541 1
3 y = 0,9728x + 3,6322 0,9992
4 y = 1,1252x + 0,2195 1
3 RESULTS AND DISCUSSION
After all, preparations are completed, mooring
tension data is collected every 2 minutes for each test,
with an increment of 0.5 seconds. The recorded
mooring tensions from each Load Cell recorded in
four different columns then converted into kilograms
(kg). The maximum tension was selected among data
have been collected for analysis.
Preparation before analysis was conducted by
grouping the data based on a combination between
water level elevation and mooring angle. The total
combination is 9 maximum tension with different Hs
and T values. In this test the variables Hs and T are
merged into one parameter, the parameter is known
for wave steepness parameters (Hs/gT2). Each group
of data is then arranged into a graph that shows the
relationship between mooring tension and wave
steepness parameters, Hs/gT2. In addition, linear
regression was also performed on each group of data
to simplify the comparison between data groups.
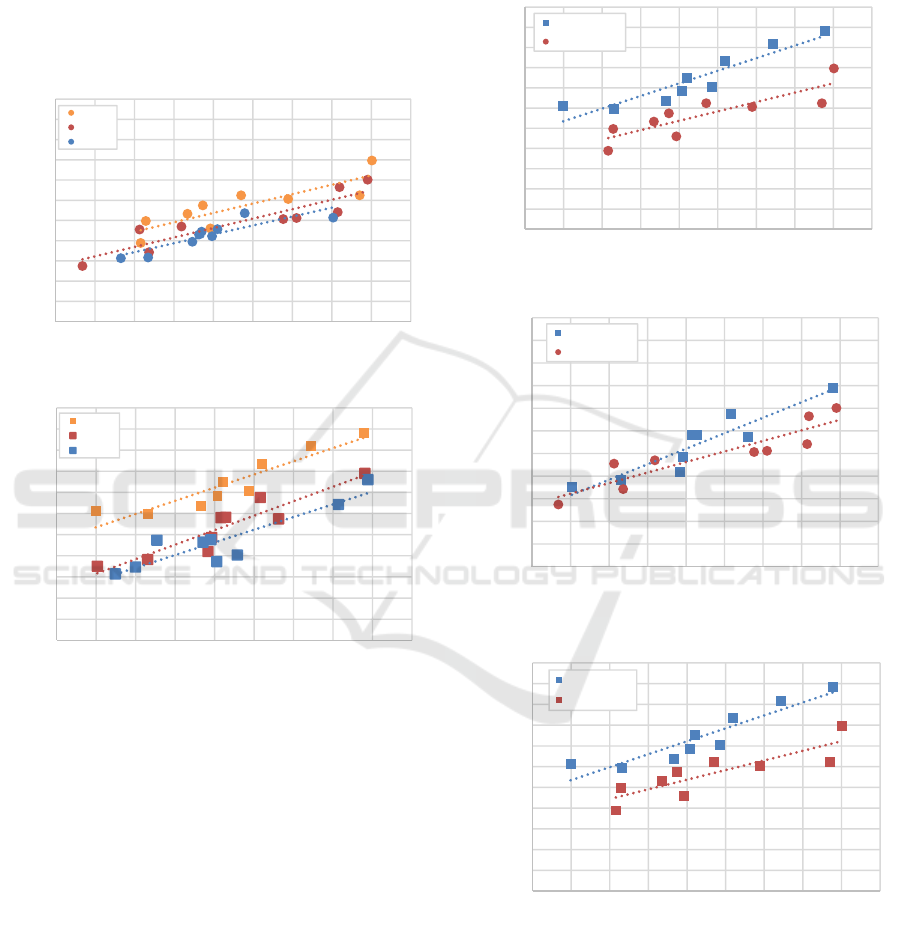
3.1 The Effect of Mooring Angle
Based on the data recorded from the physical model
test carried out with variations in the mooring angle,
a various maximum mooring tension value was
obtained indicating that there is the influence of the
mooring angle on the mooring tension of the floating
breakwater. Figure 10 shows the effect of the
mooring angle used in this test on the maximum
mooring angle on the floating breakwater type porous
saw and pontoon at a water level elevation of 45 cm.
It can be seen in Figure 10, the greatest maximum
mooring tension occurs at the 30⁰ mooring angle on
both the floating breakwater type; porous saw, and
pontoon. On a porous saw type, compared to an angle
of 30⁰, an angle of 45⁰ and 60
o
have a smaller
maximum mooring tension value of 15% and 20%
respectively. While the pontoon type, the angle of 45⁰
and 60⁰ have the smallest maximum mooring tension
value of 34% and 45% respectively to the angle of
30
o
. At the water level elevation of 41 cm and 43 cm,
the same phenomena happen where the greatest
maximum mooring tension occurs at an angle of 30⁰
and the smallest maximum mooring tension occurs at
an angle of 60⁰.
Some researchers have examined how the effect
of the mooring angle on mooring tension. Wei, et al.
(2011), examined the effect of the mooring angle on
the interaction between the floating breakwater and
the wave, and one that was tested was the effect on
the mooring force. From the test, it is known that
there is an increasing mooring tension when the
0
200
400
600
800
1000
1200
0 200 400 600 800 1000 1200 1400
Actual Load (gr)
Load Recorded (gr)
● = Load Cell 1
● = Load Cell 2
● = Load Cell 3
● = Load Cell 4
Experimental Study on the Effect of Mooring Angle on Mooring Tension of Porous Saw Type Floating Breakwater
97
mooring angle decreases from 90⁰ to 0⁰ especially
when the mooring angle is below 30⁰. They added,
even though the 60⁰ angle gives the lowest mooring
tension value, the motion of the structure is less
stable. The results show that the sway, heave, and roll
motions are high when the large angle is used,
especially when the angle reaches 60⁰. The result of
this study is not contradictory to the result obtained
in Wei, et al. (2011).
a) Porous saw
b) Pontoon
Figure 10: Mooring tension at water level 45 cm on floating
breakwater type porous saw and pontoon.
3.2 Floating Breakwater Type
Comparison
The testing of the floating breakwater mooring
tension is carried out on two types of floating
breakwater which are the porous saw type and the
pontoon type so that there is a mooring tension
difference experienced by the two types of floating
breakwater tested. The comparison graph of the
porous saw and pontoon type floating breakwater
shows that a larger tension occurs on a pontoon type
floating breakwater. Figure 11 shows a comparison
of the two types of a floating breakwater at 45 cm
water level elevation. It can be seen in figure 11 that
the pontoon type floating breakwater produces a
greater mooring tension than the porous saw type.
This proves that porosity addition can reduce the
mooring tension value. The mooring tension
reduction also varies from 10% up to 15%.
(a) 30o
(b) 45
o
(c) 60
o
Figure 11: Comparison between both floating breakwater
porous saw and pontoon types at various mooring angles.
There are some previous researchers also
supported the results obtained in this study. One of
them is Wilbur (1996), he carried out a study of
perforated floating breakwaters and how they
R² = 0.7275
R² = 0.8249
R² = 0.7646
0.0
0.5
1.0
1.5
2.0
2.5
3.0
3.5
4.0
4.5
5.0
5.5
0.001 0.002 0.003 0.004 0.005 0.006 0.007 0.008 0.009 0.010
Mooring Tension (N)
Hs/gT
2
α 30⁰
α 45⁰
α 60⁰
R² = 0.8572
R² = 0.8558
R² = 0.8081
0.0
0.5
1.0
1.5
2.0
2.5
3.0
3.5
4.0
4.5
5.0
5.5
0.001 0.002 0.003 0.004 0.005 0.006 0.007 0.008 0.009 0.010
Mooring Tension (N)
Hs/gT
2
α 30⁰
α 45⁰
α 60⁰
R² = 0.8572
R² = 0.7275
0.0
0.5
1.0
1.5
2.0
2.5
3.0
3.5
4.0
4.5
5.0
5.5
0.001 0.002 0.003 0.004 0.005 0.006 0.007 0.008 0.009 0.010
Mooring Tension (N)
Hs/gT
2
Pontoon
Porous Saw
R² = 0.8558
R² = 0.8249
0.0
0.5
1.0
1.5
2.0
2.5
3.0
3.5
4.0
4.5
5.0
5.5
0.001 0.002 0.003 0.004 0.005 0.006 0.007 0.008 0.009 0.010
Mooring Tension (N)
Hs/gT
2
Pontoon
Porous Saw
R² = 0.8572
R² = 0.7275
0.0
0.5
1.0
1.5
2.0
2.5
3.0
3.5
4.0
4.5
5.0
5.5
0.001 0.002 0.003 0.004 0.005 0.006 0.007 0.008 0.009 0.010
Mooring tension (N)
Hs/gT
2
Pontoon
Porous Saw
ISOCEEN 2019 - The 7th International Seminar on Ocean and Coastal Engineering, Environmental and Natural Disaster Management
98

affected various aspects of the floating breakwater.
One of the aspects that were studied is the mooring
tension and transmission coefficient. In terms of the
transmission coefficients, it is found that solid
floating breakwater has a smaller transmission
coefficient value indicates that solid floating
breakwater can reduce waves better. But in terms of
the mooring tension produced in the mooring lines,
both the mooring line on the seaward side and
shoreward side produces a smaller mooring tension
value on the perforated floating breakwater.
Wilbur (1996) says that when a wave hits the
structure of a floating breakwater, some of the waves
are reflected, some pass away, and some others enter
through the pore that is in the structure and that, of
course, reduces the impact received by the mooring
system. Marks continued, if the floating breakwater
used is a solid structure, the greater reflection will
occur on the side of the floating breakwater wall with
a high resultant force. In the case of a perforated
floating breakwater, the wave force will be
transmitted to the mooring rope and also some of the
wave force will direct the floating breakwater to
move (oscillating) so that it forms a new wave behind
the structure. This is certainly one of the
disadvantages of using a solid floating breakwater
rather than the perforated floating breakwater.
Research conducted by Wilbur was also proven in
this study where the tension produced by a porous
saw type floating breakwater is lower than that of a
pontoon floating breakwater.
4 CONCLUSIONS
Based on this study, several conclusions can be
drawn from the physical model tests of mooring
tension on the porous saw type floating breakwater
including:
1. Based on variations in the mooring angle and
water level elevation, the following conclusions
are obtained:
• The greater the mooring angle, the smaller the
mooring tension experienced by the mooring
line.
• Based on the variations of the mooring angle,
30⁰, 45⁰, and 60⁰, it can be seen that the greatest
mooring tension occurs at an angle of 30⁰ with
mooring tension differences at 45⁰ and 60
o
of
15% and 20% smaller than an angle of 30⁰
respectively.
2. Floating breakwater type porous saw type gives
a smaller mooring tension than the pontoon type. The
porous saw type can reduce mooring tension by 10%
up to 15% at an angle of 30⁰ - 60⁰.
ACKNOWLEDGEMENTS
This article is part of the Research Program contract
of the Direktorat Riset dan Pengabdian Masyarakat
Institut Teknologi Sepuluh Nopember (ITS)
Surabaya number: 866 / PKS / ITS / 2019 schema of
Penelitian Dasar Unggulan Perguruan Tinggi
(PDUPT). The author would like to thank all those
who helped in the preparation of this paper. The
Department of Ocean Engineering, as well as the
Energy and Marine Environment Laboratory, has
provided facilities and equipment for this research.
REFERENCES
Fousert, M. W., 2006. Floating Breakwater: a Theoretical
Study of a Dynamic Wave Attenuating System. Master
Thesis. Section of Hydraulic Engineering. Faculty of
Civil Engineering and Geosciences. The Delft
University of Technology. Netherland
McCartney, Bruce L., 1985. Floating Breakwater Design.
Journal of Waterway, Port, Coastal and Ocean
Engineering, Vol. 111, No. 2
PIANC, 1994. Floating Breakwater, A Practical Guide For
Design and Construction. General Secretariat of
PIANC, Brussel
Ruol, P., L. Martinelli, and P. Pezutto, 2012. Experimental
and Numerical Investigation of the Effect of Mooring
Stiffness on the Behaviour of π-Type Floating
Breakwaters. Proceedings of The Twenty-second
International Offshore and Polar Engineering
Conference, Greece: 17-22 June
Tsinker and Gregory P., 1995. Marine Structures
Engineering: Specialized Application. An International
Thomson Publishing Company, New York
Wei, Peng, Lee Kwang Ho, and Mizutani Norimi, 2011.
Effect of Mooring Angle on the Interactions Between
Waves and Floating Breakwater. Coastal Structures
Proceedings of the 6th International Conference Vol.
2: 903-912.
Wilbur, Marks, 1996. A Perforated Mobile Breakwater for
Fixed and Floating Application. Proceedings of 10th
Conference on Coastal Engineering, Tokyo, Japan, No.
10.
Experimental Study on the Effect of Mooring Angle on Mooring Tension of Porous Saw Type Floating Breakwater
99
