
Size Optimization of Foil-shaped Center Bulb
on Catamaran Hull Form to Reduce Resistance
Eko Sasmito Hadi, Muhammad Iqbal and Gana Pranamya
Department of Naval Architecture, Universitas Diponegoro, Semarang, Indonesia
Keywords: Catamaran, Foil-shaped Center Bulb, Resistance.
Abstract: The interference of resistance between the two catamaran hulls is a very popular topic to discuss. Errors in
designing hull form and determining the distance between the hull will result in a large amount of interference
that causes the resistance of the catamaran increased. Some researchers try to reduce the resistance of
catamaran due to interference such as changing the shape of the demihull, giving a bulbous bow, and adding
a center bulb. The idea to use center bulb on catamarans is still relatively new and still requires a lot of studies.
Therefore, in this study the elliptical center bulb will be replaced with a foil-shaped center bulb. The purpose
of this study was to obtain the optimal length (𝑋1) and diameter (𝑋2) foil-shaped centrebulb on the NPL hull
catamaran scale model with Fr 0.7 using Response Surface Method (RSM). The optimal size of foil-shaped
center bulb is determined by the size that the most makes of ship wave resistance (Rw) to a minimum. The
results of the regression equation in Order 1 are 𝑅𝑤 0.168𝑋1 0.378𝑋2 14.862 and the results of
the regression equation in Order 2 are 𝑅𝑤 0.020239𝑋1 0.061318𝑋2 0.201557
𝑋1
0.261325
𝑋2
0.015
𝑋1𝑋2
13.34806. Optimal center bulb size is obtained at a length of 103.78 mm
and a diameter of 26.30 mm with a wave resistance value of 13.23 N. The center bulb size can reduce wave
resistance by 11.74% from the initial center bulb model and reduce 4.72% compared to not using a center
bulb.
1 INTRODUCTION
Catamarans are double hull ships, which have many
advantages over single-hull boats with the same
displacement. Among these advantages is the
catamaran has a broad deck so that designers are more
flexible in arranging the ship's accommodation space.
Besides, catamarans have excellent ship stability so
that catamarans are safer and more comfortable for
passengers (Seif & Amini, 2004; Zouridakis, 2005).
Because catamarans have two hulls, interference
between the two hulls is a prevalent topic to be
discussed on catamarans. Errors in designing the hull
shape and determining the distance between the hulls
will result in the amount of interference of the ship's
resistance, which makes the resistance of the
catamaran ship to increase by almost four times even
though the displacement has increased two times
compared to each demihull. (Samuel, et al., 2015).
Some researchers researched to reduce the
resistance of catamarans due to interference. Iqbal
and Samuel have researched to reduce the resistance
of catamaran fishing vessels by modifying the shape
of the ship's demihull hull using the Luckenby
method. The method changes the CSA form of the
boat to create a new hull. This method succeeded in
reducing the total resistance by 6.5% (Iqbal &
Samuel, 2017). The method has been successfully
used by Iqbal and Rindo to improve the quality of the
seakeeping of catamarans (Iqbal & Rindo, 2015).
Samuel et al. have also used the bulbous bow on
catamaran fishing vessels to reduce ship resistance.
Ship resistance can either be reduced or increase
depending on the type of bulbous bow used. In that
case, the kind used to overcome resistance is the nabla
type, where the resistance can reduce by 10%
(Samuel, et al., 2018).
Other research conducted to reduce the resistance
of catamaran vessels has been carried out using the
concept of the center bulb, which is bulbous that is
between the hulls of the catamaran (Saha, et al., 2005;
Danisman, 2014). The center bulb is bulbous between
the two hulls of the catamaran (in the middle). The
purpose of this center bulb installation is to provide
wave interference between two catamaran hulls.
When the waves were interfered, it expects that the
Hadi, E., Iqbal, M. and Pranamya, G.
Size Optimization of Foil-shaped Center Bulb on Catamaran Hull Form to Reduce Resistance.
DOI: 10.5220/0010055600670075
In Proceedings of the 7th International Seminar on Ocean and Coastal Engineering, Environmental and Natural Disaster Management (ISOCEEN 2019), pages 67-75
ISBN: 978-989-758-516-6
Copyright
c
2021 by SCITEPRESS – Science and Technology Publications, Lda. All rights reserved
67
waves will break and reduce the wave resistance. In
addition to reducing ship resistance, the utilization of
center bulb can also improve the quality of
seakeeping of catamaran vessels (Bruzzone, et al.,
2008; Zotti, 2007; Aprjal, et al., 2018).
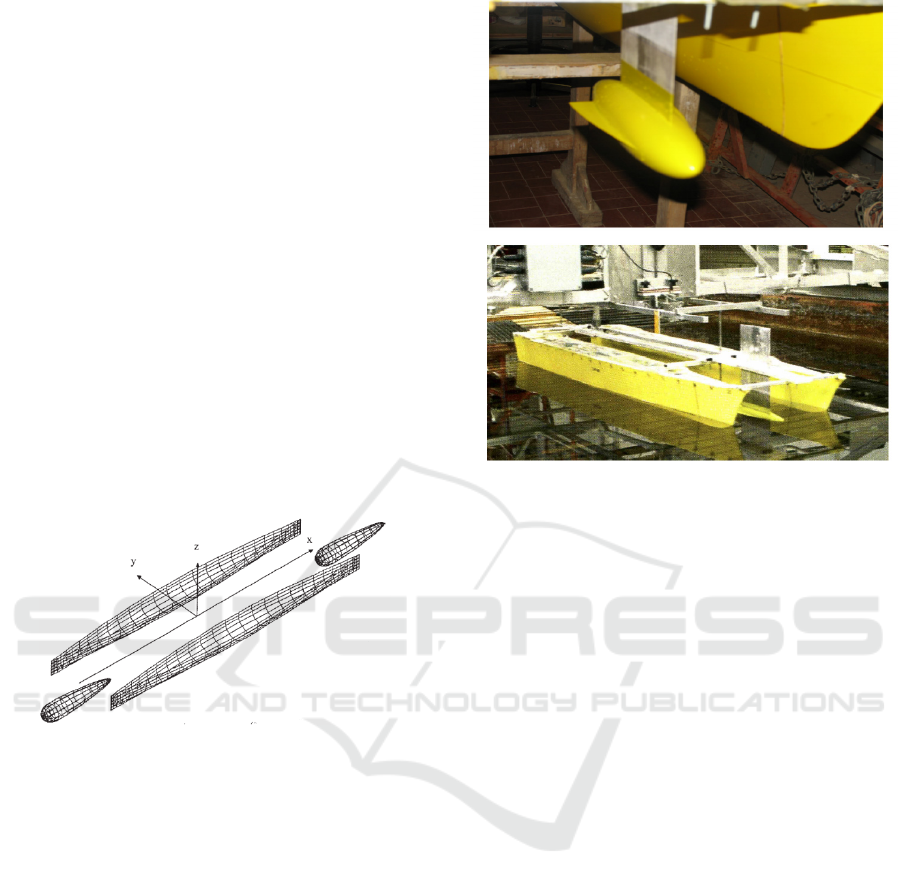
In Saha's research, the center bulb that used is
large and placed in the front and rear positions, as in
Figure 1. The results of the study provide
recommendations that the wave resistance on the
catamaran ship with the center bulb depends on size
and position of center bulb against catamaran hulls
and the interaction of the catamaran wave resistance
(Saha, et al., 2005).
Zotti gives fins at center bulb to examine its effect
on resistance and the motion of the ship (see Figure
2). The results of the study are center bulb with fin
reducing ship resistance at Fr> 0.3 and increasing
resistance at Fr <0.3. RAO curve peaks from heaving
and pithing center bulb with fins are lower than
catamarans without center bulb. This method
indicates center bulb with fins has a positive impact
on seakeeping ships (Zotti, 2007).
Figure 1: Concept of Center bulb on a catamaran (Saha, et
al., 2005).
Danisman optimizes the position and geometry of
the elliptical center bulb using Artificial Neural
Networks (ANN). The research has succeeded in
reducing wave resistance by 15% based on the results
of numerical calculations and 13% based on the
results of experimental tests in towing tanks
(Danisman, 2014). The elliptical bulb center from
Danisman has also been applied to catamaran fishing
vessels by Samuel and can reduce resistance by
25.76% (Samuel, et al., 2018).
The idea to use center bulb on catamarans is still
relatively new and still requires a lot of studies.
Therefore, in this study, the elliptical center bulb form
was replaced with a foil form. This form is expected
to reduce ship resistance further because the tapered
back shape of the foil will make the flow pattern
streamlined and will not cause vortex shading or
repetition as when flow passes through a circular or
ellipsoid shape.
Figure 2: Concept of Center bulb on a catamaran (Zotti,
2007).
To producing maximum performance from the
center bulb, the optimization method is used to get the
optimal center bulb length and diameter. In this study,
the optimization method used is Response Surface
Methods (RSM). RSM is one of the most practical
and economic optimization techniques that is widely
used to evaluate variables from experiments that
produce several responses (Bezerra, et al., 2008).
The advantage of this method is that Design of
Experiments (DoE) based on RSM does not require a
lot of trials/testing and does not require a lot of time
compared to actual experimental studies (Ma, et al.,
2015).
Some researchers have used this method to
optimize several research variables. In the field of
structure, Baroutaji optimizes the thickness, diameter,
and width of the hollow cylindrical tube to produce
the maximum capacity of Specific Energy-Absorbing
(SEA) and minimize the Collapse Load (F)
(Baroutaji, et al., 2015).
In the field of mechanical engineering, Awad et
al., Used the RSM method to maximize brake power
and thermal brake efficiency and minimize Brake
Specific Fuel Consumption (BSFC) and emissions
from NOx, HC, and CO by optimizing three
variables, which are fuel, engine speed, and throttle
valve (Awad, et al., 2017).
In the field of naval architecture, RSM is very
rarely used. Therefore, the research tries to apply the
method in the field of naval architecture to minimize
ISOCEEN 2019 - The 7th International Seminar on Ocean and Coastal Engineering, Environmental and Natural Disaster Management
68
the resistance of catamarans by optimizing variable
length and diameter of the center bulb.
The purpose of this study was to obtain the
optimal length (𝑋1) and diameter (𝑋2) foil-shaped
centrebulb on the NPL hull catamaran scale model
with Fr 0.7 using Response Surface Methods (RSM).
The optimal size of foil-shaped center bulb is
determined by the size that the most makes of ship
wave resistance (Rw) to a minimum.
2 METHOD
In this study, the catamaran hull model used is the
standard 4a hull model of NPL (Bailey, 1976). The
principal dimension and experimental test results in
towing tanks both as demihull and as catamarans are
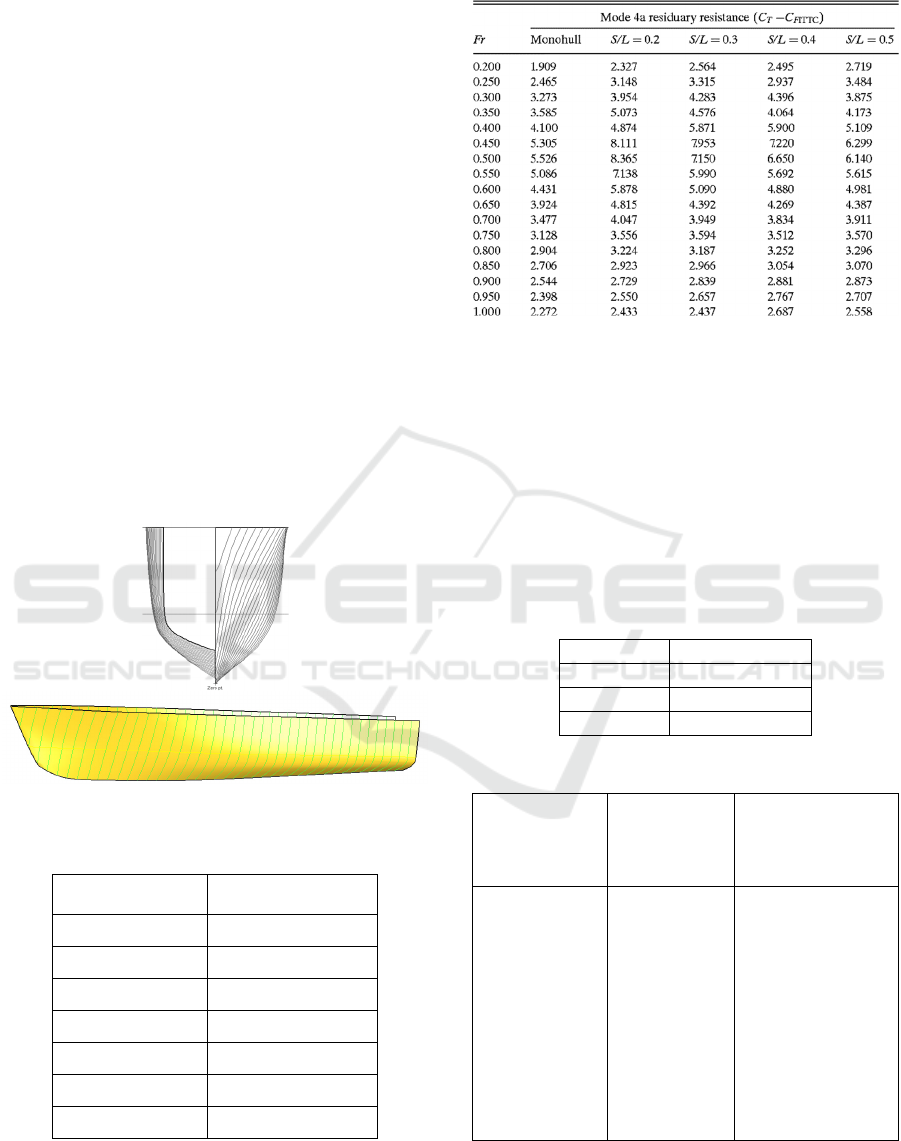
found in (Molland, et al., 2017). The shape of the
body plan and 3D are shown in Figure 3. The
principal dimension of the NPL ship model, when
tested in towing tanks, are in Table 1. The results of
the residual resistance in the experimental tests are
shown in Table. 2.
Figure 3. Body plan and 3D model of NPL hull.
Table 1: Principal Dimension of the NPL Hull Model.
Dimension Scale Model
Lwl 1.60 m
B demihull 0.15 m
T 0.10 m
Cb 0.395
WSA 0.346 m
2
Displacement 0.0102 ton
S/L 0.3
Table 2: Residual Resistance of NPL Hull.
In this study, the optimal size of elliptical center
bulb geometry in Danisman was adopted to
determining the initial size of the center bulb by
comparing its geometry to the ship's geometry
(Danisman, 2014). Table 3 shows the principal
dimensions of the Danisman ship model. The size and
calculation of the center bulb dimensions are listed in
Table 4. The comparison is used to determine the
geometry of the center of the foil-shaped bulb as
shown in Figure 4.
Table 3: Principal Dimension of Danisman’s Catmaran
(Danisman, 2014).
Lwl 2,525
m
B0,26
m
T0,14
m
Cb 0,41
Table 4: Comparison of Center bulb Dimension.
Elipsoidal
Center bulb
(Danisman,
2014)
Ratio Foil-Shaped
Center bulb
Length (a) =
0,141 m
Width (b) =
0,062 m
Height (c) =
0,034 m
0,141/2,525 =
0,0558
0,062/0,26 =
0,2384
0,034/0,14 =
0,2428
Length (a) =
0,089 m~ 0,090 m
Width (b) =
0,037 m;
Height (c) =
0,024 m
Diameter (d) =
(b+c)/2 =
0,0305 ~ 0,040
m
Size Optimization of Foil-shaped Center Bulb on Catamaran Hull Form to Reduce Resistance
69
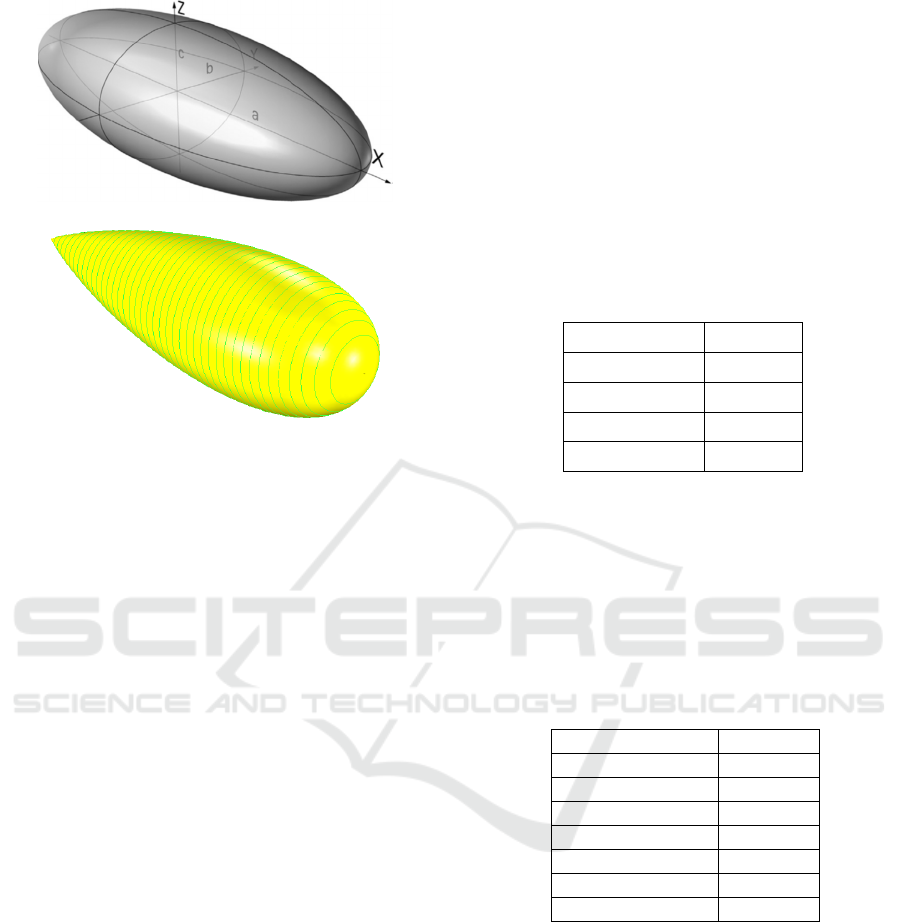
(a)
(b)
Figure 4: Elipsoidal Center bulb Geometry (Danisman,
2014) (a) Foil-Shaped Center bulb Geometry in this
research (b).
The position of Center bulb is at 0.5 Lwl and 0.5
T. Ship resistance is simulated at Fr 0.7 (2.77 m/s).
Catamarans that use the center bulb at Fr 0.7 have
lower resistance than that do not use the center bulb
(Danisman, 2014) and (Samuel, et al., 2018).
Ship resistance calculation uses CFD Software
called Tdyn. This software can be downloaded and
used free of charge but with a limited amount of
meshing. To getting the full version, the password
was required. It can be downloaded by registering
first. The password is valid for a month since
registration. Like other CFD software, the Tdyn
analysis process is carried out in 3 stages: pre-
processor, solver, and post-processor.
Before simulating ship resistance in CFD, the
design of the experiment is determined by using the
Central Composite Design (CCD). The first stage is
Order I by making the minimum and maximum limits
of length (𝑋1) and diameter (𝑋2) center bulb
variations. Furthermore, the design of the second
phase of the experiment is Steepest Descent. This
stage is to find the minimum response value based on
the coefficients 𝑋1 and 𝑋2 of the linear equation
generated from Order I.
Next, the results of 𝑋1 and 𝑋2 from Steepest
Descent become the initial model in Order II. Like
Phase I, the minimum and maximum limits of
variation in length (𝑋1) and diameter (𝑋2) of the
center bulb of Steepest Descent are determined again
for later to be tested in CFD simulation.
3 RESULTS AND DISCUSSION
3.1 CFD Validation
The validation step is conducted to ensure that the
results of the CFD calculation have a small difference
to the experimental results. Validated results of the
CFD setup, such as mesh sizing (as shown in Table
5), number of steps, initial steps, and time increment,
are used to the condition of CFD simulation for other
models. These variables affect simulation results.
Table 5: Mesh Sizing.
Ship Surface 0.005
Free surface 0.05
Other Surface 0.1
Max Element 0.5
Transitional 0.5
Mesh size was obtained from several experiments
with consideration of the 3 Dimension shape of the
ship. The next stage is determining the CFD set up
like number of steps, time increments, and initial
steps. The final results are presented in Table 6 with
the total resistance results, RT of 19.11 N consisting
of wave resistance, RW of 13,855 N and viscous
resistance, RV of 6.0564 N.
Table 6: Tdyn Setup.
F
r
0.7
N
o. Of Steps 900
Time Incremen
t
0.08
Initial Steps 81
V (m/s) 2.77
RT (CFD) 19.11 N
RT (Molland) 18.89 N
Erro
r
0.12 %
3.2 Response Surface Methods
3.2.1 Order 1
There are various Designs of Experiment (DoE)
(Bezerra, et al., 2008). In this study, the DoE is used
using the Center of Composite Design (CCD) with
two factors/variables. The regression equation that
produced in Order 1 is linear. The variables used are
length of center bulb, L (X1) and diameter of center
bulb, D (X2). The difference given is ± 5%. The CFD
simulation conditions in Table 6 are used for the
ISOCEEN 2019 - The 7th International Seminar on Ocean and Coastal Engineering, Environmental and Natural Disaster Management
70
calculation of wave resistance (RW) following the
DoE contained in Table 7.
Table 7: Design of Experiment based on Central Composite
Design and The Results of Wave Resistance, RW.
Model
Code Parameter
Rw
(N)
X1 X2
L
(mm)
D
(mm)
1 0 0 90 40 14.99
2 -1 -1 85.5 38 14.529
3 -1 1 85.5 42 15.466
4 1 -1 94.5 38 14.375
5 1 1 94.5 42 14.95
Through the regression method, a linear equation
(found in Equation 1) is obtained from the
experiments conducted in Table 7. This equation has
the value R
2
= 0.908977, where the value can be
considered valid enough to be used.
𝑅𝑤 0.168𝑋1 0.378𝑋2 14.862
(1)
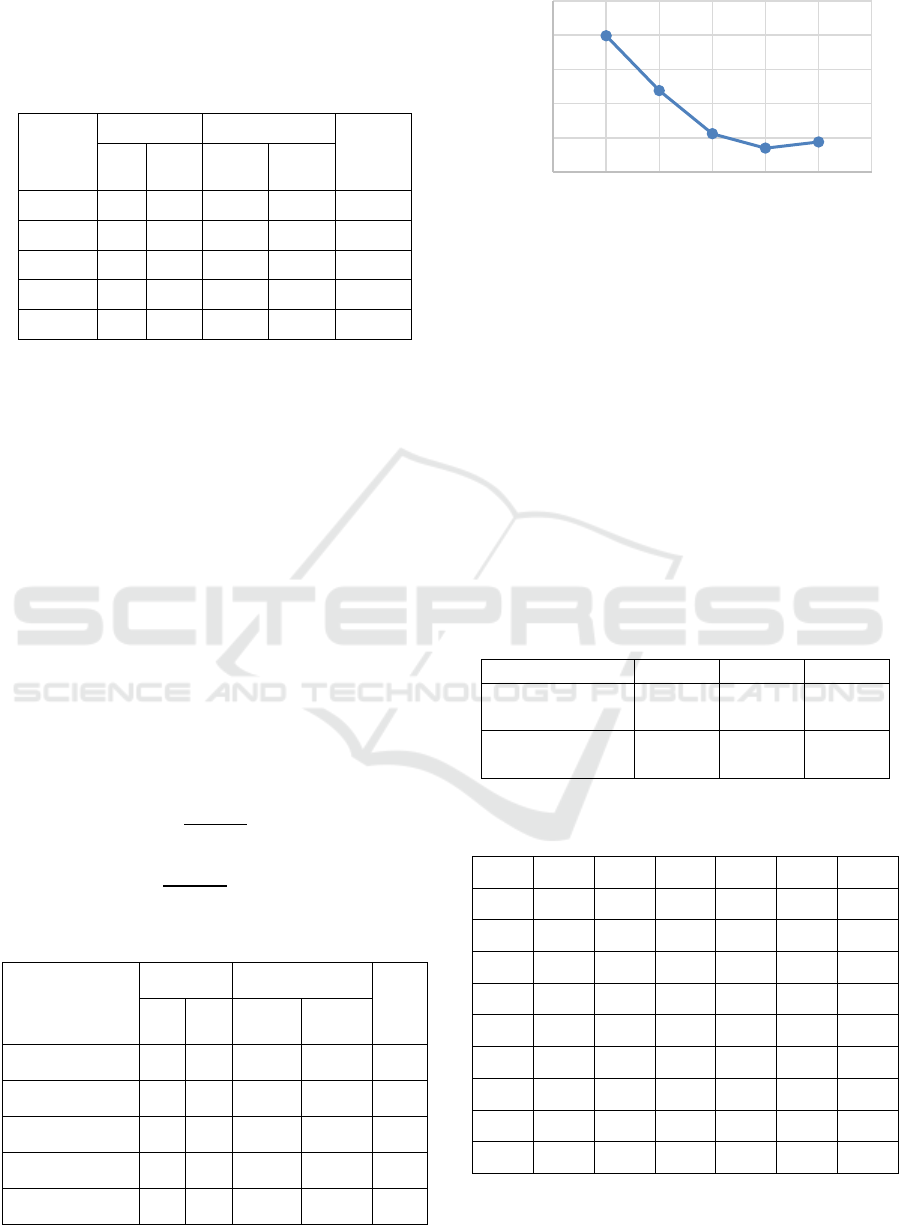
3.2.2 Steepest Descent
This process is carried out to determine the turning
point of the tendency of wave resistance (Rw), which
continues to fall and no longer matches the results of
Equation 1. Based on the coefficients of each variable
in the First Order model, the addition (∆) of each
coefficient for doing steepest descent was calculated
by using the coefficient X1 as the basis as shown in
Equations 2 and 3. Furthermore, the steepest descent
process is shown in Table 8 and Figure 5.
∆𝑋1
0.168
0
.1
68
1
(2)
∆𝑋2
0.378
0
.1
68
2.26
(3)
Table 8: Steepest Descent.
Code Parameter
Rw -
CFD
(N)
Step X1 X2 L (mm) D (mm)
1 (Mod.1) 0 0 90 40 14.99
2 (Mod.6) 1.00 -2.26 94.50 35.49 14.19
3 (Mod.7) 2.00 -4.51 99.00 30.97 13.56
4 (Mod.8) 3.00 -6.77 103.50 26.46 13.35
5 (Mod.9) 4.00 -9.03 108.00 21.95 13.44
Figure 5: Steepest Descent.
Based on Figure 5, the lowest point is found in Step
4 or in Model 8. The wave resistance then increases in
Model 9 so that the variables in Model 8 are used as
the central point for experiments in Order 2.
3.2.3 Order 2
Experimental design in Order 2 produces non-linear
equations for quadratic functions. For this reason, the
number of experiments in DoE was added as in Table
9. The central points (X1 = 0 and X2 = 0) used were
Model 8. The code used for the Second Order was set
again as shown in Table 9. With reference to Table 9,
DoE for Order 2 is shown in Table 10.
Table 9: Code for Orde 2.
-1 0 1
𝑋1,
Len
g
th (mm)
98.33 103.50 108.68
𝑋1,
Diameter (mm)
26.46 26.46 27.78
Table 10: Design of Experiment in Order 2 and Wave
Resistance, Rw.
Mod X1 X2 X1
2
X2
2
X1*X2 Rw (N)
8 0 0 0 0 0 13.35
10 -1 -1 1 1 1 13.92
11 -1 1 1 1 -1 13.95
12 1 -1 1 1 -1 13.55
13 1 1 1 1 1 13.64
14 -1.414 0 1.9994 0 0 13.62
15 1.414 0 1.9994 0 0 13.98
16 0 -1.414 0 1.9994 0 13.79
17 0 1.414 0 1.9994 0 14.05
The regression equation from the experiments
conducted in Table 10 is found in Equation 4. The
13
13,5
14
14,5
15
15,5
0123456
RW(N)
Step
Size Optimization of Foil-shaped Center Bulb on Catamaran Hull Form to Reduce Resistance
71
equation has the value R
2
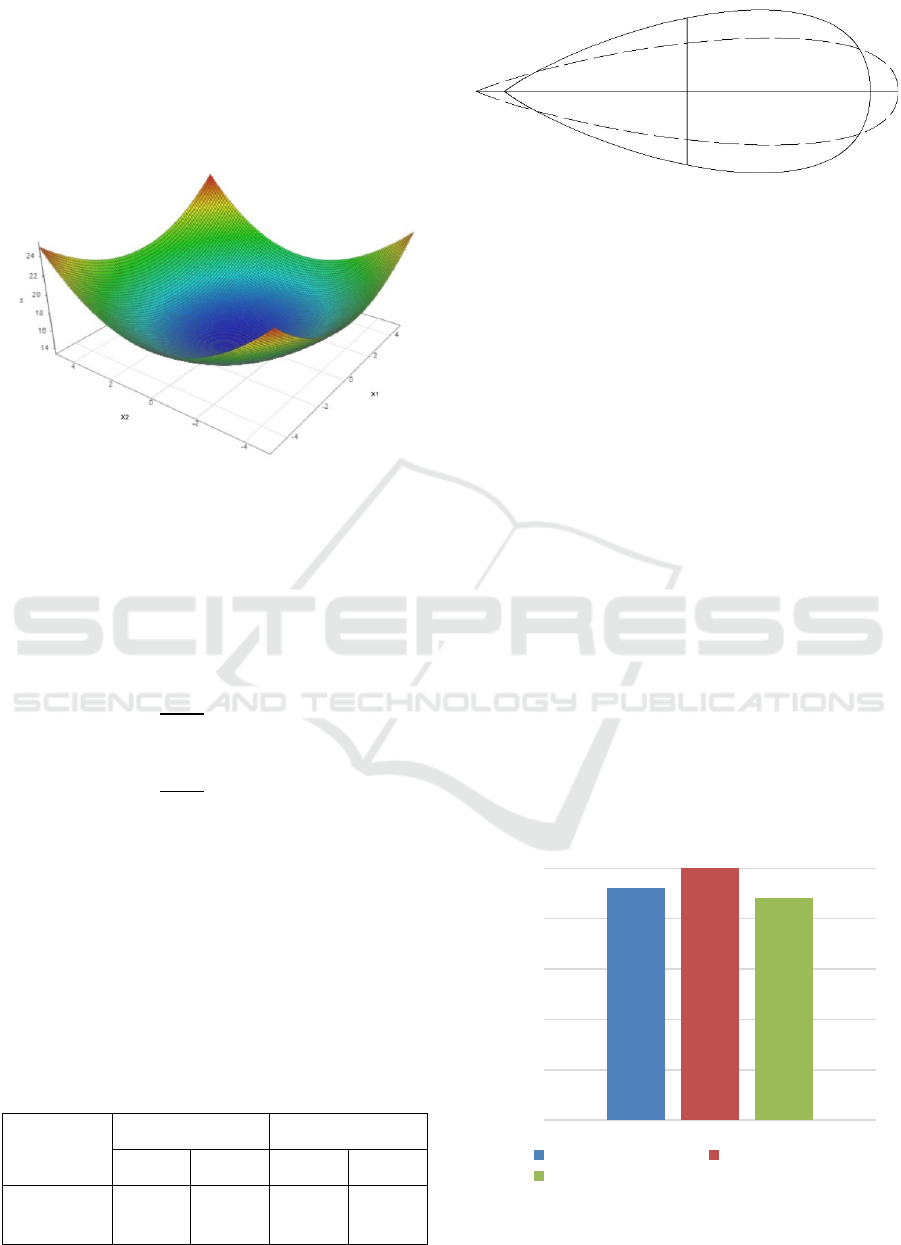
= 0.540206. The 3D Surface
of Eq. 4 is shown in Figure 6.
𝑅𝑤 0.020239𝑋1 0.061318𝑋2
0.201557
𝑋1
0.261325
𝑋2
0.015
𝑋1𝑋2
13.34806
(4)
Figure 6: 3D Surface of Second Order Equation for wave
resistance, RW.
3.2.4 Optimum Point
To find the minimum value of the Order 2 regression
equation (Equation 4), then the first derivative of the
equation must have a zero value according to
Equations 5 and 6.
𝑑𝑅𝑊
𝑑𝑋1
0
(5)
𝑑𝑅𝑊
𝑑𝑋2
0
(6)
According to Equations 5 and 6, the optimum
point is located at X1 = 0.0546 and X2 = -0.1189 are
obtained. Based on the codification in Table 9, the
optimum length and diameter are shown in Table 11.
The center bulb length, which was 90 mm increased
by 15.31% to 103.78 mm. While the center bulb
diameter, which was 40 mm reduced by 34.25% to
26.30 mm. Visualization of the comparison of initial
center bulb size with optimum center bulb size is
shown in Figure 7.
Table 11: Optimum Size of Foil-Shaped Center bulb.
Model
Code Parameter
X1 X2 L (mm) D (mm)
18
(Optimum) 0.0546 -0.1189 103.78 26.30
Figure 7: Model 1 (initial model) with solid lines and Model
18 (optimal model) with dashed lines.
3.3 Hydrodynamic Comparisons
The value of the wave resistance, RW from the
optimum parameter based on CFD is 13.23 N, while
based on Equation 4 is 13.34 N. The difference
between the two is quite small at -0.83%.
The comparison of wave resistance between the
optimum model (Model 18) and the initial model
(Model 1) has been carried out. The optimum model
reduces the wave resistance by 11.74% from 14.99 N
to 13.23 N compared to the initial model, as presented
in Figure 8. This optimization method successfully
minimizes the wave resistance from initial center bulb
models.
The next discussion is about the comparison of
wave resistance using center bulb (initial and optimal
models) to models that do not use center bulb. The
value of wave resistance that does not use center bulb
as stated in the validation section is 13.855 N.
As can be seen in Figure 8, the use of the initial
center bulb model adds a wave resistance of 8.19%.
This reason is that model has not been optimized.
Center bulb configuration is also based only on center
bulb geometry, not varying the position of center bulb
placement. Besides, the determination of the
Figure 8: Comparison of Catamaran Without, Initial and
Optimum Center bulb.
0
3
6
9
12
15
RW(N)
NoCenterbulb InitialCenterbulb
OptimalCenterbulb
ISOCEEN 2019 - The 7th International Seminar on Ocean and Coastal Engineering, Environmental and Natural Disaster Management
72
geometry of the initial model is obtained only by the
ratio. So for the initial center bulb model, it is still far
from the expectation to reduce wave resistance.
After the foil-shaped center bulb is optimized, the
wave resistance decreases by 4.72%. When compared
with the results of Danisman's research, this value is
not significant enough. The reason is due to the
optimization parameters still using two variables,
namely length and diameter, whereas in Danisman's
used 3 variables, namely height and width length of
center bulb. Besides, the configuration of center bulb
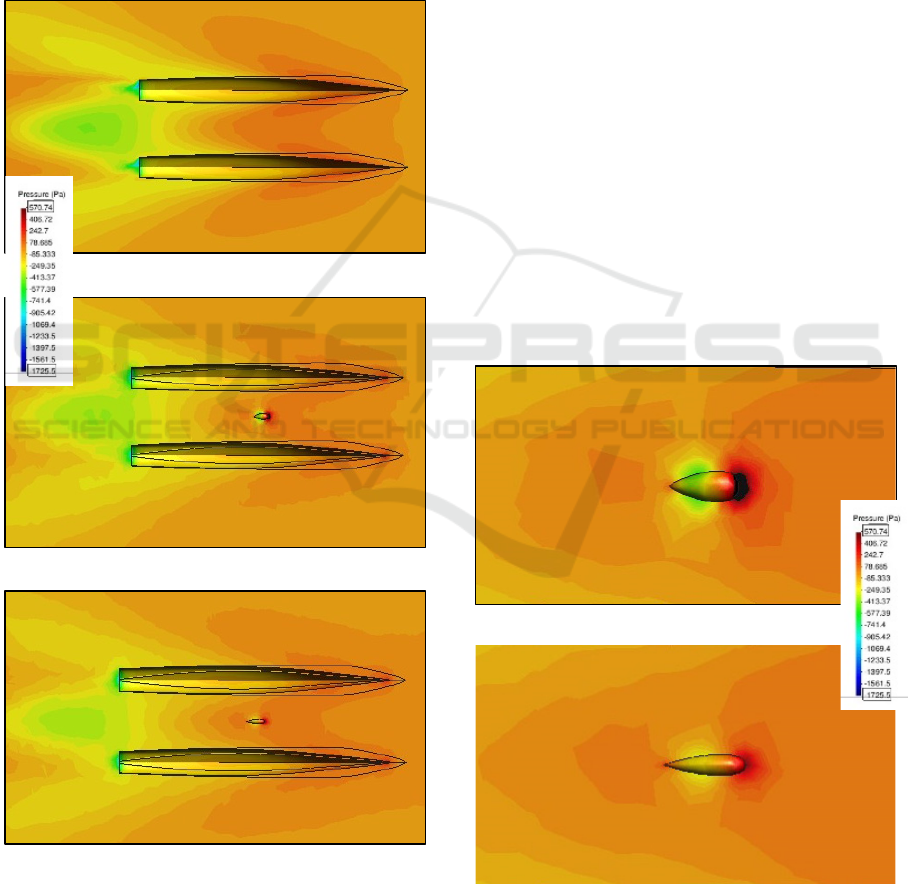
(a)
(b)
(c)
Figure 9: Comparison of Catamaran Pressure Contours that
do not use Center bulb (a), Initial Center bulb (b) and
Optimal Center bulb (c).
position was taken into account to produce a
significant reduction in wave resistance.
Figure 9 is an illustration of the pressure contour
between the two catamaran hulls seen based on the
intersection of the z-axis in the center of the center
bulb. It can be seen in Figure 9.a that overall, the
pressure between the two hull has a higher pressure
than that using center bulb (b and c). This
phenomenon indicates that center bulb reduces
pressure between the hull.
However, in Figure 9.b the pressure contour
increases significantly only in front of the center bulb.
The initial center bulb has wide shape making the
water flow hit the center bulb. The flow speed will
stop for a moment causing the pressure increases. In
Figure 9.c. the optimal center bulb shape is slender
than the initial model. When the flow hit the center
bulb, the pressure did not increase significantly. For
more details, see Figure 10.
The results of this study prove that the Response
Surface Method (RSM) can be used in field Naval
Architecture and successfully implemented as an
optimization tool to find the lowest wave resistance
based on the size of the center bulb. Overall, the
Response Surface Method (RSM) makes it easy to
find the optimal value of the shape size of the center
bulb.
(a)
(b)
Figure 10: Comparison of Catamaran Pressure Contours
Around Foil-Shaped Center bulb. (a) Initial model (b)
Optimum model.
Size Optimization of Foil-shaped Center Bulb on Catamaran Hull Form to Reduce Resistance
73

4 CONCLUSIONS
The optimal center bulb length is 103.78 mm or has
15.31% increase from the initial length of 90 mm. The
optimal diameter size is obtained at 26.30 mm or
reduced by 34.25% from the initial diameter of 40
mm. The optimal model reduces the wave resistance
by 11.74% from the initial center bulb model and
reduces by 4.72% compared to not using a center
bulb. Overall, the Response Surface Method is
another approach to determine the optimal size of
foil-shaped center bulb in order to reduce wave
resistance.
ACKNOWLEDGEMENTS
The authors would like to express their gratitude to
Faculty of Engineering, Diponegoro University for
the financial support of this research with contract
number: 167/UN7.5.3/HK/2019.
REFERENCES
Aprjal, R. P., Samuel, S. & Iqbal, M., 2018. Minimisasi
Hambatan Dan Gerak Vertikal Kapal Multihull
Catamaran Dengan Center bulbs. Teknik, 39(1).
Awad, O. I. et al., 2017. Response surface methodology
(RSM) based multi-objective optimization of fusel oil -
gasoline blends at different water content in SI engine.
Energy Conversion and Management, Volume 150, pp.
222-241.
Bailey, D., 1976. The NPL high speed round bilge
displacement hull series: resistance, propulsion,
manoeuvering and seakeeping data. s.l.:Royal
Institution of Naval Architects.
Baroutaji, A., Gilchrist , M. D., Smyth , D. & Olabi, A.,
2015. Crush analysis and multi-objective optimization
design for circular tube under quasi-static lateral
loading. Thin-Walled Structures, Volume 86, pp. 121-
131.
Bezerra, M. A. et al., 2008. Response surface methodology
(RSM) as a tool for optimization in analytical
chemistry. Talanta, Volume 76, pp. 965-977.
Bruzzone, D., Grasso, A. & Zotti, I., 2008. Nonlinear
Seakeeping Analysis of Catamarans with Central Bulb.
Naples, Proceedings of the 6th International
Conference on High-Performance Marine Vehicles.
Danisman, D. B., 2014. Reduction of Demi-Hull Wave
Interference Reistance in Fast Displacement
Catamarans Utilizing an Optimized Center bulb
Concept. Ocean Engineering, Volume 91, pp. 227-234.
Hadi, E. S., Manik, P. & Iqbal, M., 2018. Influence of hull
entrance angle "perintis 750 DWT", toward ship
resistance : the case study for design development
“Perintis 750 DWT. MATEC Web of Conferences,
Volume 159.
Harvald, S. A., 1983. Resistance and Propulsion of Ships.
New York : Wiley.
Insel, M. & Molland, A. F., 1992. An Investigation into the
Resistance Components of High Displacement
Catamarans. Transaction Royal Institutions of Naval
Architevture, Volume 134.
Iqbal, M. & Rindo, G., 2015. Optimasi Bentuk Demihull
Kapal Katamaran Untuk Meningkatkan Kualitas
Seakeeping. KAPAL, 12(1), pp. 19-24.
Iqbal, M. & Samuel, 2017. Traditional Catamaran Hull
Form Configurations That Reduce Total Resistance.
International Journal of Technology, 8(1), pp. 989-997.
Iqbal, M. & Utama, I., 2014. An Investigation into the Effect
of Water Depth on the Resistance Components of
Trimaran Configuration. Surabaya, Proceedings of the
9 th International Conference on Marine Technology.
Jamaluddin, A., Utama, I. K. A. P., Widodo, B. & Molland,
A. F., 2012. Experimental and Numerical Study of the
Resistance Component Interactions of Catamarans.
Proceedings of the Institution of Mechanical Engineers,
Part M: Journal of Engineering for the Maritime
Environment , 227(1), pp. 51-60.
Ma, L. et al., 2015. Optimization of acidified oil
esterification catalyzed by sulfonated cation exchange
resin using response surface methodology.. Energy
Convers Manage, Volume 98, p. 46–53.
Molland, A. F., 2008. A Guide to Ship Design, Construction
and Operation, The Maritime Engineering Reference
Book. s.l.:Butterworth- Heinemann, Elsevier.
Molland, A. F., Turnock, S. R. & Hudson, D. A., 2017. Ship
resistance and propulsion. s.l.:Cambridge university
press.
Saha, G. K., Suzuki, K. & Kai, H., 2005. Hydrodynamic
Optimization of a Catamaran Hull With Large Bow and
Stern Bulbs Installed on the Center Plane of the
Catamaran. Journal of Marine Science and Technology,
Volume 10, pp. 32-40.
Samuel, Iqbal, M. & Utama, I. K. A. P., 2015. An
Investigation Into The Resistance Components Of
Converting A Traditional Monohull Fishing Vessel Into
Catamaran Form. International Journal of Technology,
6(3), pp. 432-441.
Samuel, S. et al., 2018. Bulbous bow applications on a
catamaran fishing vessel for improving performance.
MATEC Web of Conferences, Volume 159.
Samuel, S. et al., 2018. Modification of traditional
catamaran to reduce total resistance: configuration of
Center bulb. Lisbon, International Maritime
Association of the Mediteranean (IMAM) Conference.
Seif, M. S. & Amini, E., 2004. Performance Comparison
Between Planing Monohull and Catamaran at High
Froude Numbers. Iranian Journal of Science &
Technology, 28(B4).
Zotti, I., 2007. Medium Speed Catamaran with Large
Centralbulbs: Experimental Investigation on
Resistance and Vertical Motions. Naples, Proceedings
of ICMRT'07.
ISOCEEN 2019 - The 7th International Seminar on Ocean and Coastal Engineering, Environmental and Natural Disaster Management
74

Zouridakis, F., 2005. A Preliminary Design Tool for
Resistance and Powering Prediction of Catamaran
Vessels, s.l.: Master Thesis Massachusetts Institute of
Technology. Dept. of Ocean Engineering.
Size Optimization of Foil-shaped Center Bulb on Catamaran Hull Form to Reduce Resistance
75
