
Modeling of Total Suspended Solid based on Remote Sensing
Reclamation Data of Teluk Lamong Port
Abiyani C. Huda
2
, Widi A. Pratikto
1
, Suntoyo
1
, Anggie V. R. Dewi
1
and Destyariani L. Putri
2
1
Department of Marine Technology, Institut Teknologi Sepuluh Nopember, Surabaya, Indonesia
2
Department of Marine Technology, Institut Teknologi Kalimantan, Kalimantan, Indonesia
Keywords: Total Suspended Solid, Modeling, Remote Sensing.
Abstract: In relation to socio-economic development many construction projects have been carried out in Indonesia to
meet the requirements of urban, agricultural and industrial use. These projects include urban construction, for
example, metro construction, groundwater pumping, and reclamation in coastal areas. Activities that have a
significant influence on the environment are port operational activities. Teluk Lamong Harbor is the reclaimed
land product. Based on this, a physical impact study of the Teluk Lamong Bay Multipurpose Terminal
Development Port is needed to find out how much influence the impact of the reclamation has on marine
environmental resources. Therefore a flow pattern modeling is done, Total Suspended Solid (TSS) modeling
is based on remote sensing data to see the impact after the development of the Teluk Lamong Multipurpose
Terminal Port. The objectives to be achieved in this study are: Knowing the modeling of current patterns at
the Port of Multipurpose Terminal in Teluk Lamong 2020, Knowing the modeling of TSS concentrations at
the Port of Multipurpose Port of Lamong Bay in 2020. Stages Method: 1. modeling the flow patterns using
Mike 21 software before and after reclamation, 2. TSS concentration modeling using Mike 21 software based
on remote sensing data using Google Earth Engine (GEE). Model of the current pattern at low tide the
maximum water level at low tide is -1.0875 meters and -1.055 meters, the speed of the current under these
conditions ranges between 0.01 m / s for both points. For the current tide pattern model with the maximum
water level height at tide conditions are 0.7744 meters and 0.7640 meters, the current speed under these
conditions ranges from 0.008 m / s for the yellow dot and 0.008-0.016 m / s for both blacks. (D50) sediment
concentration of 0.0738 mm around the Port of Teluk Lamong with an average TSS value of 4.998 per area.
1 INTRODUCTION
Indonesia has a coastal region that stretches from
Sabang to Marauke which is rich and a variety of
natural resources that have been utilized by the
community as one source of economic income. In
addition to providing a variety of resources,
Indonesia's coastal area has various other functions,
such as transportation in the form of a port, industrial
estate, agribusiness and agro-industry, recreation and
tourism, residential areas, and waste disposal sites.
One of the development ideas that is being discussed
by many Indonesians is the concept of reclamation.
Reclamation can be defined as an effort to improve,
utilize, restore capacity, and improve the quality of
land through the empowerment of various
technologies and community empowerment focused
on land that is naturally of low quality or as a result
of human influence that makes the land less
productive. With changes in environmental
conditions can make the coastal region undergo
complex changes. The development of Teluk Lamong
Multipurpose Port will have an impact on the
surrounding environment due to changes in
environmental conditions that adjust to
environmental changes due to coastal reclamation.
The construction of the Lamong Bay Multipurpose
Port regarding reclamation has been explained and
legalized as contained in Law Number 27 of 2007
article 34 junto Law 1 of 2014, concerning
Management of Coastal Areas and Small Islands,
explains that reclamation has the meaning of
activities carried out by people in the context of
increasing the benefits of land resources in terms of
environmental and socio-economic aspects by means
of confinement and drying of land. Coastal changes
that occur due to abrasion and accretion, the main
causes of abrasion and accretion are the action of
Huda, A., Pratikto, W., Suntoyo, ., Dewi, A. and Putri, D.
Modeling of Total Suspended Solid based on Remote Sensing Reclamation Data of Teluk Lamong Port.
DOI: 10.5220/0010047100370046
In Proceedings of the 7th International Seminar on Ocean and Coastal Engineering, Environmental and Natural Disaster Management (ISOCEEN 2019), pages 37-46
ISBN: 978-989-758-516-6
Copyright
c
2021 by SCITEPRESS – Science and Technology Publications, Lda. All rights reser ved
37

waves, wind and tides. The most influencing process
is waves. When moving towards the beach, the waves
undergo transformation which then generates
currents near the coast. Currents moving along the
coast move sediments, causing shoreline changes.
The change in coastline is related to sediment
transport that occurred at the port of Teluk Lamong.
The rate of sedimentation increases, so siltation at the
Port of Teluk Lamong will have an even faster impact
on other problems. Therefore, knowledge about
aquatic hydrodynamics is very important to
understand in order to predict the distribution of
sediment after reclamation. The results of the model
that have been validated and have shown correlations
or similarities with actual conditions in the field can
be used to predict the dynamics of various processes
that occur in the waters.
2 THEORETICAL
The ecological coastal area is a transitional area
between terrestrial and marine ecosystems, which is
towards the coastal area including land areas, both dry
and submerged in water affected by marine processes,
such as tides, sea winds, and sea water intrusion,
while towards the sea area coastal areas include ocean
waters that are influenced by natural processes such
as sedimentation and freshwater flow, as well as those
caused by human activities on land (Dahuri et al,
1996). According to Law No.27 / 2007 article 1
paragraph 2, coastal areas are transitional areas
between terrestrial and marine ecosystems which are
influenced by regulations on land and sea. Coastal
waters are seas bordering the plains covering waters
as far as 12 nautical miles measured from the
coastline, waters connecting the coast and islands,
estuaries, bays, shallow waters, swamps, brackish,
and lagoons (Law No.27 / 2007 article 1 ). In coastal
areas there are interrelated ecosystems. Coastal
ecosystem is a unit that interacts between organisms
and the environment and together carry out their
respective functions in habitat (Odum, 1971). Coastal
ecosystems are a set of biological (biotic) and non-
biological (abiotic) components that are absolutely
necessary for life and improve the quality of life
(Bengen, 2004). Furthermore, biological and non-
biological components are functionally related to
each other and interact with each other to form a
system. If there is a change in one of the existing
systems, it will affect both the functional structure
unity and balance (Bengen, 2002). One form of
linkages between ecosystems in coastal areas is the
movement of river water, runoff, runoff with various
materials contained (nutrients, sedimentation, and
pollutants) which will all lead to to coastal waters. In
addition, this pattern of movement of water mass will
also play a role in the movement of aquatic biota
(plankton, fish, and shrimp) and pollutants from one
location to another (Bengen, 2004). Ecosystems in the
coastal and marine areas are natural and artificial.
Natural ecosystems located in coastal areas, namely
mangrove forests, coral reefs, seagrass, sand beaches,
rocky beaches, and estuary waters.
2.1 Reclamation
Coastal reclamation is carried out taking into account
the socio-economic conditions of the population,
given the increasingly rapid growth rate, which
causes the land for development increasingly narrow.
Reclamation makes watery areas that are damaged or
of less value become better and more useful. The new
area is usually used for residential, industrial,
business, and urban areas, ports, and tourist
attractions. In the theory of urban planning, coastal
reclamation is one step in city expansion. Usually the
reclamation is carried out by the state or big city with
the rate of growth and land needs increasing rapidly,
but experiencing constraints of land limitations. This
condition is no longer possible to expand to the
mainland, so new land is needed. Another alternative
is to form a vertical division by building a port as part
of the distribution of goods and anchoring ships.
Coastal reclamation is a subsystem of the coastal
system.
2.2 Impact of Coastal Reclamation
Based on the Minister of Home Affairs Regulation
(PERMENDAGRI) No. 1 of 2008 concerning coastal
reclamation, the implementation of coastal
reclamation must pay attention to environmental
interests, ports, mangrove forest areas, fishermen, and
other functions in the coastal area and the
sustainability of the surrounding coastal ecosystem.
Planning in reclamation activities should be aligned
with the city spatial plan. The new city spatial
planning must pay attention to the social and
ecological carrying capacity of the city. Reclamation
project activities around the coastal area require a
scientific feasibility study through a technical study
of how much environmental damage will be caused
and then conveyed openly to the public. It is
important to remember that reclamation is a form of
human intervention in the balance of the natural
environment of the coast. In a coastal ecosystem that
has long been formed and arranged as it should, it will
ISOCEEN 2019 - The 7th International Seminar on Ocean and Coastal Engineering, Environmental and Natural Disaster Management
38

lose its balance due to reclamation activities. The
effect of these impacts is one of which affects the
lives of surrounding communities. Many fishermen
and workers in the fisheries sector will lose their
livelihoods due to the decrease in the number of fish
due to damage to the ecosystem due to runoff from
sediments (Francisca, 2017).
2.3 Limitations of Environmental
Carrying Capacity Due to Coastal
Reclamation
According to Dahuri (2000) the main problems in the
management of coastal areas are activities of
pollution, overfising, erosion, coastal sedimentation,
extinction of biota types, and conflicts in the use of
the region: due to the high environmental pressure
caused by the population along with all the gait of life
and development of the environment of the coastal
area which has a limited ability to support the concept
of the environment based on the idea that the
environment has the maximum capacity to support
the growth of organisms (Bengen, 2002). The
environmental carrying capacity classification
includes:
1. Ecological: The maximum level (both quantity
and volume) of the use of a resource or ecosystem
that can be accommodated by an area before
ecological decline;
2. Physical: The maximum amount of utilization of
a resource or ecosystem that can be absorbed by
an area without causing physical quality
degradation.
3. Social: The level of comfort and appreciation of
users of a resource or ecosystem to an area due to
the presence of other users at the same time.
4. Economy: The level of scale of effort in the
utilization of a resource that provides maximum
economic benefit on a sustainable basis.
According to Scones (1993) the carrying capacity of
the environment is divided into two namely
ecological carrying capacity and economic carrying
capacity. Ecological carrying capacity is the
maximum number of organisms on a land that can be
supported without causing death due to density
factors, as well as the occurrence of permanent
environmental damage. While economic carrying
capacity is the level of production of businesses that
provide maximum profit and is determined by the
business objectives economically.
2.4 Tidal
Knowledge about tides will be very important when
we plan to build a port by coastal reclamation. The
ups and downs that occur in each region are not the
same. In general, tides in various regions can be
divided into 4 types:
1. A single daily tidal (diurnal tide)
In one day there is one tide and one tide with a tidal
period is 24 hours 50 minutes.
2. Install double daily shrinkage (semi diurnal tide)
In one day there are two tides and two tides with
almost the same height and tides occur regularly.
The average tidal type is 12 hours 24 minutes.
3. Tidal mixture tends to a single daily (mixed tide
prevalling diurnal)
In one day there is one tide and one tide, but
sometimes temporarily there are two tides and two
tides with a very different height and period.
4. Tidal mixture tends to double daily (mixed tide
prevalling diurnal)
In one day there were two tides and two times low
tide, but the height and period were different.
According to Haryono (2004), tides are the result of
gravitational forces and centrifugal effects.
Centrifugal effect is the movement or push towards
the outside center of rotation of the earth. The
influence of the moon's gravitational force is two
times greater than the force of the sun in generating
the tides, because the distance of the moon is closer
than the distance of the sun to the earth. Within a
month, the daily variation of the tidal range changes
systematically to the lunar cycle. The tidal range also
joins to the shape of the volume of the water and the
shape of the ocean floor undergoing movement.
Vertical water movements associated with the ups
and downs of the tides, accompanied by horizontal
water movements called tidal currents.
2.5 Wave
The main energy that forms the coastal system is
waves. Ocean waves are a natural phenomenon in the
form of raising and decreasing water slowly and can
be found throughout the world. Waves in the sea often
appear irregular and change frequently. This can be
observed from the surface of the water which is
caused by the direction of wave propagation that is
very varied and irregular waveforms, especially if the
waves are under the influence of the wind. According
Pratikto (2000) said that the shape and propagation of
waves that vary and irregularly greatly affect the
characteristics of the waves that occur in these waters.
In addition to changes in height, length and speed of
waves also occur other phenomena such as silting,
refraction, diffraction and reflection before the wave
breaks. The process resulted in changes in wave
Modeling of Total Suspended Solid based on Remote Sensing Reclamation Data of Teluk Lamong Port
39
speed. Sea waves that move into coastal waters
experience a high increase which makes the waves to
increase. Furthermore, the speed of water particles at
the peak of the wave approaches the speed of the
wave, so that when the water particles are greater than
the speed of the wave, the wave becomes unstable and
breaks (Duxbury, et. Al., 1994).
2.6 Current
The current is a very broad movement of water, often
occurring throughout the ocean. Waves that come
towards the coast can cause nearshore current.
Currents are also formed due to the wind blowing in
a very long time interval, can also be caused by waves
that form the beach obliquely. It can also be caused
by waves coming towards the coastline. Currents can
also carry suspended sediments or those found at the
bottom of the sea. Circulation of ocean currents is
divided into two categories, namely surface
circulation and circulation in the sea (intermediate or
deep circulation). Sea surface currents are generally
driven by wind stress acting at sea level. Wind tends
to push the layer of water on the surface of the sea in
the direction of the movement of the wind. But
because of the influence of the earth's rotation or the
influence of the Coriolis force. The variation of
currents generated by the wind against depth is
explained theoretically by Ekman (1905).
2.7 Total Suspended Solid
TSS are suspended materials (> 1µm diameter) that
are held in a filter with a pore diameter of 0.45 µm.
TSS consists of mud and fine sand and
microorganisms. The main causes of TSS in waters
are soil erosion or soil erosion carried into water
bodies. TSS concentration if too high will inhibit the
penetration of light into water and cause disruption of
photosynthesis. The spread of TSS in coastal and
estuary waters is influenced by several physical
factors including wind, rainfall, waves, currents and
tides (Effendi, 2000). Sastrawijaya (2000) states that
TSS concentrations in waters generally consist of
phytoplankton, zooplankton, human waste, animal
waste, mud, crop and animal residues, and industrial
waste. Materials that are suspended in natural waters
are not toxic, will occur if excessive amounts can
increase the value of turbidity which further inhibits
the penetration of sunlight into pools of water
(Effendi, 2000). Remote sensing technology has been
widely applied to study water quality, one of which is
TSS. The quality of waters has different light
penetration in certain areas, can be determined by
multispectral techniques (Barret and Curtis, 1982).
The higher TSS concentration will have a higher
reflectance value.
3 METHOD
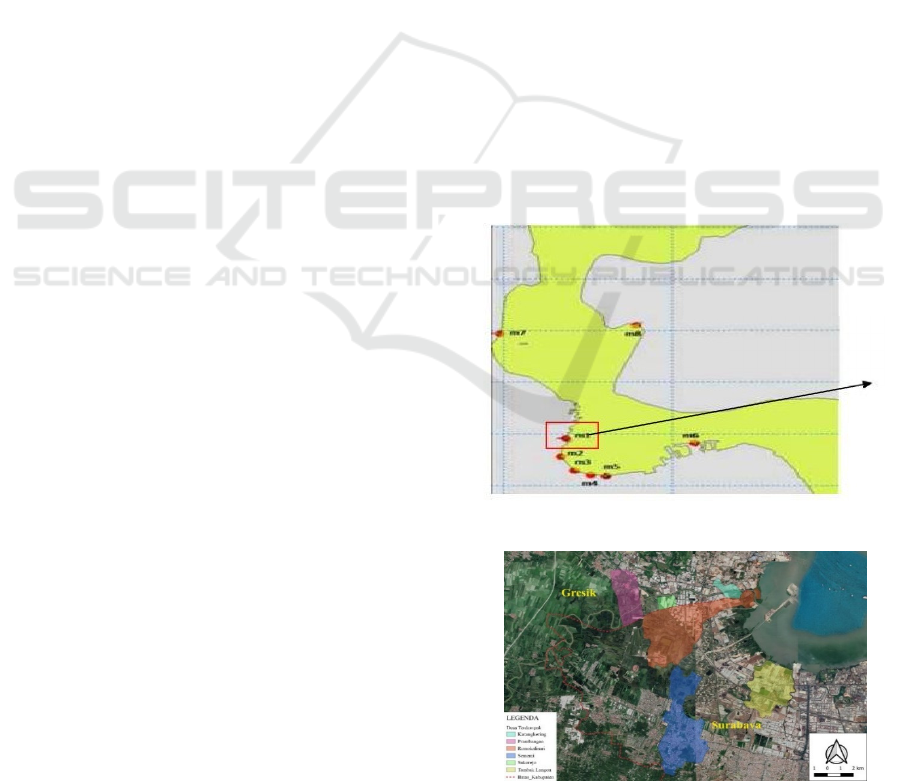
This research was conducted at the Lamip Bay
Multipurpose Terminal Port, located in the border
area between Surabaya City and Gresik Regency,
which is adjacent to two ports owned by PT
Pelabuhan Indonesia III, namely Gresik Port to the
west and Tanjung Perak Main Port to the east. The
selection of research sites is done purposively. Based
on the results of reading the literature and information
related to the existence of port development by means
of coastal reclamation that can affect coastal
resources, this location was chosen to be used as a
research location. Based on the Port Development
will affect the condition of coastal ecosystems and the
livelihoods of coastal communities, it is necessary to
study the impact of coastal resources on the
development of Teluk Lamong Multipurpose
Terminal Port from the aspect of physical impact. The
research was carried out starting in the third semester,
with the research location in Figure 1 and the survey
point in Figure 2.
Figure 1: Research Sites.
Figure 2: Location of the Research River.
Location of the
Research
ISOCEEN 2019 - The 7th International Seminar on Ocean and Coastal Engineering, Environmental and Natural Disaster Management
40

3.1 Systematics and Research Limits
This thesis research is carried out for one semester,
while the research activities include:
1. Problem Formulation.
This stage as the identification of problems,
determinants or focus of a study. The main
problem of this research is the factors or impacts
caused by coastal resources namely, the pattern of
water currents, TSS in the construction of the Port
of the Lamip Multipurpose terminal.
2. Literature Study.
This activity is carried out to gather information
related to research in the form of theoretical
concepts and relevant matters. Literature sources
obtained from the internet, reports related
institutions, scientific articles, journals, media,
books, and other documents.
3. Data Processing.
Namely knowing the analysis of shoreline
changes, modeling the pattern of water currents,
and modeling TSS concentrations based on
sensing data long before and after the construction
of the Teluk Lamong Multipurpose Port terminal
4. Data Validation.
Data validation is an activity carried out to
measure the extent of differences and errors.
5. Results and Discussion.
It is a modeling of waters flow patterns in 2012
and 2020 based on Navy Hydrographic and
Oceanographic Center data (DISHIDROS) and
the National Meteorology, Climatology and
Geophysics Agency (BMKG), and TSS
concentration modeling based on remote sensing
data of the 2A Sentinel Image 2020 National
Institute of Aviation and Space (BMKG), and
modeling of TSS concentrations based on remote
sensing data of the 2A Sentinel Image in 2020.
LAPAN). The input from this data processing
explains the correlation of the coastal condition of
the Teluk Lamong Multipurpose Port terminal
with the physical environmental conditions based
on 2020.
6. Conclusion.
It is the answer of the research objective, which is
to know the current pattern and sediment
distribution.
3.2 Data Processing Stages
In the stages of managing the impact study data
before and after the construction of the Teluk Lamong
Multipurpose Port:
1. Analyze shoreline changes using DSAS software
based on Landsat 7 in 2012 and Landsat 8 in 2020
satellite image data.
2. Determine the focal point of TSS research using
remote sensing aids, namely Sentinel 2A satellite
imagery recording on January of 2020 then
processed using Google Earth Engine at the
LAPAN Agency.
3. Modeling the condition of water flow patterns in
the Port of Multipurpose Bay in Lamong Bay
based on wind, tidal and bathymetry data
processed using Mike 21 software.
4. TSS modeling using Mike 21 software based on
remote sensing data.
4 RESULTS
4.1 Total Suspended Solid Remote
Sensing
TSS is suspended material that causes water turbidity
consisting of mud, fine sand and microorganisms
mainly caused by soil erosion or water-borne erosion
(Effendi, 2003). TSS is one of the important factors
to measure water quality based on physical aspects
including the addition of solids both organic and
inorganic material into the waters so as to increase
turbidity which will further inhibit the penetration of
sunlight into water bodies. The amount of TSS that is
in the waters can reduce the availability of dissolved
oxygen. So the high TSS can also directly disrupt
aquatic biota. To identify the TSS of Teluk Lamong
Port, TSS remote sensing was carried out using
Sentinel 2A imagery in 2020 and Landsat 8 satellite
imagery in 2017 and 2019. Remote sensing of the
distribution of TSS at Teluk Lamong Port using
Sentinel 2A satellite imagery in 2020 using Google
Earth Engine Software software. In the work of
remote sensing the first step taken is to make a
mosaic.Data analisi Total Suspended Solid (TSS)
Data processing from Sentinel 2A satellite imagery in
2020 uses Google earth engine software that can
produce TSS remote sensing output. The channels in
the Sentinel satellite image data processing are used
to obtain reflectance values which are used to
estimate TSS concentrations. The first stage,
radiometric correction is done to eliminate errors in
the sun's elevation angle and the sun-earth distance.
The second conversion from the DN value to the
radiant value. Third is the conversion of the radiant
value to the reflectance value. Fourth conduct TSS
analysis.
Modeling of Total Suspended Solid based on Remote Sensing Reclamation Data of Teluk Lamong Port
41
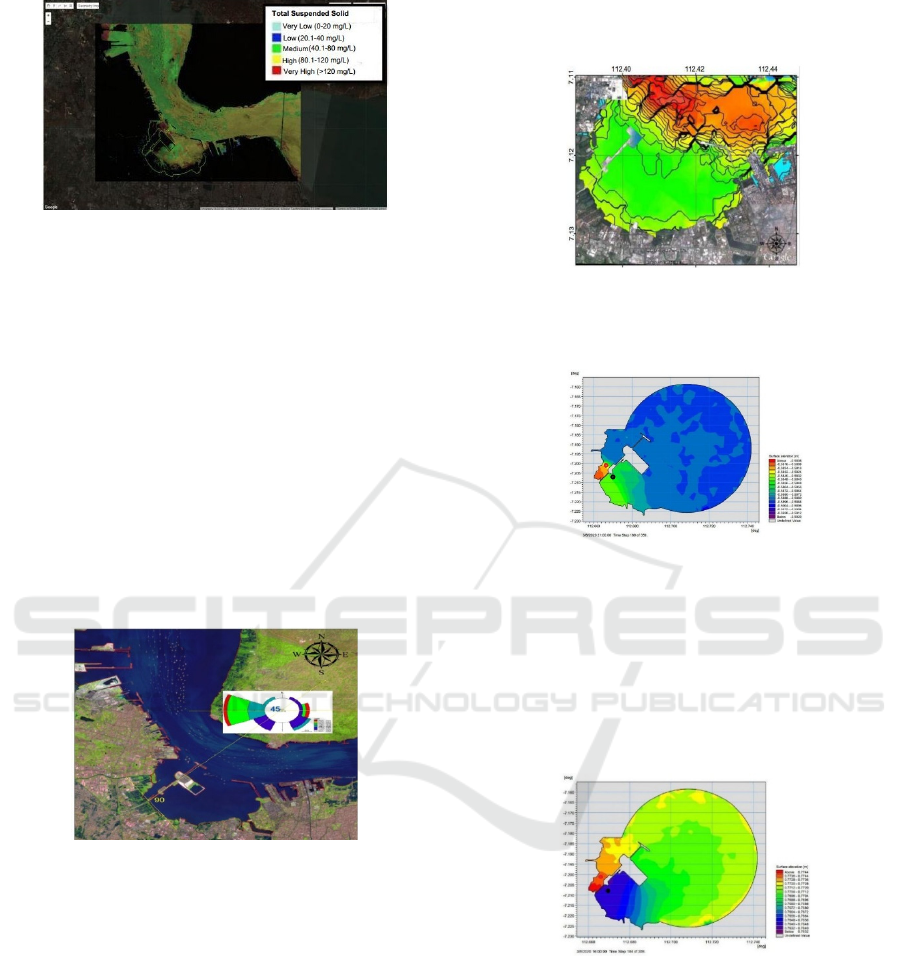
Figure 3: Distribution Total Suspended Solid.
4.2 Modeling of Teluk Lamong Harbor
4.2.1 Wind
One that influences the speed and direction of the
current is the wind factor. In Mike 21 modeling, the
use of wind data as input wind data forcing contained
in the hydrodynamics module. In addition to
influencing the pattern of current movement, wind
can influence wave generation, so that in relation to
sediment transport these three factors are intermittent.
The wind data input used in March 2020 was adjusted
for the timestep modeling simulation conducted. The
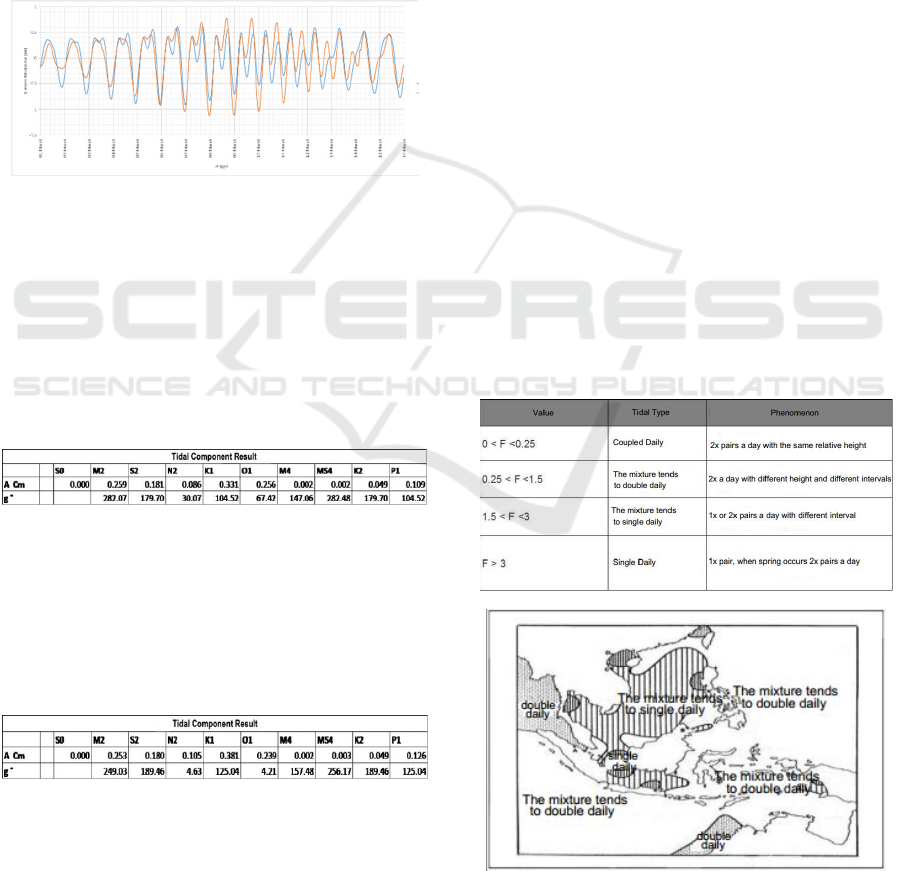
following diagram of the rose wind shows the
dominant direction coming from west to southeast.
Figure 4: March winds.
4.2.2 Depth
Data on seabed depth is a supporting data used in this
study so it is necessary to know the seabed condition
of the Gulf waters, using topex satellite imagery with
file format in the form of SRTM in 2011 to create a
year boundary depth of Teluk Lamong Port. The data
is managed using Global Mapper 14 software which
is done by generating counturs with a contour interval
of 0.1 meters. Furthermore, the data plot has been
processed in Surfer 11 software to get a bathymetry
contour map in the form of 2D maps.
Then the data is meshed on a map plot in Arcgis 10.61
software used in the bathymetry plot in Mike 21
software. The input file is boundary of land and water.
Next is the display of the xyz input file modeling
results in Mike 21 software.
Figure 5: Depth.
4.2.3 Tides
Figure 6: Low Tide Conditions.
For the model of current patterns at low tide in Figure
6 occurred on timestep 191 dated March 8, 2020 at
23:00 with the maximum water level at low tide
conditions is -1.0875 meters at the red point and -
1.055 meters at the black point, the speed of the
current at this condition range between 0.01 m / s for
both points.
Figure 7: High Tide Conditions.
For the current tide pattern model in Figure 7
occurs on timestep 184 dated March 8, 2020 with the
maximum water level at tide conditions is 0.7744
meters for the yellow point and 0.7640 meters for the
black point, the current speed in this condition ranges
from 0.008 m / s for the yellow dot and 0,008-0,016
m / s for the second black.
Tidal Validation. Tidal conditions are analyzed
using the harmonic analysis method, this method has
ISOCEEN 2019 - The 7th International Seminar on Ocean and Coastal Engineering, Environmental and Natural Disaster Management
42
a tidal pair hypothesis is the sum of several wave
components that have a certain amplitude and
frequency. This analysis is to obtain the amplitude
and phase of the tidal components. Tidal recording
and forecasting is carried out for 15 days in a row with
observation points 7 ° 12 '17 "LS and 112 ° 40 '46"
East. The high observations that were started were
analyzed using the Admiralty method and verified
with the Root Mean Square Error (RMSE) and Cost
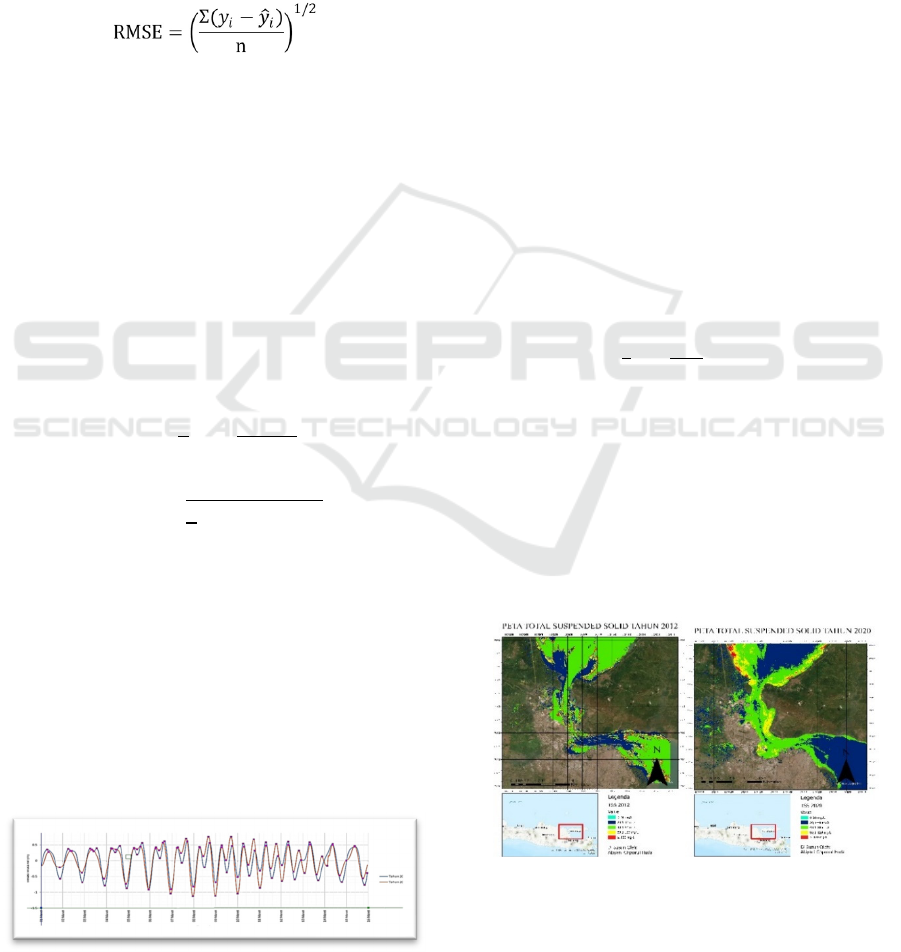
Function (CF) methods. The following is the tidal
data presented in Table 2 and Table 3. While graphs
representing tidal data for 2012 and 2020 are
presented in Figure 12.
Figure 8: Tide Comparison Charts for 2012 and 2020.
Admiralty Analysis. Calculation using the admiralty
method, which is a calculation to find the value of the
amplitude (A) and phase difference (g0) of the
observation data for 15 or 29 pigs (observation days)
and the mean sea level (S0) which has been corrected
(Smoothing). The following are tidal components of
the 2012 admiralty method analysis results and 2020.
Table 1: Tidal Component 2012.
The types of tides in the Madura Strait waters in
2012 according to Formzahl (F) numbers based on the
tidal components in the table above are as follows.
F = (K1+O1) / (M2+S2)
= (0.331+0.256) / (0.259+0.181)
= 1.336
Table 2: Tidal Component 2020.
Tidal types in the waters of the Madura Strait in
2020 according to the Formzahl (F) number based on
the tidal components in the table above are as follows.
F = (K1+O1) / (M2+S2)
= (0.381+0.239) / (0.253+0.180)
= 1.433
The explanation of the tidal components above is as
follows:
• S0 is MSL
• M2 is a tidal component that is influenced by the
moon's gravitational phenomenon with circular
orbits and parallel to the earth's equator.
• S2 is a tidal component that is influenced by the
phenomenon of solar gravity with circular orbits
and the earth's equatorial alignment.
• N2 is a tidal component that is influenced by
the phenomenon of changes in the distance of
the moon to the earth due to elliptical paths.
• K1 is a tidal component that is influenced by the
phenomenon of the declination of the moon and
sun systems.
• O1 is a tidal component that is influenced by the
phenomenon of moon declination.
• M4 is a tidal component that is affected by the
phenomenon of twice the angular velocity of
M2.
• MS4 is a tidal component that is influenced by
the phenomenon of interaction between M2 and
S2.
• K2 is a tidal component that is influenced by the
phenomenon of changes in the distance of the
moon to the earth due to elliptical paths.
• P1 is a tidal component that is influenced by the
phenomenon of solar declination.
Table 3: Classification of Tidal Type.
Figure 9: Distribution of Tidal Types in Indonesian Waters
(Triatmodjo, 1999).
Modeling of Total Suspended Solid based on Remote Sensing Reclamation Data of Teluk Lamong Port
43
Formzahl's numbers are 1,336 and 1,433,
according to Table 4.9, the numbers are classified as
0.25 <F <1.5 or a mixture of double daily skew. In
Figure 2, the tidal type in the Madura Strait Waters
indicated by a red circle is the Mixed Daily Condong
Mix.
Data Verification. 2012 Tidal Analysis is used as a
reference for verification of 2020 data. Quantitatively
by calculating the amount of errors that occur from
each data can be calculated by:
dimana:
RMSE : Root Mean Square Error
y : data of 2012
ŷ : data of 2020
n: amount of data
Based on the results of analysis and verification of
tides obtained RMSE value of 0.253 or a level of
confidence of 74.7%.
Model verification is used to determine the
accuracy of both wind data sources quantitatively by
calculating the amount of error that occurs from each
data. Wind speed verification uses a Cost Function
(CF) statistical analysis. According to George et al.
(2010), the calculation of the CF method can be done
with the formula:
CF =
∑
|
|
dengan
𝜎𝐷
∑
𝐷𝑛 𝐷
2
Where N is the amount of data; n is nth data; D is the
2012 data value; σD is the standard deviation; M is
the 2020 data value; D is the 2020 average data and
CF is the Cost Function. According to George et al.
(2010), the criteria used are:
CF < 1 = Sangat Baik 1 < CF < 2= Baik
2 <CF <3 = Less CF> 3 = Very Less
Based on the analysis, it is known that CF is obtained
by 0.485 This means that verification of data for 2012
and 2020 is in the range of CF <1 or very good.
Figure 10: Tidal 2012 and 2020.
4.3 Total Suspended Solid
Sediments on the coast cannot be separated due to
oceanographic factors that occur in the waters around
the coast. Oceanographic factors that influence
sediment type and sediment distribution are tides,
wind, waves and currents. Sediment distribution
modeling uses the parameters of currents generated
by tides and wave effects. Sediment sample data
based on the journal Sediment Distribution Pattern
Analysis to Support Maintenance of Port Waters
Depth Using 3D Hydrodynamic Modeling by
Pratomo et al., 2017 with a density value of 1188
kg/m³, dry density 884 kg/m³ and sediment
concentration of (D50) 0, 0738 mm. Sediment
transportation is important to know the speed of
sediment, especially supine sediment. For non
cohesive sediments, such as sand, sedimentation
velocity depends on the density of sediment and water
mass, water viscosity, dimensions and shape of
sediment particles (Triatmodjo, 2016). Also in
calculating the rate of sedimentation hydrometer
analysis is needed which aims to determine the grain
size of the suspended sediment which intends to
determine the speed of deposition of soil grains in
water using Stoke's Law, with the formula;
𝑉
1
8
ϻ
𝐷𝑥𝑔
ŋ
𝛾𝑆 𝛾𝑤
D : grain diameter (mm)
V : speed of settling soil grains (cm / s)
γS : grain weight (g / cm³)
γw : weight of water content (g / cm³)
ϻ : water thickness
Sediment transportation is the transfer of material
from one place to another. This transfer is in the form
of an increase (inflow) or reduction (outflow).
(Achmad, 2011).
Figure 11: Remote Sensing of Total Suspended Solid.
Sources of sediment data based on the journal
Study of the Impact of the Reclamation Plan in
Lamong Bay, East Java Province on Tidal Flow
ISOCEEN 2019 - The 7th International Seminar on Ocean and Coastal Engineering, Environmental and Natural Disaster Management
44
Patterns and Sediment Transports and data on the tide
and tide flow velocity results of Mike 21 modeling
based on BIG 2012 data Tidal current velocity of 0.2
m / s, tidal current velocity of 0.1 m/s and (D50)
sediment concentration of 0.0738 mm.
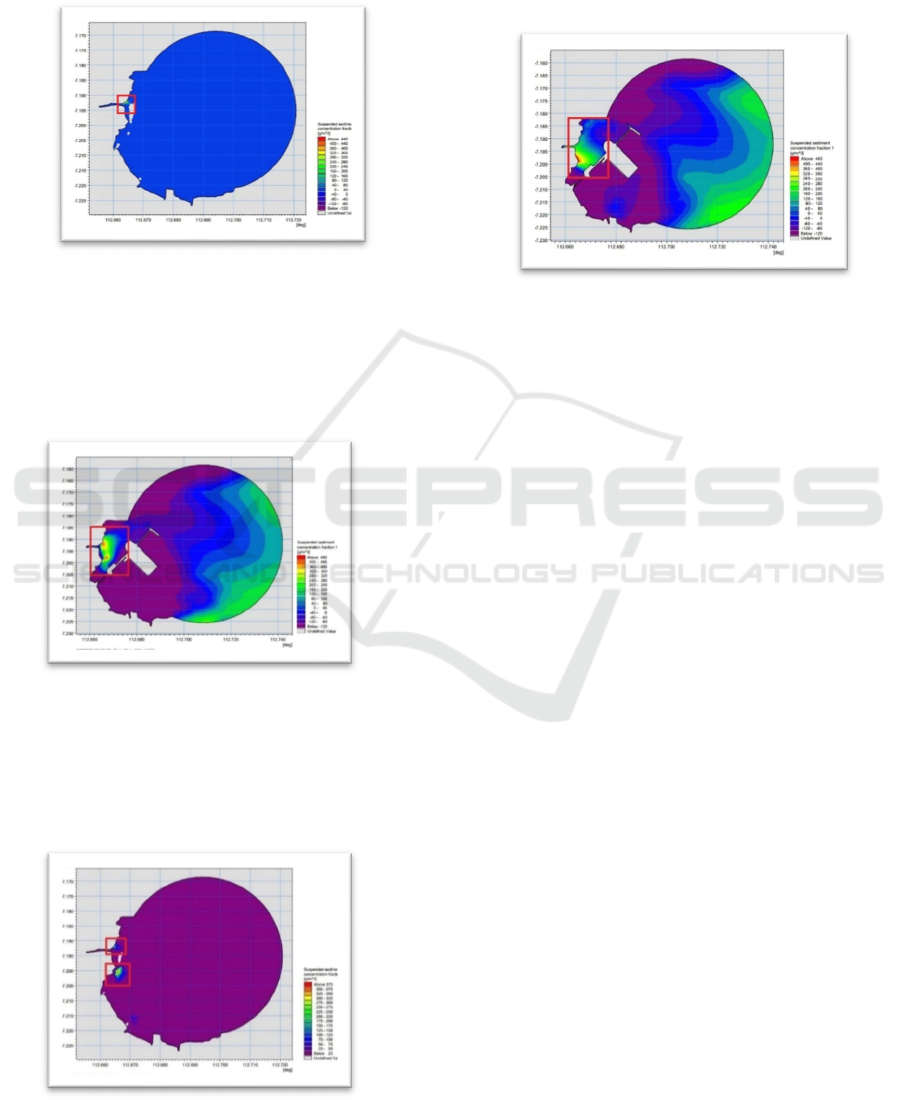
Figure 12: TSS of Law Tide 2012.
Based on observations of suspended sediment at low
tide in Figure 12 on March 5, 2012 at 22:00 timestep
115. It can be seen that the value is quite high in the
area around the Lamong River with values ranging
from 320-360 g / m³.
Figure 13: TSS of Law Tide 2020.
Based on observations of suspended sediment at
low tide in Figure 13 on March 8, 2020, 23:00
timestep 191. There are high values in the area around
the Lamong River with values ranging from 360-400
g / m³.
Figure 14: TSS of High Tide 2012.
Based on observations of suspended sediment at
low tide in Figure 14 on March 7, 2012 at 17:00
timestep 161. It can be seen that the value is quite high
in the area around the Lamong River at two
observation points with values ranging from 325-350
g/m³.
Figure 15: TSS of High Tide 2020.
Based on observations of suspended sediment at low
tide in Figure 15 on March 8, 2020 at 16:00 timestep
184. There are high values in the area around the
Lamong River at two observation points with values
ranging from 440 g/m³. Changes in the bottom profile
of the water can occur due to the sedimentation
process or due to silting. Factors affecting the
sedimentation or siltation process include the
movement of currents, waves, and tides as well as
new buildings created on the coast of Lamong Bay.
In this study, sediment changes were observed based
on changes in the bed base change (bed level change)
located in the area within the Port of Teluk Lamong.
Modeling observations were carried out by
comparing changes in the bottom profile of the water
after modeling simulations for 15 days with the object
of the port research conditions before reclamation and
after beach reclamation. Based on the results of the
pomedelan, TSS conditions are greater in the Lamong
River. Lamong River is part of the Bengawan Solo
River Basin Unit which is managed by the Solo
Bengawan River Basin. The Lamong River estuary is
a tidal area, where at high tide the area is submerged
in seawater, but at low tide this area becomes
landlocked. As a result of this land tends to increase
sedimentation processes so that the land area becomes
wider. The Lamong River downstream flows on the
alluvial land with a gentle slope, so sediment
transport is dominated by fine fractions with
relatively large amounts that can settle at the estuary
(Sulistyaningsih, 2000). The following is data on
river flow and river sediment concentrations which
empties into Lamong Bay based on research by
Alwafi Pujiraharjo (2013) with the title Study of the
Modeling of Total Suspended Solid based on Remote Sensing Reclamation Data of Teluk Lamong Port
45

Impact of the Reclamation Plan in Lamong Bay, East
Java Province on Tidal Flow Patterns and Sediment
Transportation. With the reclamation of the waters of
the lamong bay, the narrowing of the flow of water
around the lamong river and the silting of galang
island, the velocity of the flow between the lamong
river becomes large. This will result in greater
sediment transport from rivers. Likewise, at low tide,
outflows from lamong bay pass through the lamong
river area. The currents are quite large at high tide but
at low tide, the flow velocity in the lamong river and
galang island areas becomes so small that the
sediment transported will be easily deposited and
gradually cause siltation.
5 CONCLUSION
The model of the current pattern at low tide in Figure
6. The maximum water level at low tide is -1.0875
meters at the red point and -1.055 meters at the black
point, the current velocity at this condition ranges
between 0.01 m / s for both points. For the current tide
pattern model in Figure 7 occurs with the maximum
water surface height at tide conditions is 0.7744
meters for the yellow point and 0.7640 meters for the
black point, the current speed in this condition ranges
from 0.008 m / s for the yellow point and 0.008-0.016
m / s for the second black. Tidal current velocity of
0.2 m / s, tidal current velocity of 0.1 m / s and (D50)
sediment concentration of 0.0738 mm around the Port
of Teluk Lamong with an average TSS value of 4.998
per area.
REFERENCES
Barret, R. B and L. F. Curtis. 1982. Introduction to
environmental remote sensing. Chapman and Hall.
London. 352 h.
Bengen, 2002. Synopsis: Coastal and Marine Ecosystems
and Natural Resources and Their Management
Principles, Third Matter. Center for the Study of
Coastal and Ocean Resources. Bogor Agricultural
Institute.
Bengen, D. G., 2004. Towards Integrated Coastal Area-
Based Management (DAS), in Land and Sea
Interactions: Their Impacts on Resources and
Environments, Proceedings of the Land and Sea
Interaction Symposium. Edited by W.B. Setyawan, et
al. Jakarta: Deputy for Earth Sciences, Indonesian
Institute of Sciences.
Dahuri, R. et al, 1996. Integrated Management of Coastal
and Ocean Resources. Jakarta: PT. Pramadya Paramita.
Dahuri, 2000. Utilization of marine resources for the
welfare of the people. Indonesian Institute of
Information and Development Studies (LISPI). Jakarta.
Duxbury, A; B. ALYN; C. Duxbury And K.A. Sverdrup
2002. Fundamentals of Oceanography-4th Ed,
Mcgraw-Hill Publishing, New York.
Effendi, H., 2000. Water Quality Study for Water
Resources and Environmental Management. IPB's
Faculty of Fisheries and Marine Sciences. Bogor.
Francisca, Maria. 2017. Environmental Sustainability of
Marine Natural Resources in the Implications of Marine
Reclamation. President University. Bekasi.
Haryono and Narni S. 2004. Morphometry and Its
Relationship with the Agrarian Process of the Muara
Wai Tonahitu Area and Surrounding Areas. LIPI,
Ambon.
Indonesian government. 2008. PERMENDAGRI Number
1 Year 2008.
Indonesian government. 2007. Law Number 27 of 2007
Article 34.
Indonesian government. 2007. Law Number 27 of 2007
Article 1 Paragraph 2.
Scones, J. B. 1993. Global Equity and Environmental
Crisis: An Argument for Reducing Working Hours in
the North. World Development 19, 1: 73-84.
Odum, E. P., 1971. Fundamentals of Ecology. Third edition
of Gadjah Mada University Press. Yogyakarta.
Pratikto et al., 2007. Spatial Planning Guidelines for
Coastal Reclamation Area. Jakarta.
Sastrawijaya, A. T. 2000. Environmental Pollution. Rineka
Cipta. Jakarta.
Triatmodjo, Bambang. 1999. Coastal Engineering.
Yogyakarta: Beta Offset.
ISOCEEN 2019 - The 7th International Seminar on Ocean and Coastal Engineering, Environmental and Natural Disaster Management
46
