
The Determinations of Return on Equity in the Food and Beverage
Industry in Indonesia Stock Exchange
Nurjannah Endah Rahayu
1
, Eva Cahaya Reski
2
,Sugiyanto
1
and Jatmiko
1
1
Lecturer of Department of Management Faculty of Economic and Business, Esa Unggul University
2
Student of Department of Management, Esa Unggul University, Kebon Jeruk, Jakarta, Indonesia
Keywords: Financial Leverage Multiplier (FLM), TotalAssetsTurnover (TATO), Operating Profit Margin (OPM),
Interest Burden (IB), Tax Burden (TB) and Return on Equity (ROE).
Abstract: This study aims to determine the influence of Financing Leverage Multiplier (FLM), Total Asset Turnover
(TATO), Operating Profit Margin (OPM), Interest Burden (IB), and Tax Burden (TB) toward Return on
Equity (ROE). The type of research is explanatory causality and using secondary data. This study set out five
years from 2011-2015. Purposive sampling technique used in the sampling and uses 18 companies from all
over the food and beverage companies in Indonesia. The 70 data obtained from financial statements at 18 the
food and beverage companies. Data analysis with multiple regression, hypotheses test used partial t – test and
F – test at the level of significance 5%. The results of this study indicate that: partially
(1)FinancialLeverageMultiplier (FLM) has significant positive influence toward Return on Equity (ROE), (2)
Total Assets Turnover (TATO) has positive significant influence toward Return on Equity (ROE), (3)
Operating Profit Margin (OPM) has significant positive influence toward Return on Equity (ROE), (4) Interest
Burden (IB) have significant positive influence toward Return on Equity (ROE), and (5) Tax Burden (TB)
have a negative influence and insignificant toward Return on Equity.
1 INTRODUCTION
Food and beverage industries are one of the
categories of industrial sectors in Indonesia Stock
Exchange which have the opportunity to grow and
develop. Food and beverage industry predicted will
improve its condition. It is seen growing food and
beverage industries mushrooming in the country. This
condition makes the competition getting tougher so
that the managers of the company looking for
investors to invest their funds in the food and
beverage companies.
Consumer goods became an important industry
for the economic development of the nation. This is
not apart from the companies that are engaged in the
industry of consumer goods in Indonesia. It cannot be
denied that in the process of production of consumer
goods it takes lots of resources including human
resources. Consumer goods industry has a role in
absorbing the labour and increase income in a
country. Food and beverage companies area company
engaged in the manufacture of the product later sold
for a huge profit. To achieve that goal required
management with a high level of effectiveness.
Measurement of the level of effectiveness of
management shown by the profit resulting from the
sale of investment income, and can be madeby
knowing how big the profitability ratios that are
owned (Weston and Brigham (2010) in Afrinda
(2013)).
Among of food and beverage companies that are
listed on the Indonesia Stock Exchange more than
other companies. Thismakes the author interested to
choose food and beverage companies as an object that
will be examined, food and beverage companies that
are listed on the Indonesia stock exchange which will
be presented in Table 1.
Table 1: List of the food and beverages companies on the
Indonesian Stock Exchange period 2011-2015
No. Code The name of the companies
1
ADES Akasha Wira International Co., Ltd.
2
AISA Tiga Pilar Sejahtera Food Co., Ltd.
3
CEKA Wilmar Cahaya Indonesia Co., Ltd.
4
DLTA Delta Jakarta Co., Ltd.
2778
Endah Rahayu, N., Cahaya Reski, E., Sugiyanto, . and Jatmiko, .
The Determinations of Return on Equity in the Food and Beverage Industry in Indonesia Stock Exchange.
DOI: 10.5220/0009952627782787
In Proceedings of the 1st International Conference on Recent Innovations (ICRI 2018), pages 2778-2787
ISBN: 978-989-758-458-9
Copyright
c
2020 by SCITEPRESS – Science and Technology Publications, Lda. All rights reserved

No. Code The name of the companies
5
FAST Fast Food IndonesiaCo., Ltd.
6
ICBP
Indofood CBP Sukses Makmur Co.,
Ltd.
7
INDF Indofood Sukses Makmur Co., Ltd.
8
MLBI Multi Bintang Indonesia Co., Ltd.
9
MYOR Mayora Indah Co., Ltd.
10
PTSP
Pioneerindo Gourmet International
Co., Ltd.
11
ROTI
Nippon Indosari Corpindo Co.,
Ltd.
12
SIPD Sierad Produce Co., Ltd.
13
SKBM Sekar Bumi Co., Ltd.
14
SKLT Sekar Laut Co., Ltd.
15
SMAR
Sinar Mas Agro Resources and
Technology Co., Ltd.
16
STTP Sintar Top Co., Ltd.
17
ULTJ
Ultrajaya Milk Industry & Trading
Company Co., Ltd.
18
TBLA Tunas Baru Lampung Co., Ltd.
Source: Indonesia Stock Exchange, processed by the
author.
In this era of globalization the business world
increasingly growing rapidly, there so many new
companies, thereby encouraging companies to be
more efficient and more selective in operation, so that
the objectives of the company in achieving high
profits, in the long run, could be realized.
The company must always be monitored, can be
done by analyzing the financial statements
themselves are generally made up of balance sheets
and reports income statement. The balance sheet
describes the State of the finances of a company at a
certain period, while the income statement shows the
results of the efforts and costs during the period of
accounting. The financial statements will be more
informative and useful, then the parties concerned
with financial information should analyze in advance.
Through the analysis of financial statements can
be known of the success of the firms that are indicated
by the financial report, which is the basis of the
assessment of the achievements ofthe company. One
of the basic considerations that serve as a referencefor
measuring the company's performance was a
financial report. The financial report is an important
source of information for the companies. The
financials have information describing the financial
condition of a company (Fahmi, 2012). The
measurement tool used to analyze financial
statements include ratio analysis, analysis of market
value added (MVA), the analysis of the economic
value added (EVA, the Balance Score Card (BSC),
Analysis of capital asset, management, equity, and
liquidity (CAMEL) and the du Pont system
(Warsono,2003).In this study were used to analyze
the financial statements is to use ratio analysis of
profitability regarding the return on equity (ROE).
Return on equity (ROE) was influenced by
financial leverage multiplier (FLM), total asset
turnover (TATO), and net profit income (NPM). Net
profit income can be broken down into
three,operating profit margins(OPM), interest burden
(IB), and tax burden (TB). Financial leverage
multiplier (FLM) used to measure the ability of
management to manage its assets, due to the costs that
incurred by the use of assets.Research conducted by
Animah et al. (2009), Kumalasari and Widyawati
(2016) shows the results that leverage multiplier
(LM) have a negative influence and significant
toward return on equity (ROE). This contrasts with
the results of research conducted by Hamid et al.
(2016) which suggests that leverage multiplier (LM)
insignificantly toward return on equity (ROE).
Based on the issues above, then the purpose of
this research is (1) Partially, to know the influence of
financial leverage multiplier (FLM), total asset
turnover(TATO), operating profit margins (OPM)
,interest burden (IB), tax burden (TB) toward Return
on Equity (ROE) on the food and beverage companies
in Indonesia, (2) Simultaneously, to know the
influence financial leverage multiplier (FLM), total
asset turnover(TATO), operating profit
margins(OPM), interest burden(IB), and tax
burden(TB) toward Return on Equity (ROE) on the
food and beverage companies in Indonesia
2 LITERATURE REVIEW
2.1 Financial Analysis
For the process of financial analysis is obtained from
a range of sources internally generated by the
company. These statements can be prepared
periodically, generally annually, but could also be
done quarterly or for biannual accounting periods.
The most basic and compact financial document
available to the general public is the financial
statements.
2.2 Return on Equity
Return on equity (ROE) shows how much profit is
generated from shareholders. ROE is calculated from
data in both the balance sheet and profit and loss
statement. Total Assets Turnover is the ratio that
The Determinations of Return on Equity in the Food and Beverage Industry in Indonesia Stock Exchange
2779

indicates the level of efficient use of overall
company's assets in a certain volume of sales,
generates Syamsuddin (2007). Leverage is an
indication of the company uses outside party funds to
buy assets. Net Profit Margin is the ratio between the
net profit (net profit) that is reduced by having the
entire sales expenses including sales taxes,
Syamsuddin (2007). NPM can be broken down into
three namely Operating Profit Margins (OPM),
Interest Burden (IB), and Tax Burden (TB).
Operating Profit Margins (OPM) shows a trend
towards the increase or decrease in performance and
the influence of indirect cost against profits
generated. Interest Burden. The ratio indicates how
much of the resulting operating income to cover
interest expenses.Tax Burden (TB) is used to measure
the influence of taxes on Return on Equity (ROE),
which is the rest of the profit after the interest which
is used to pay tax.
2.3 Relationship among Variables
2.3.1 The Relationship between FLM
(Financial Leverage Multiplier) with
ROE
Financial Leverage Multiplier (FLM) used to
measure the part of the assets that funded by
shareholders. On a good economic condition or
stable, the use of Financial Leverage can provide a
positive influence in the form of an increase in ROE.
Thisis caused the rate of return more than the
company's operating profit. While the used of
Financial Leverage can make negative for ROE,
especially at the weak of economic conditions.
2.3.2 The Relationship between TATO
(Total Asset Turnover) with ROE
This ratio indicates the ability of the company's assets
in generating total net sales. The higher the ratio Total
Assets Turnover (TATO) shows, the more effective
the company uses its assets. Thus it is possible that
the relationship between Total Assets Turnover
(TATO) and Return on Equity (ROE) was positive.
The more effectively a company uses its assets to
generate net sales shows the company achieves better
performance.ROE increased because affected by
Total Assets Turnover (TATO) (Brigham and
Houston, 2001).
2.3.3 The Relationship between OPM
(Operating Profit Margin) with ROE
Operating Profit Margins (OPM) is used to measure
the influence the profitability of the operations toward
Return on Equity (ROE). Also, Operating Profit
Margin (OPM) is used to find out the trend towards
increased or decreased performance and influence of
indirect cost toward profits generated by the firms.
The larger the OPM, then the greater the ROE
generated, meaning that the company's performance
is the better (Kharatyan, 2016).
2.3.4 The Relationship between IB (Interest
Burden) with ROE
Interest Burden (IB) is used to measure the
influence of interest toward Return on Equity (ROE).
This ratio is used to find out how much of the
operating income to cover interest expenses. The
higher the ratio of Interest Burden (IB) means the
greater operating profit (Kharatyan, 2016).
2.3.5 The Relationship between TB (Tax
Burden) with ROE
Tax Burden (TB) is used to measure the influence of
taxes on Return on Equity (ROE), the rest of the
profit after the interest which are used to pay taxes
This TB will measure how much profit before
corporate taxes The higher the Tax Burden ratio (TB)
means,thegreater the operating profit can pay the tax
burden (Kharatyan, 2016).
3 HYPOTHESIS
The hypothesis of this research are:
H1: Financial leverage multiplier (FLM), have
significant positive influence toward return on
equity (ROE).
H2: Total asset turnover (TATO), have significant
positive influence toward return on equity
(ROE).
H3: Operating profit margins (OPM), have
significant positive influence toward return on
equity (ROE).
H4: Interest burden (IB), have significant positive
influence toward return on equity (ROE).
H5: Tax burden (TB), have positive significant
influence toward return on equity (ROE).
H6: Financial leverage multiplier (FLM), Total
asset turnover (TATO), Operating
profitmargins (OPM), Interest burden (IB),
ICRI 2018 - International Conference Recent Innovation
2780

Tax burden (TB), significant simultaneous
influence toward return on equity (ROE).
4 RESEARCH METHOD
4.1 Population, Sample, and Sampling
Techniques
The population in this study are the whole of the food
and beverage companies that are listed on the
Indonesia stock exchange period 2011-2015. All
companies listed in the food and beverage industry
that is sampled so that the sampling technique uses
census methods. The data used in this study is the
financial statements of the food and beverage
companies that are listed on the Indonesia stock
exchange period 2011-2015, there are 70
observations from 18 companies.
4.2 Data Analysis Techniques
4.2.1 Classic Assumption Test
Classical assumptions in the study include the
normality test, Heteroscedasticity test,
multicollinearity test and autocorrelation test.
a. Normality test aims to test all of the variables
have a normal distribution of data
b. Heteroscedasticity is to know the differential
among data variable. It is better if there are no
Heteroscedasticity in data.
c. Autocorrelation Test, This analysis is to know
whether there are any disturbances in analysis or
not. The analysis tool is Durbin Watson and the
best data if there is no correlation among variable.
To calculate DW dU < d<(4 – dU).
d. Multicollinear defined as the extent to which
variables in multiple regression analysis are
related to each other (Zikmund et al., 2013).
4.2.2 Statistic Descriptive
Descriptive statistics were used to provide an
overview or description of a data seen from the
average value (mean), standard deviation, variance,
maximum, minimum, sum, range, kurtosis and
Skewness distribution.
Descriptive statistics were used to provide an
overview or description of a data seen from the
average value (mean), standard deviation, variance,
maximum, minimum, sum, range, kurtosis and
Skewness (skewness distribution).
4.3 Data Analysis (Multiple Regression
Analysis
)
Y= ɑ + β1 X1+ β2 X2+ β3 X3+ β4 X4+ β5 X5 +e
Where:
Y = Return on equity,
X1 = Financial Leverage Multiplier,
X2 = Total Assets Turnover,
X3 = Operating Profit Margin,
X4 = Interest Burden,
X5 = Tax Burden,
e = error,
β = coefficient beta.
a. Return On Equity (ROE)
ROE=
(1)
b. Financial Leverage Multiplier (FLM)
FLM=
(2)
c. Total Asset Turnover (TATO)
TATO=
(3)
d. Operating Profit Margin (OPM)
OPM=
(4)
e. Interest Burden
IB=
(5)
f. Tax Burden (TB)
TB=
(6)
5 RESULTS
5.1 The Result of Classic Assumption
Test
From the KolmogorovSmirnov test data analysis (see
appendix) all of the variables are normally distributed
because all of the variables have sig value more than
0,05. The results of the data analysis show that there
is no interdependence relationship between the
The Determinations of Return on Equity in the Food and Beverage Industry in Indonesia Stock Exchange
2781

independent variables. This can be seen from the VIF
value for all independent variables less than 5 (see
appendix).
The results of autocorealysis analysis show that
the data is free from autocorrelation, this can be seen
from the value of DurbinWatson of 1.793 more than
the minimum value of Du of 1.7683. The results of
heteroscedasticity analysis show that the data is free
from heteroscedasticity, it can be seen that the scatter
plot spreads across the four quadrants (see appendix).
5.2 The Result of Statistics Descriptive
There are 70 observations in total from 18 companies
during five years.This below are the result of analysis
data Return on Equity (ROE), Financial Leverage
Multiplier (FLM), Total Assets Turnover (TATO)
,Operating Profit Margin (OPM), Interest Burden
(IB) , and Tax Burden (TB) on company that are listed
in Indonesia Stock Exchange period 2011-2015 can
be observed as in Table 2.
Table 2: Descriptive Statistic
N Min Max Mean Std. Dev.
OPM 70 0,0144 0,3918 0,113 0,075347
ROE 70 0,0065 0,648 0,173 0,102521
IB 70 0,0793 1,529 0,880 0,23308
TB 70 0,646 0,87 0,751 0,0336
TATO 70 0,4477 2,8827 1,39 0,5318
FLM 70 1 2,8344 1,9956 0,41377
Valid N
(listwise)
70
Sources: analytical data, processed by the author.
The lowest Operating Profit Margin from 70 data
is about 0,01448 it is Sekar Bumi Company on 2011,
and the highest lowest Operating Profit Margin is
0,39181 it is Delta Jakarta company on 2012,the
standard deviation is 0,07534752. The lowest amount
of ROE is about 0.00652 presented by Sierad Produce
Company on 2013,andthe highest amount of ROE is
0.64830 by Multibintang Indonesia Company on
2015 with standard deviation is 0,10252169. The
minimum value of Interest Burden is 0,07935 by
Sierad Produce Company in 2013,and the maximum
value is Delta Jakarta company on 2012 about
1,52983with standard deviation is 0,23308550. The
minimum value of Tax Burden is 0,64612 by
Ultrajaya Milk Industry & Trading Company on
2011,and the maximum value is Akasha Wira
International Company on 2011 about 0,87312 with
standard deviation is 0,05997220. The minimum
value of Total Assets Turnover (TATO) is 0,44771
Tiga Pilar Sejahtera Food Company on 2011,and the
maximum value is Ultrajaya Milk Industry & Trading
Company on 2011 about 2,88274 Wilmar Cahaya
Indonesia company with standard deviation is
0,03366913. The minimum value of Financial
Leverage Multiplier is 1,00000 by Nippon Indosari
Corpindo Company on 2011,and the maximum value
is Tunas Baru Lampung Company on 2013 about
2,83445 Sinar Mas Agro Resources and Technology
company with standard deviation is 0,41377998.
Study Result and discussion.
5.3 The Result of F Test
This analysis is to know there are any causal relations
between independent variable towards dependent
variable. If the value of significant simultaneously is
smaller than 0.05, it hasa relation.Table 3 shows the
result of f-test.
Table 3: F-test
ANOVA
a
Model Sum of
Square
s
Df Mean
Square
F Sig.
1
Regres
sion
0,552 5 0,110 40,6
94
0,000
b
Residu
al
0,174 64 0,003
Total
0,725 69
a. Dependent Variable: ROE
b. Predictors: (Constant), TB, FLM, TATO, IB, OPM
Sources: analytical data SPSS, processed by the author.
From the data above shown us the value of sig.
0.000<0.05 so it is mean that independent variable
simultaneously has significant influence toward
Return on Equity. So Hypothesis 6 is accepted there
are significant simultaneous influences of Financial
leverage multiplier (FLM), Total asset turnover
(TATO), Operating profit margins (OPM), Interest
burden (IB), Tax burden (TB), toward return on
equity (ROE).
Table 4: Coefficient of Determination
Mod
el
R R
Square
Adjusted
R Square
Std. Error
of the
Estimate
Durbin-
Watson
1
0,87
2
a
0,761 0,742 ,052071
7
1,793
a. Predictors: (Constant), TB, FLM, TATO, IB, OPM
b. Dependent Variable: ROE
R
2
= r
2
x 100%
= 0.742x 100%
= 74,2%
ICRI 2018 - International Conference Recent Innovation
2782

Based on Table 4, this means that Financial
Leverage Multiplier (FLM), Total Asset Turnover
(TATO), Operating Profit Margin (OPM), Interest
Burden (IB), and Tax Burden (TB) are
simultaneously influence toward return on equity
about 74,2% while 25,8% return on equity is
influenced by another variable that excludes or not
mentioned in this study.
6 DISCUSSION
From the results of the data analysis, it can be seen
that a variable of Financial Leverage Multiplier (IT),
Total Asset Turnover (TATO), Operating Profit
Margins (OPM), Interest Burden (IB), Tax Burden
(TB), simultaneously have significant influence
toward Return on Equity. Whereas, in a partially,
variable of Financial Leverage Multiplier (IT), Total
Asset Turnover (TATO), Operating Profit Margins
(OPM), Interest Burden (IB) have significant positive
influence toward Return on Equity. Whereas, the
variable tax Burden (TB) have a negative influence
and insignificant toward Return on Equity. The
determination coefficient 74.2% this means 33.06%
dependent variable is Return on Equity (ROE) could
be explained by the independent variable,i.e. IT,
TATO, OPM, IB, TB. While the rest of 25.8%.
Explained by other variables outside of the model that
are not described in this study.
6.1 The Influence of Financial
Leverage Multiplier's Variable
toward Return on Equity
Based on the results of the research that has been
done. The calculation of multiple regression equation,
the results of the test t (partial test) explained that
Financial Leverage Multiplier have significant
positiveinfluence toward Return On Equity. It shows
the H1 stating of the influence of the Financial
Leverage Multiplier toward Return On Equity on the
company's food and Beverage Industry, that is listed
on the Indonesian Stock Exchange Period 2011 -
2015. On a good or stable of the economic condition,
the use of Financial Leverage can provide a positive
influence in the form of an increase in ROE. It
Causesby the rate of return toward the company's
operating profit greater than the burden of the
program. The results of this research are consistent
with research conducted byKharatyan (2016) that
FLM hassignificant positive influence toward ROE.
6.2 The Influence of Total Asset
Turnover’s Variable toward
Return on Equity
Based on the results of the research that has been
done. The calculation of the multiple regression
equation, the results of the test t (partial test)
explained that Total Aset Turnover have positive
significant / influence toward Return On Equity. It
shows the H2 stating the existence of the influence of
the Total Aset Turnover toward Return On Equity on
the company's food and Beverage Industry that is
listed on the Indonesian Stock Exchange Period 2011
-2015 is accepted.
Profits owned by the company, influenced by
TATO of the company. As more and more companies
use its assets, suggesting that asset management
companies are increasingly effective and by itself will
be followed by a rise in profit of the company. The
value of the TATO which has increased during the
years 2011-2015 indicates the company is quite
effective in using funds that invested in assets to
generate revenue. The results of this research are
consistent with research conducted by Animah et al.
(2009) that TATO hassignificant positive influence.
6.3 The Influence of Operating Profit
Margin’s Variable toward Return
on Equity
Based on the results of the research that has been
done. The calculation of multiple regression equation,
the results of the test t (partial test) explained that
Operating Profit Margin positive significant effect/
influence toward Return On Equity. It shows the H3
stating the existence of the influence of the Operating
Profit Magin toward Return On Equity on the
company's food and Beverage Industry that is listed
on the Indonesian Stock Exchange Period 2011 -2015
is accepted.
The results of this study demonstrated the
effectiveness of the cost is getting a good deal.
Operating Profit Margins (OPM) is used to measure
the impact the profitability of the operations toward
the Return on Equity (ROE). Also, Operating Profit
Margin (OPM) used to see an increase or decrease in
performance and the influence of indirect cost against
profits generated. The decreasein cost then operating
profit will be higher which will increase the ROE. So,
the larger the OPM, then the greater the ROE
generated, meaning that the company's performance
isbetter. This is the one that makes a positive
significant influence OPM toward ROE.The results of
this research are consistent with research conducted
The Determinations of Return on Equity in the Food and Beverage Industry in Indonesia Stock Exchange
2783

by Thomas J Liesz and Steven J Maranville.
6.4 The Influence of Interest Burden’s
Variable toward Return on Equity
Based on the results of the research that has been
done. The calculation of multiple regression equation,
the results of the test t (partial test) explained that
Interest Burden’s positive significant effect/
influence toward Return On Equity. It shows the H4
stating the existence of the influence of the Interest
Burden’s toward Return On Equity on the company's
food and Beverage Industry, that is listed on the
Indonesian Stock Exchange Periode 2011 -2015 is
accepted.
In financial management perspective, the Interest
Burden (IB) is another Income divide by Other
Expense (OI/OE). It is measure how much of the
operating income can cover the interest expenses. The
IB is also an EBTdivide by OP. The higher of the
EBT/OP is means,thegreater operating profit because
of other income greater than the burden of others.The
results of this research are consistent with research
conducted by Kusi et al. (2015).
6.5 The Influence of Tax Burden's
Variable toward Return on Equity
Based on the results of the data analysis has been
done. The calculation of multiple regression equation,
the results of the test t (partial test) explained that tax
Burden’s have a negative influence and insignificant
toward Return on Equity. It shows the H5 was
rejected. This study the ratio of the tax burden has no
significant effect on ROE, this is because the
company has short-term corporate debt that is used
for the cost of raw materials and so on. The increase
in interest costs paid by the company will reduce the
amount of tax paid to the government, but the tax
expense paid by the company is insignificant.
7 CONCLUSIONS
The conclusion of this research, as follows: (1)
Partially, Financial Leverage Multiplier toward
Return On Equity on the food and beverage
companies have significant positive influence, (2)
Partially, Total Asset Turnover toward Return On
Equity on the food and beverage companies have
significant positive influence. (3) Partially, Operating
Profit Margin toward Return On Equity on the food
and beverage companies have significant positive
influence.(4) Partially, Interest toward Return On
Equity on the food and beverage companies have
significant positive influence. (5) Partially, the Tax
burden toward Return On Equity on the food and
beverage companies have a negative influence and
insignificant. (6) Simultaneously, Financial Leverage
Multiplier (FLM), Total Asset Turnover (TATO),
Operating Profit Margin (OPM), Interest Burden
(IB), and Tax Burden (TB) toward Return On Equity
on the food and beverage companies have significant
influence.
The suggestions for this research, as follow (1)
For the next researcher is expected to use more
samples of this research so that research results will
be better. (2) For the next researcher is expected to
add to the independent variable. Because there are
still many factors that could affect the dependent
variable, like size (3) For the next researcher not only
on a registered company in Indonesia but also to
compare with other companies in the other country.
(4) In cooperation with subsidiaries to save costs of
raw materials the company so that it can increase
revenue, it also can revive the company with a
consistent price. Based on the results of the research,
conclusions and suggestions that have been presented
before, This research resulted in the conclusions on
the importance of analyzing the financial statements
to assess the financial performance of a company and
where the funds to finance the operational activities
of a company are acquired.
REFERENCES
Afrinda, N. (2013). Analisis Pengaruh Likuiditas dan
Solvabilitas terhadap profitabilitas pada perusahaan
makanan dan minuman yang terdaftar di Bursa Efek
Indonesia (BEI). Palembang. Fakultas Ekonomi
Universitas Sriwijaya.
Animah, A., Sasanti, E. E., and Karina, N. (2009). Pengaruh
Profit Margin, Investment Turnover, Equity Multiplier
terhadap Return on Equity. Jurnal Telaah dan Riset
Akuntansi, 2(2): 165-182.
Brigham, E. F., and Houston, J. F. (2001). Manajemen
Keuangan, 8
th
edition. Jakarta: Erlangga.
Fahmi, I. 2012. Analisis Laporan keuangan. First edition.
Bandung: Alfabeta.
Hamid, A., Kusrina, B. L., and Wardoyo, W. (2016).
Pengaruh Financial Leverage Terhadapreturn On
Equity (ROE) dan Earning Per Share (EPS) Pada Sektor
Industri Dasar Dan Kimia Yang Terdaftar Di Bursa
Efek Indonesia. Benefit: Jurnal Manajemen dan Bisnis,
1(1): 53-63.
Kusi, B. A., Ansah-Adu, K., and Agyei, A. (2015).
Evaluating banking profit performance in Ghana during
ICRI 2018 - International Conference Recent Innovation
2784

and post profit decline: A five step Du-Pont approach.
EMAJ: Emerging Markets Journal, 5(2): 29-40.
Kharatyan, D. (2016). Ratios and indicators that determine
return on equity (Doctoral dissertation). Available at:
https://bibliotecadigital.ipb.pt/bitstream/10198/13313/
1/David%20Kharatyan%20Master%20thesis%20REV
IEWED.pdf
Kumalasari, R., and Widyawati, N. (2016). Pengaruh
Operating Leverage dan Financial Leverage terhadap
Profitabilitas pada Perusahaan Telekomunikasi. Jurnal
Ilmu & Riset Manajemen, 5(5).
Syamsuddin, L. (2007). Manajemen Keuangan
Perusahaan: Konsep Aplikasi dalam Perencanaan,
Pengawasan, dan Pengambilan Keputusan. Jakarta: PT
Raja Grafindo Persada.
Warsono. 2003. Managemen Keuangan Perusahaan, 3rd
edition. Jakarta: Bayu Media.
Zikmund, W. G., Babin, B. J., Carr, J. C., and Griffin, M.
(2013). Business research methods. Cengage Learning.
The Determinations of Return on Equity in the Food and Beverage Industry in Indonesia Stock Exchange
2785

APPENDIX
1. Normality Test
One-Sample Kolmogorov-Smirnov Test
ROE FLM TATO OPM IB TB
N
70 70 70 70 70 70
Normal
Parameters
a,b
Mean
0,17384 1,9956 1,37329 0,11329 0,88104 0,7519707
Std.
Deviation
0,10252 0,41378 0,53181 0,07535 0,23309 0,336691
Most Absolute
0,121 0,052 0,152 0,136 0,15 0,134
Extreme
Differences Positive
0,121 0,037 0,152 0,136 0,136 0,108
Negative
-0,089 -0,052 -0,08 -0,11 -0,15 -0134
Kolmogorov-Smirnov Z
1,011 0,434 1,271 1,139 1,259 1,119
Asymp. Sig. (2-tailed)
0,258 0,992 0,079 0,149 0,084 0,163
Test distribution is Normal.
2. Multicollinearity test
Coefficients
a
Model
Unstandardized
Coefficients
Standardized
Coefficients
t Sig.
Collinearity Statistics
B
Std.
Error
Beta Tolerance VIF
1
(Constant) -0,526 0,147 -3,587 0,001
FLM 0,092 0,019 0,370 4,926 0,000 0,664 1,507
TATO 0,085 0,015 0,443 5,629 0,000 0,604 1,656
OPM 1,320 0,113 0,970 11,699 0,000 0,544 1,839
IB 0,126 0,033 0,287 3,792 0,000 0,652 1,534
TB 0,184 0,195 0,060 0,943 0,349 0,910 1,098
Dependent Variable: ROE
Sources: analytical data, processed by the author.
Model Summary
3. Autocorellation test
Model R R Square Adjusted R
Square
Std. Error of the Estimate Durbin-Watson
1
0,872
a
0,761 0,742 0,05207174 1,793
ICRI 2018 - International Conference Recent Innovation
2786
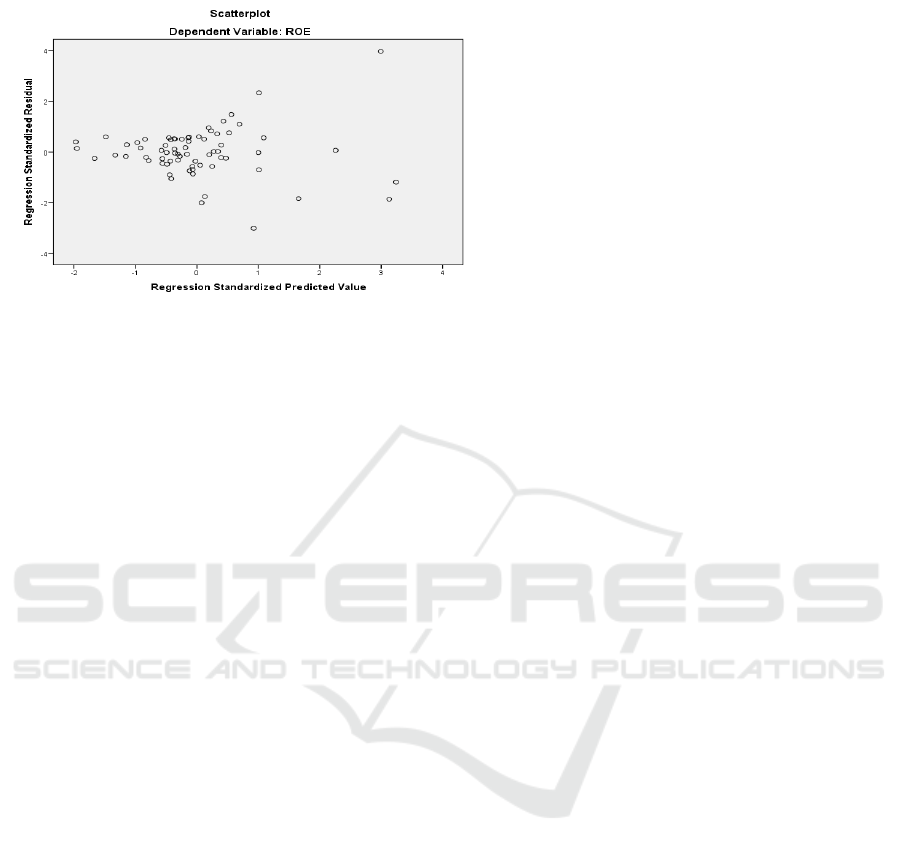
4. Heteroscedasticity Test
The Determinations of Return on Equity in the Food and Beverage Industry in Indonesia Stock Exchange
2787
