
Implementation of Activity based Costing System in Real Price
Calculation of Cost of Goods Manufactured for the Determination of
the Selling Pricing for Start-up Business: Fruit Combining
C. Susi Maryanti
1
, Roesfiansjah Rasjidin
1
, Semerdanta Pusaka
1
and Arief Kusuma Among Praja
2
1
Faculty of Economics and Business, Esa Unggul University – Jakarta
2
Faculty of Technique, Esa Unggul University – Jakarta
Keywords: Activity Based Costing System, Cost of Goods Manufactured, Determination of The Selling Pricing
Abstract: This study discusses the relationship between the activity based costing system as the dependent variable in
the actual cost calculation of fruit combining product and the determination of the selling price as the
independent variable. The research method used is descriptive analytic research method, that is research
done by collecting data of cost incurred at a start-up business, so as to give description about the assumption
of situation of the start-up business, whether the start-up business correctly classify cost. It also carries the
cost of data analysis so as to produce a more precise cost and selling price calculation of fruit combining
product. Then, from analysing the conclusions and suggestions drawn. The results show that the start-up
business has classified the cost incurred by the right party. In addition, the start-up business has calculated
the product cost correctly because it charges the cost of each product. This product cost calculation resulted
in the start-up business having a correct selling price base. The start-up business sets the selling price by
marking up enough to cover production costs. Calculations using an activity-based costing system can result
in more precise production costs that can be a good basis for determining product selling prices.
1 INTRODUCTION
Price competition, quality, and so make some
companies must fix various aspects in the company
to be able to face the competition. Companies are
always required to be able to take the right decisions
for the company to survive in the business world.
Companies need excellence in the face of intense
competition in the industry. Increased competition in
similar industries causes the market for the industry
to be price sensitive, where a relatively small
increase or decrease in price can result in a
significant impact on sales. Therefore, the selling
price is one of the most important factors to survive
in the industry. To be able to achieve excellence, the
company must be able to calculate the selling price
correctly. The selling price should not be too low to
cover all costs incurred by the company and provide
the desired profit, nor should it be too high for the
company to compete with its competitors.
The company can set the selling price correctly if
the company can calculate the cost of the product
properly so that the product is not overcosted and
not undercosted (charged less than it should). PT
Redceri Indonesia as one of the startup companies
will implement Activity-based costing system.
Activity-Based Costing (ABC) has a more
comprehensive cost-tracking implementation than
traditional cost accounting (Martusa et al., 2010). PT
Redceri Indonesi determines the cost of the product
using Activity-based costing system to help set the
selling price correctly.
Research conducted on PT Redceri Indonesia
which produces and sells Redceri Pure Fruit Jelly.
The company produces goods on a regular basis
with the capacity of PT Redceri Indonesia
amounting to 61,440 Redceri Pure Fruit Jelly / day
products with 5 working days per week for non-shift
working time. The number of workers in PT Redceri
Indonesia is 40 people. PT Redceri Indonesia
products are Redceri Orange and Redceri Carica.
Selling price is an important thing to be
consideration of buyers of the company's products
considering the situation of competition in Indonesia
is quite tight. Even small price changes will have a
huge impact on sales in large quantities. If there is
an error in determining the selling price then the
company can lose in large amount. Increased
2706
Maryanti, C., Rasjidin, R., Pusaka, S. and Kusuma Among Praja, A.
Implementation of Activity based Costing System in Real Price Calculation of Cost of Goods Manufactured for the Determination of the Selling Pricing for Start-up Business: Fruit Combining.
DOI: 10.5220/0009951127062712
In Proceedings of the 1st International Conference on Recent Innovations (ICRI 2018), pages 2706-2712
ISBN: 978-989-758-458-9
Copyright
c
2020 by SCITEPRESS – Science and Technology Publications, Lda. All rights reserved
competition in this industry, requires the company to
have the advantage to be able to keep his life and
enlarge his business. For that, the company must be
able to set a reasonable selling price by stipulating
the cost of the product properly. The cost of the
products discussed in this research is full costing so
as to cover production and non-production costs.
The main purpose in establishing a company is to
get the optimal profit to maintain the company's
survival. The main source of company revenue is
usually derived from the sale of products, both
goods and services that the amount can be measured
by loading to the buyer. The company must set a
reasonable price to earn a substantial income. In
determining the reasonable selling price, the
company needs to get information about the cost of
the product accurately because the information can
have an effect in the decision making process.
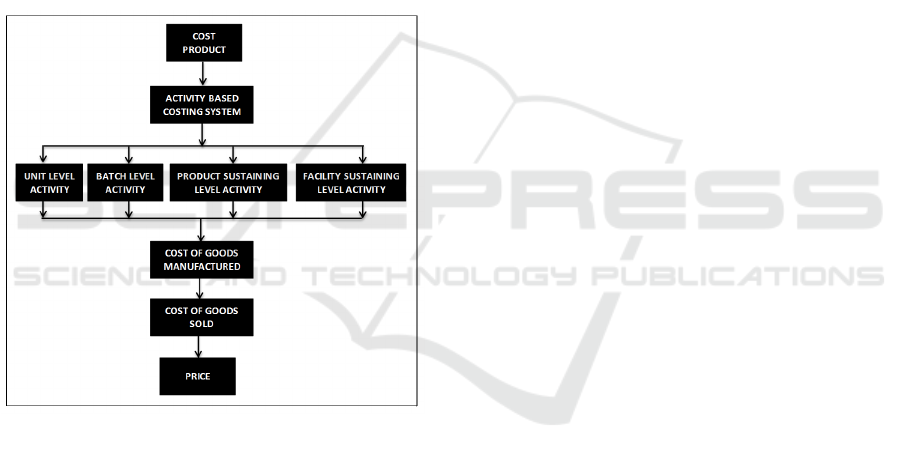
Figure 1. Chart of Framework
2 COST OF GOODS
According to Hilton (2005) defines the cost of the
product as follows:
"The total cost of direct material, direct labor, and
manufacturing overhead transferred from work-in-
process inventory to finished-goods inventory."
Hariadi (2002) put forward the concept of
different cost for different purposes. This concept
underlies the meaning of cost of goods, that is,
depends on what interests the management uses the
information. On the basis of the traditional concept
intended for the purposes of the preparation of
financial statements states that the so-called cost of a
product only includes the cost of raw materials,
direct labour costs, and factory overhead costs.
Meanwhile, on the basis of contemporary concepts,
for the interests of tactical operational management,
the meaning of the cost of a product is in addition to
covering traditional production costs also includes
marketing costs and service costs to consumers.
According to Mulyadi (2001), the cost of
products can be calculated by two approaches,
namely by using full costing and variable costing.
Full Costing is a method of determining the cost
of production which takes into account all the
elements of production cost into the cost of
production, which consists of raw material costs,
direct labour costs, and factory overhead costs, both
of which behave as well as variable. The cost of the
products calculated by the full costing approach
consists of the elements of cost of production (raw
material costs, direct labour costs, variable factory
overhead costs, and fixed factory overhead costs)
plus non-production costs (marketing costs,
administrative costs and general)
Variable Costing is method of determining the
cost of production that only takes into account the
cost of production that behaves variable into the cost
of production, which consists of raw material costs,
direct labour costs, and variable factory overhead
costs. The cost of the product calculated by the
variable costing approach consists of elements of the
cost of production of variables (raw material costs,
direct labour costs, and variable factory overhead
costs) plus variable non-production costs (variable
marketing costs, administrative costs and general
variables) And fixed costs (fixed factory overhead
costs, fixed marketing costs, general administrative
and fixed costs).
The cost of the product is set when, according to
Hansen and Mowen (2006) actual costing: An actual
cost system use actual costs for direct materials,
direct (manufacturing) labour, and (manufacturing)
overhead. These actual costs are then used to
determined the unit cost.According to Horngren et
al. (2006) actual costing: A costing system that
traces direct costs to a cost object by using the
actual direct-cost rates times the actual quantities of
the direct- cost inputs. In actual costing, the cost of
the product is calculated at the end after the finished
product is made because the actual cost is incurred
to make the new product known after the finished
product is made. The goal is to calculate the actual
resources used / consumed to produce a particular
product.
According to Horngren et al. (2006) normal
costing: Normal costing is a costing method that
Implementation of Activity based Costing System in Real Price Calculation of Cost of Goods Manufactured for the Determination of the
Selling Pricing for Start-up Business: Fruit Combining
2707

traces direct costs to a cost object by using the
actual direct-cost inputs, and allocates indirect costs
based on the budgeted indirect-cost rates times the
actual quantity of the cost-allocation bases. The
difficulty of calculating actual (actual) cost of fees
per week or even per month makes the new
company able to calculate the cost at the end of the
year. This may result in the information being
delayed. To overcome the delay, the normal costing
of product cost is determined when the finished
product is made, not waiting until the end of the year
due to the indirect cost of the magnitude can not be
known then for the calculation of the cost of goods
used indirect cost tariff budgeted by the company
management. How to calculate it is by dividing the
indirect cost budgeted per year by the basic quantity
of budgeted allocations per year.
The process of indirect cost charging on the
product can use 2 approaches, that is with traditional
system and Activity-based Costing system.In
traditional cost systems, the cost drivers used are
based only on a unit basis or are called unit-level
activity drivers. The trigger of the unit's basic
activity is the factors that cause the cost changes
when the number of units generated changes. The
use of these cost drivers in charging the overhead
costs of the product means that the overhead has a
very close correlation with the number of units
produced. So far, there are three gradual levels that
have been practiced in the cost system to charge
overhead costs on products: (1) Single rate
applicable to entire factory; (2) Some different rates
apply to each department; (3) Implementation of the
ABC system by using different tariffs applicable to
each activity
The limitation of traditional basic cost
calculation, that is can cause distortion overhead
loading. This is because the proportion of overhead
costs unrelated to the number of units over total
overhead is significant, and the type of product
produced varies greatly (Hariadi, 2002).
3 ACTIVITY-BASED COSTING
SYSTEM (ABC)
Garrison and Noreen (2003: 96) define Activity-
based costing system (ABC) as follows:
"A costing method that is designed to provide
managers with cost information for strategic and
other decisions that potentially affect capacity and
therefore "fixed" costs"
The essence of Activity-based costing system (ABC)
revealed by Mulyadi (2001), namely in generating
cost object (product or service), resources issued by
the company in the form of costs based on activities
undertaken by the company.
PT Redceri Indonesia calculates the cost of
production per unit with ABC (Activity Based
Costing) system. In the traditional cost system
charging costs on production costs (Raw Material
Cost, Direct labour costs and Factory Overhead
Cost). The production cost component of ABC
system is almost the same as traditional system, but
in ABC Factory Overhead Cost search is more
accurate.
Overhead budget is a budget that plans costs in
the factory issued by the company in the course of
the production process except for direct raw material
costs and direct labour. This budget is useful as a
basis for preparing the cost of goods manufactured
budget, the cost of goods sold and the cash budget.
The benefits of this budget are to know the cost of
use more efficiently, to determine the cost of the
product more precisely, to know the allocation of
factory overhead cost in accordance with the place
(department) where the cost is charged and as a
control tool overhead factory cost.
PT Redceri Indonesia created a Factory
Overhead Cost budget with Activity Based Costing
System (ABC System). This is because the ABC
system based on activities that use cost drivers more
than the traditional system. Using the ABC system
allows management to make cost savings by
eliminating non value-added activities. An error in
charging a product will result in over costing or
under costing resulting in an error in decision
making.
The stages of preparing the Factory Overhead
Cost Budget of PT Redceri Indonesia with ABC
System begins with the process of identifying
activities. The identification of activities requires
that there be a list of the types of jobs within the
company related to the production process. Then
charge the activities. Each time an activity is set, the
cost of implementing the activity is determined.
The next step is to determine the activity driver
for each activity that is the controlling factor of the
activities and determine the tariff and charge the
product. In determining this rate, the total cost of
each activity is divided by the total activity of the
driver used for the activity. The next step is to
multiply the rate obtained for each activity with the
driver activity consumed by each type of product
produced and then divide by the number of units
produced for each product.
ICRI 2018 - International Conference Recent Innovation
2708
Unit-level activities are activities that are done
every time a unit of product is produced, the size of
this activity is influenced by the number of units
produced. For example, direct power, machine
clock, and electrical clock (energy) are used every
time a unit of product is produced.
Batch-level activities are activities performed
each time a product batch is produced, the size of the
activity is affected by the number of batches of
manufactured products. Examples of activities
included in this group are setup activities,
production scheduling activities, material
management activities (material movement and
purchase orders), inspection activities.
Product-level activities are activities undertaken
to support the various products produced by the
company. This activity consumes input to develop
the product or enable the product to be produced and
sold. Examples of activities included in this group
are product research and development activities,
process engineering, product specifications,
engineering changes, and product upgrades.
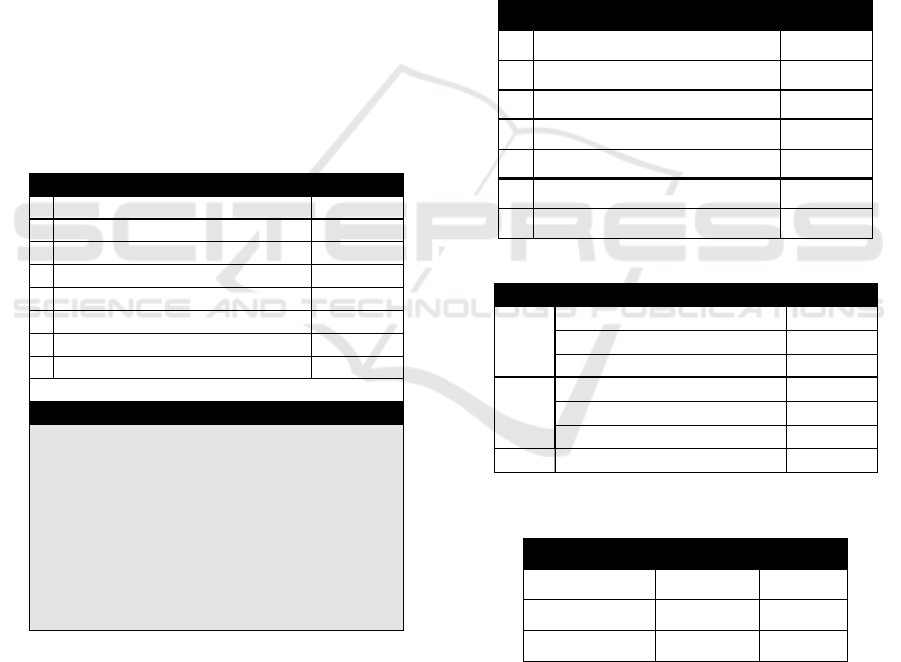
Table 1. Factory Overhead Cost &Calculation Assumption
Facility-level activities include activities to
support general manufacturing processes that are
required to provide facilities or plant capacity to
produce products but many of these activities are not
related to the volume or mix of manufactured
products. Examples of these activities include for
example: plant management, building maintenance,
security, landscaping, factory lighting, hygiene, land
and building tax, and factory depreciation.
Cost Pool is a group of costs caused by activity
along with a cost driver basis. Cost pool is useful to
determine the cost pool rate which is the factory
overhead cost per unit cost driver calculated for each
activity group. The group rate is calculated by the
formula of total overhead for a given activity group
divided by the basis of the group's activity
measurement.
Cost drivers or cost drivers are used to charge
activity costs to outputs that are structurally different
from those used in conventional cost systems. Or
causal factors that explain overhead consumption.
Cost drivers are the basis used to charge the costs
accumulated on the cost pool to the product.
Table 2. Identification of Factory Overhead
Cost Into Activity Category
Table 3. Production Cost Activity
Table 4. Allocation of Calculation of Activity Based
Costing System (ABC)
4 BUDGET COST OF GOODS
MANUFACTURED
The cost of production calculated for a certain
period of time is useful for management to establish
No. CostType Amount
1 IndirectLaborCost 659.600.000
2 BuildingRentCo st 200.000.000
3DepreciationCost 232.068.500
4 ElectricityFactoryCost 142.349.460
5Fuel&GasCo st 5.628.493
6 Maintenance&Sparepart 7.415.000
7OtherOverheadCost 60.000.000
TOTAL 1.307.061.453
Assumption
Installedcapacity(cup/hour) 9600
Capacityusedfromins talled 80%
Weekdayspermonth(days) 22
Workinghoursperday(hours) 8
THRfrommonthlysalaryvalue 100%
Maximumbonusfromsalaryvaluepermonth 400%
Cos t
ofbuildingrentalperyear 200.000.000Rp
OtherOverheadCost/mon th 5.000.000Rp
No. CostDriver
1 IndirectLabor UnitLevel
2FactoryElectricity UnitLevel
3Fuel&gas UnitLevel
4 Maintenance&Sparepart BatchLevel
5OtherFactoryOverhead BatchLevel
6 Building RentCost FacilityLevel
7DepreciationCos tofMachinery&Equipmen
t
FacilityLevel
FactoryOverheadCost
CostPool CostDriver
I IndirectLa bor Tota lProdu ction
Maintenance&Sparepart TotalProd u ction
OtherFactoryOverhead TotalProd u ction
II Factor yElectricity MachineHours
Fuel&gas M achineHours
DepreciationCostofMachinery&Equipmen
t
MachineHours
III BuildingRentCost FacilityLevel
Typ eofFactoryOverh eadCost
RedceriOrange RedceriCarica
TotalProduction(unit) 10,493,036.00 6,995,357.00
MachineHours(Hours) 1,267.20 844.80
SquareArea(M2) 303.60 202.40
Description
Implementation of Activity based Costing System in Real Price Calculation of Cost of Goods Manufactured for the Determination of the
Selling Pricing for Start-up Business: Fruit Combining
2709
the selling price of the product. Estimated
production cost information per unit to be issued to
produce the product within a certain period of time
can be used as a basis for determining the selling
price per unit of product to be charged to the buyer.
In determining the selling price of the product,
production cost per unit is one of the information
considered in addition to other cost information as
well as non-fee information.
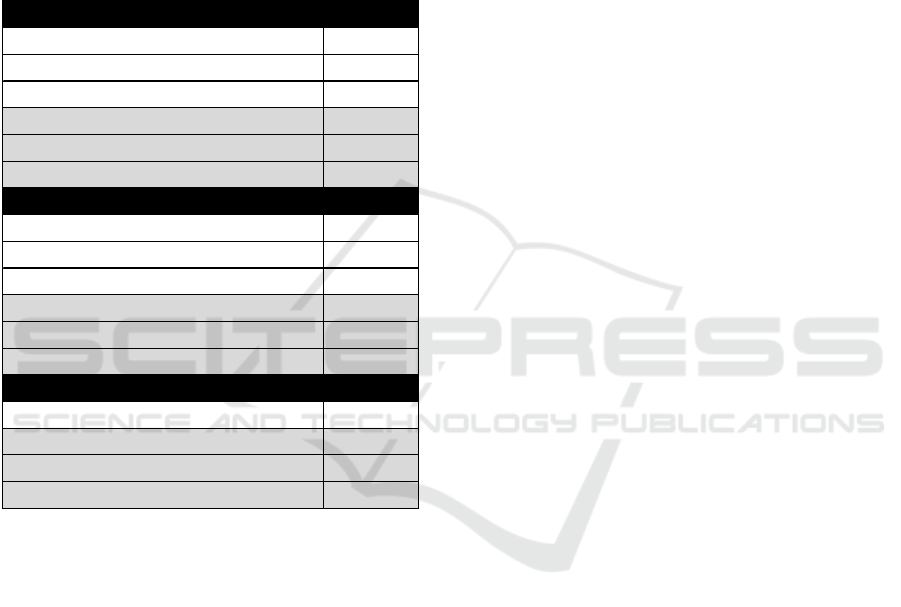
Table 5. Factory Overhead Rates
With Activity Based Costing System (ABC)
In addition, Cost of Goods Manufactured is
useful to monitor the realization of production costs.
Management requires information on actual
production costs incurred in the implementation of
the production plan. This information is useful to
monitor whether the production process consumes
the total cost of production in accordance with the
previous calculation.
Cost of Goods Manufactured is also useful for
calculating the company's profit and loss.
Management requires information on production
costs that have been incurred to produce the product
within a certain period. This information is useful to
know whether the production and marketing
activities within a certain period able to generate
gross profit or even result in gross loss.
The cost of goods manufactured also determines
the cost of the inventory of the finished product and
the product in the process presented in the balance
sheet. When management makes periodic financial
accountability, management must present financial
statements in the form of a balance sheet and income
statement. In the balance sheet, management should
present the cost of the inventory of the finished
product and the cost of the product at which the
balance sheet is still in process.
PT Redceri Indonesia calculates the cost of
production per unit with ABC (Activity Based
Costing) system. In the traditional cost system
charging costs on production costs (Raw Material,
direct Labour, Factory Overhead). The production
cost component of ABC system is almost the same
as traditional system, but in ABC Factory Overhead
Cost search is more accurate.
From the calculation of cost of goods
manufacture for Redceri Orange then obtained the
total production cost of Rp19,004,352,914.11. With
the number of products produced for 10,493,036
units, the cost of production per unit is Rp1,811.14.
As for the cost of production Redceri Carica
obtained total production costs of
Rp12,186,899,232.84. With the number of products
produced amounted to 6.995,357 units, the cost of
production per unit is Rp1,742.14.
5 PROJECTED COST OF GOODS
SOLD
In determining the cost of goods sold, the
conventional cost accounting system is no longer
appropriate to be applied in today's modern
technological era. Because this system has several
weaknesses. Among them is providing distorted cost
information. Distortions arise because of
inaccuracies in charging costs, resulting in costing,
decision-making, planning, and control errors. The
distortion also results in under cost / over cost of the
product (Hansen & Mowen, 2004). The existence of
various weaknesses can be overcome by the use of
Activity-Based Costing method.
Companies can use Activity Based Costing
(ABC) system to analyse activities. The
implementation of ABC is an innovation, one of
which is to reduce non value-adding activities, add
value to products / services to be produced, and
eliminate activities that are not in accordance with
the wishes of customers or who do not create added
value. Activity Based Costing is a costing pricing
method that tracks costs to activities, then to
products. The main difference between the cost of
product costing between conventional cost
IndirectLabor 659.600.000
Maintenance&Sparepart 7.415.000
OtherFactoryOverhead 60.000.000
TotalCost(Rp) 727.015.000
TotalProduction(Unit) 17.488.393
FactoryOverheadCostRates‐CostPoolI(Rp) 41,57
FactoryElectricity 142.349.460
Fuel&gas 5.628.493
Depreci a tionCos tofMachinery&Equipment 232.068.500
TotalCost(Rp) 380.046.453
MachineHours(Hours) 2.112
FactoryOverheadCostRates‐CostPoolII(Rp) 179.946,24
Bui ldingRentCost 200.000.000
TotalCost(Rp) 200.000.000
SquareArea(M2) 506,00
FactoryOverheadCostRates‐CostPoolIII(Rp
)
395.256,92
CostPoolI
CostPoolII
CostPoolIII
ICRI 2018 - International Conference Recent Innovation
2710
accounting and ABC is the amount of cost drivers
used in the ABC method more than in conventional
cost accounting systems.
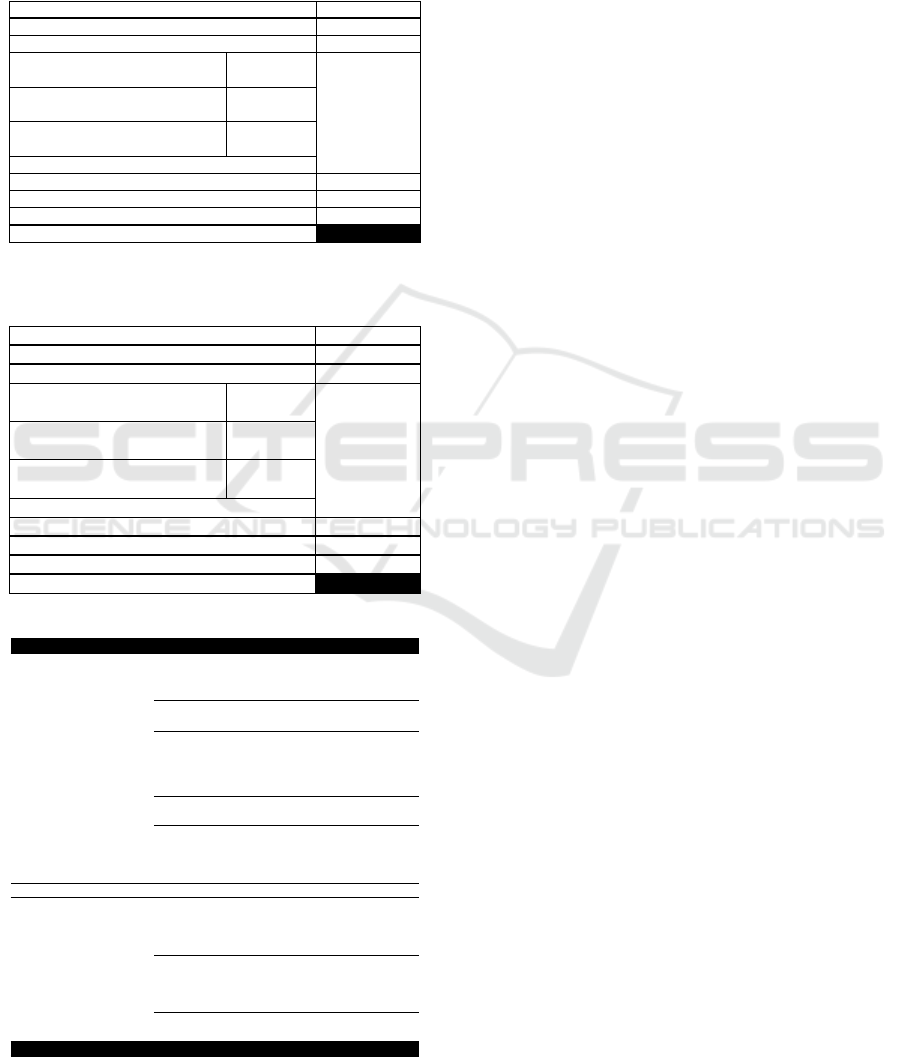
Table 6. Calculation of Cost of Goods Manufactured per
Unit with Activity Based Costing System (ABC) For
Redceri Orange
Table 7. Calculation of Cost of Goods Manufactured per
Unit with Activity Based Costing System (ABC) for
Redceri Carica
Table 8. Projected Cost of Goods Sold Y0-Y5
Companies can use Activity Based Costing
(ABC) system to analyse activities. The
implementation of ABC is an innovation, one of
which is to reduce non value-adding activities, add
value to products / services to be produced, and
eliminate activities that are not in accordance with
the wishes of customers or who do not create added
value.
More accurate per-unit pricing is important for
management as a basis for decision-making.
Management can be made easier in making
decisions, among others in determining the selling
price, considering refusing or accepting an order,
monitoring the realization of costs, calculating the
profit / loss of each order and determining the cost
of the finished product and product inventory in the
process to be presented on the balance sheet.
Determination of cost of goods sold in industrial
companies, generally on the initial inventory of
finished products coupled with the amount of
production price (cost of goods manufactured) and
reduced by the end product inventory. So the notion
of cost of goods sold, based on Accounting
Principles Indonesia explains that the beginning
balance of inventory plus the cost of goods
purchased for sale, minus the final inventory
amount. For industrial enterprises in cost of goods
sold including all direct wages and materials costs
plus all factory costs (production) is not directly
corrected by the number of beginning and ending
inventory balances.
The calculation of cost of goods sold can not be
separated from the total cost of raw materials, direct
labour, and overhead. However, excludes counting
of operational costs such as marketing,
administration and general costs. Cost of goods sold
also involves all costs used for employee wages and
the cost of direct production materials and indirect
factory production costs.
Cost of goods sold has three basic structural
elements: (1) Inventory; (2) direct labour costs; (3)
Overhead (overhead cost). The inventory element
includes raw materials inventory, work in process
inventory or WIP and stock of finished goods
(inventory).
The company uses Activity Based Costing
(ABC) system to analyse the activity. From the pre-
made budget planning covering the sales budget,
production budget, raw material budget, indirect
labour budget, factory overhead budget and cost of
product cost for each product type, it can be
projected cost of goods sold (cost of goods sold) As
in Table 8.
RawMaterialCost(Rp) 18.029.163.394,99
DirectLaborCost(Rp) 190.952.639,00
FactoryOverheadCost:
CostPoolI
41,57Rp x 10.493.036 un it 436.209.008,31
CostPoolII
179.946,24Rp x1.267 jam 228.027.871,80
CostPoolII
395.256,92Rp x304 M2 120.000.000,00
TotalofFactoryOverheadCost(Rp) 784.236.880,11
TotalofProductionCost(Rp) 19.004.352.914,11
TotalofProductsManufactured(Units) 10.493.036,00
CostofGoodsManufacturedPer
Unit(Rp) 1.811,14
RawMaterialCost(Rp) 11.549.503.079,95
DirectLaborCost(Rp) 114.571.5 80,00
FactoryOverheadCost:
CostPoolI
41,57Rp x 6.995.357 unit 290.805.991,69
CostPoolII
179.946,24Rp x 845 jam 152.018.581,20
CostPoolII
395.256,92Rp x 202 M2 80.000.000,00
TotalofFactoryOverheadCost(Rp) 522.824.572,89
TotalofProductionCost(Rp) 12.186.8 99.232,84
TotalofProductsManufactured(Units) 6.995.357,00
CostofGoodsManufacturedPer
Unit(Rp) 1.742,14
NO Y0 Y1 Y2 Y3 Y4 Y5
IRAWMATERIAL
InitialSuppliesof RawMaterials ‐ ‐ ‐ ‐ ‐ ‐
PurchaseofRawMaterials 24.744.032.817 27.583.688.314 33.762.434.496 43.047.103.983 57.080.459.881 75.688.689.490
Total RawMaterial 24.744.032.817 27.583.688.314 33.762.434.496 43.047.103.983 57.080.459.881 75.688.689.490
FinalInventoryofRawMaterials ‐ ‐ ‐ ‐ ‐ ‐
UsedRawMaterials 24.744.032.817 27.583.688.314 33.762.434.496 43.047.103.983 57.080.459.881 75.688.689.490
II AUXILIARY
InitialSuppliesof Auxiliary ‐ ‐ ‐ ‐ ‐ ‐
PurchaseofAuxiliary 4.834.633.658 5.389.462.138 6.467.354.565 8.084.193.207 10.509.451.169 13.662.286.463
Total Auxiliary 4.834.633.658 5.389.462.138 6.467.354.565 8.084.193.207 10.509.451.169 13.662.286.463
FinalInventoryofAuxiliary ‐ ‐ ‐ ‐ ‐ ‐
UsedAuxiliary 4.834.633. 658 5.389.462.138 6.467.354.565 8.084.193.207 10.509.451.169 13.662.286.463
III DIRECTLABOR 305.524.219 360.621.055 432.745.266 540.931.583 703.211.058 914.174.371
IV FACTORYOVERHEADCOST 1.307.061.453 1.471.346.342 1.765.615.611 2.207.019.513 2.869.125.367 3.729.862.962
TOTALPRODUCTIONCOST(I+II
+III+IV) 31.191.252.147 34.805.117.849 42.428.149.939 53.879.248.286 71.162.247.475 93.995.013.286
VWORKINPROCESS
InitialInventoryofWorkInProcess ‐ ‐ ‐ ‐ ‐ ‐
FinalInventoryofWorkInProcess ‐ ‐ ‐ ‐ ‐ ‐
Invent oryofWorkInProcess ‐ ‐ ‐ ‐ ‐ ‐
VI FINISHEDGOODS
InitialInventoryofFinis hedGoods ‐ 112.828 530.920 637.104 796.380 1.035.294
FinalInventoryofFi nishedGoods 112.828 530.920 637.104 796.380 1.035.294 1.345.882
Invent oryofFinishedGoods 112.828 643.748 1.168.024 1.433.484 1.831.674 2.381.176
COSTOFGOODSSOLD 31.191.364.975 34.805.761.597 42.429.317.963 53.880.681.770 71.164.079.149 93.997.394.462
KETERANGAN
Implementation of Activity based Costing System in Real Price Calculation of Cost of Goods Manufactured for the Determination of the
Selling Pricing for Start-up Business: Fruit Combining
2711
6 PRICE DETERMINATION
Companies generally specify the goods and
services they offer based on the cost of goods sold.
Companies can be specific to know how much the
right price to be charged to the buyer.
Based on calculations performed with Activity
Based Costing (ABC) system, PT Redceri Indonesia
can determine the Factory SellPrice to Distributor of
Redceri Orange is Rp4,055.91 with profit 17% from
total cost and Factory SellPrice to Distributor of
Redceri Carica is Rp 4,057.31 with profit 19.35%
from total cost.
The Factory Sell Price to Retailer of Redceri
Orange is Rp4,583.17 with profit 32.21% from total
cost and Factory Sell Price to Retailer of Redceri
Carica is Rp 4,584.76 with profit 34.86% from total
cost.Selling price of PT Redceri Indonesia’s product
can be seen in table 9.
Table 9. Price Determination
7 CONCLUSION
Product cost calculation resulted in the start-up
business having a correct selling price base. The
start-up business sets the selling price by marking up
enough to cover production costs. Calculations using
an activity-based costing system can result in more
precise production costs that can be a good basis for
determining product selling prices. To set an
appropriate selling price, mark the right to consider
the competitive situation and the purchasing power
of the customer.
Conventional cost systems are less able to meet
management needs in an accurate product cost
calculation, especially when it involves substantial
indirect production costs and product diversity. This
results in improper decision making by the
management in relation to pricing.
Implementation of Activity Based Costing
System in real price calculation of Cost of Goods
Manufactured also helps the company to know
which products are more profitable, so it becomes a
consideration to determine which products will be
maintained and which are not. Redceri Carica is
more profitable than Redceri Orange.
REFERENCES
Garrison, R. H., dan E. W. Noreen (2003). Managerial
Accounting. 10th Edition. New York: McGraw Hill,
Inc.
Hansen, D. R., dan M. M. Mowen (2006). 7th Edition.
Management Accounting. Thomson: Southwestern
Publishing, Co.
Hariadi, B. (2002). Edisi 1. Akuntansi Manajemen: Suatu
Sudut Pandang. Yogyakarta: BPFE
Hilton, R. W. (2005). International Edition. Managerial
Accounting. New York: McGraw Hill, Inc.
Horngren, C. T.; G. Foster, dan S. M. Datar (2006). 12th
Edition. Cost Accounting: Managerial Emphasis. New
Jersey: Prentice Hall, Inc.
Martusa, R., S. R. Darma, dan V. Carolina. 2010. Peranan
Metode Activity Based Costing dalam Menentukan
Cost of Goods Manufactured. Akurat Jurnal Ilmiah
Akuntansi, Nomor 02 Tahun ke-1 Bulan Mei-Agustus,
Hal. 39-60.
Mulyadi. (2001). Edisi 3. Akuntansi Manajemen:
Konsep, Manfaat, dan Rekayasa. Jakarta: Salemba
Empat.
DESCRIPTION REDCERI REDCERI
ORANGE CARICA
Cost:
RawMaterial 1.442,30 1.373,76
Auxiliaries 275,90 277,26
Directlabor 18,20 16,38
FactoryOverheadCost 74,74 74,74
MarketingExpenses 1.306,58 1.306,58
Adm in&GeneralExpenses 74,71 74,71
Depreci ationofOfficeSupplies 94,20 94,20
Inter est 82,73 84,63
IncomeTax 97,22 97,22
TotalCost: 3.466,59 3.399,49
Profit17%and19.35% 589,32 657,82
FactorySalePricetoDistribut or 4.055,91 4.057,31
Profit32.21%and34.86% 1.116,59 1.185,28
Factory
SalePricetoRetailer 4.583,17 4.584,76
Profit32.21%and34.86% 1.116,59 1.185,28
FactorySalePricetoSchool&Hospital 4.583,17 4.584,77
ICRI 2018 - International Conference Recent Innovation
2712
