
Developing a Measure of Students’ Satisfaction with a
Supervisor
Regina Navira Pratiwi
1
, Aisyah Ratnaningtyas
1
, Yeny Duriana Wijaya
1
, Novendawati
1
and Wahyu
Sitasari
1
1
Faculty of Psychology, Esa Unggul University, Jl. Arjuna Utara No.9, Duri Kepa, Kb. Jeruk, Jakarta - Indonesia
Keywords: Students, satisfaction, the social exchange theory, cost, reward, comparison,
interpersonal relationship.
Abstract: Researchers and public institutions alike have demonstrated an increased interest in assessing the quality
of
students, supervision and their satisfaction with it: Researchers have attempted to investigate the
possible
predicting variables of students’ satisfaction with their supervision and its outcomes for
students’
accomplishments and overall life satisfaction. The measurement used for the satisfaction of the academic
supervisor
using the construct of interdependence theory which is part of the social exchange theory that
discussed the cost
and
reward in such a relationship. In this measure, we took three dimensions of this
interdependence theory,
namely
costs, rewards, and the comparison level. Thirty-two participants
participated in this study, convenience
methods
used for sample selection. The findings of the present study
support the hypothesis based on
Interdependence
Theory. Validity and reliability of the scale were
successfully tested as well. Thus, we may conclude that
the
new approach to the measurement of
satisfaction with the relationship with an academic advisor may be
established.
The final result from the
measurement is 16 items have good validity, and 3 constructs showed good
reliability.
1 INTRODUCTION
In recent years researchers and public institutions
alike have demonstrated an increased interest in
assessing
t
h
e
quality of students’ supervision and
their satisfaction with it: Researchers have attempted
to investigate the possib
le
predicting variables of
students’ satisfaction with their supervision and its
outcomes for students’
acc
omplishm
e
nts and overall
life satisfaction (e.g. Armstrong, 2004; Bordia et al.,
2010; Mori, Inman, & Caskie, 2009; Pyh
ält
ö,
Vekkaila, & Keskinen, 2015), while universities
have been developing and applying distinct
assessment scales
i
n order to evaluate and improve
the quality of academic supervision (e.g.
Morningside College Advising Assessm
e
n
t
Instrument; Advisor Assessment Instrument of UNC
Charlotte, original version: Szymanska, 2011). The
rise of attention toward the issue of students’
supervision is not surprising since choosing an
academic advisor can be
a
n important part of many
students’ studies as their academic achievements
can heavily depend on the quality
a
nd quantity of
contact with their supervisors (e.g. Armstrong,
2004; Garcia, Mallot, & Brethower, 1988).
Mor
e
ov
e
r, satisfying relationships with one’s
supervisor were found to be associated with lower
levels of stress
e
xper
ie
nced by students during their
studies (e.g. Kenneth, 2016) and lower rates of
students’ dropout from universities (e.g. Soria,
2012).
Despite many existing studies that are dedicated
to the subject, there are few universal and reliable
measures of students’ satisfaction with their
supervision. For instance, up to this day most of the
researchers have focused on
t
he supervision of
counseling psychology students, using in their
studies highly specific measures that had often b
ee
n
adapted from the measures of employees’
satisfaction with their work supervision or clients’
satisfaction with
t
h
ei
r therapy/counseling outcomes;
the examples of such measures include the Working
Alliance Inven
t
ory-Sup
e
rv
i
s
ee
(WAI-S; original
version: Baker, 1991), the Supervision Feedback
Form (SFF; original version: Williams, 1994), and
the Supervision Outcomes Survey (SOS; original
version: Worthen & Dougher, 2000). While the
li
s
te
d measures proved to be reliable tools in
assessing the satisfaction with supervision of
counseling psy
c
hology students, their specificity
does not allow them to be applied to a broader
sample of students. At the same time,
t
h
e
Pratiwi, R., Ratnaningtyas, A., Wijaya, Y., Novendawati, . and Sitasari, W.
Developing a Measure of Students’ Satisfaction with a Supervisor.
DOI: 10.5220/0009950631593166
In Proceedings of the 1st International Conference on Recent Innovations (ICRI 2018), pages 3159-3166
ISBN: 978-989-758-458-9
Copyright
c
2020 by SCITEPRESS – Science and Technology Publications, Lda. All rights reserved
3159

researchers who were interested in more diverse
samples of students generally administered to
participants shor
t
scales that included only a few
items measuring students’ overall satisfaction with
their supervision (e.g. one
ite
m measure “I am
satisfied with the advising I received” in Arnold,
Fisher, & Glover, 1998; one item measure “I am
satisfied with my relationship with my advisor”
in Tenenbaum, Crosby, & Gliner, 2001). Even
though such measures were found to be as an easy
and relatively reliable method of inferring the
general level of s
t
uden
t
s’ satisfaction with their
academic supervision, they did not fully reflect the
complexity of the measured ph
e
nomenon and, thus,
were only suitable for providing its general
estimation. Moreover, since such measures assess
m
a
ny possible dimensions of supervision process
(e.g. received practical help, frequency of contact
with one’ superv
i
sor, the quality of relationships
with one’s supervisor) without directly referring
to them, their test-retest r
el
iab
il
ity might be low as
there are no stringent criteria for assessing the
phenomenon and, therefore, the obtained scores ar
e
likely to be affected by the momentary thoughts
that are evoked during the evaluation. Finally,
the gener
al
measures require the respondents to be
more or less sure about their level of satisfaction
with their supervis
i
on, making it hard to evaluate
the satisfaction of those students who have not yet
formed an opinion of the quality of their
superv
i
s
i
on.
In order to address the outlined limitations of the
existing scales we developed a new measure of
s
t
uden
t
s’ satisfaction with their supervision; we
intended to include items that would be equally
applicable to a wide range of students, and that
would represent different facets of supervision
process (i.e. practical help, emotional support,
quality and sufficiency of contact with supervisor).
Since academic supervision is a process that takes
place
i
n interpersonal settings, we decided to focus
on its relational aspect and chose interdependence
theory (Kelley & Thibaut, 1978), one of the most
influential theories in the field of interpersonal
relationships, as a theoretical basis for the
development of our items. According to
interdependence theory, satisfaction with any
in
te
rperson
al
relationship is comprised of benefits
one receives in a relationship minus costs (what one
has to sacrifice for
t
h
e
relationship) and is affected
by a comparison level (how the relationship
compares to the previous experience and
relationships of similar others). We included two
different subtypes of relationship outcomes in our
test that, in our opinion, were of the utmost
importance for the relationship between students
and their supervisors - instrum
e
n
tal
subtype
represented practical help received by students, such
as useful advice and helpful materials, wh
e
r
ea
s
emotional subtype represented quality of
relationships between students and their supervisors
and evaluated such aspects, as liking, respect and
mutual understanding. The inclusion of outcome
level dimension allowed us
t
o control for students’
expectations which can alter the reported levels of
satisfaction in a dramatic way: While
a
mediocre
supervisor might be satisfying for one student who
had only bad academic advisors in the past or who
does not see any better opportunities, a good
supervisor might be less satisfying for another
student who has high expectations due to the past
exper
ie
n
c
e.
2 PRACTICAL SIGNIFICANCE
The developed measure of satisfaction with one’s
academic advisor can be applied in several ways.
Firstly,
it
can be used in future studies on students’
satisfaction with academic supervision, providing
more detailed
a
nd reliable information, than
frequently used one item measures. Secondly, it
might help to improve the quality of students’
supervision by revealing students’ perspective on
the strong and weak sides of their supervisors.
Thirdly,
t
he developed measure can help the
students who are not sure about how to evaluate the
quality of their supervision
t
o gain an insight into
their level of satisfaction with their supervisory
relationships by making them consider diff
e
r
e
n
t
aspects of the supervision pro
ce
ss.
3 METHOD
3.1 Participant and Procedure
The data were collected during a week. Thirty-two
participants participated in this study, convenience
m
et
hods used for sample selection, Convenience
Sampling is a sampling method (a way of
gathering participants for
a
study) used where you
select a naturally-occurring group of people within
the population you want to s
t
udy. Characteristics of
the participants are a student from master degree and
doctoral program and are conducting to finish thesis/
dissertation with their supervisor of at least 3
ICRI 2018 - International Conference Recent Innovation
3160

months. Filling out the questionnaire provided
through googl
e
docs created online, and then they
filled out from their social m
e
di
a
.
3.2 Measures
The measurement u s e d for the satisfaction of the
academic supervisor using the construct of
interdependence
t
heory which is part of the social
exchange theory that discussed the cost and reward
in such a relationship. In this measure, we took three
dimensions of this interdependence theory, namely
costs, rewards, and the comparison level. Cost
a
nd
reward discuss the ideal relationship is a relationship
that has a high rate of return and a low level of
charge. Th
e
s
e
benefits are resources that pleasant
and satisfying in such a relationship, while cost is a
reward or punishm
e
nt resulting in losses. This theory
has two types of reward and cost; emotional and
instrument
al
.
The number of items in t h e questionnaire is 36
items, comprised of three dimensions, scale used is
a Likert s
cale
with five options that totally disagree,
somewhat disagree, neutral, somewhat agree, and
totally agree. From the firs
t
dimension, rewards have
the total items 11, the second dimension, costs have
the total items 15, and the
t
hird dimension have total
items 10 with 7 negative
ite
ms.
After the questionnaire has been filled out by
participants, then use a statistical method to
measure reliability and validity from the instrument.
The result from statistic revealed that the total items
with good validity are 1t items. Th
e
first dimension
is rewards with total items 7, costs with total item 6,
and comparison level has total items are 4.
Dimensions reward and cost has three
subdimensions of emotional and instrumental
therein. Total item to th
e
dimensions of cost and
reward is 13 items. Emotional measure how positive
and negative feeling tendency of students to
supervisors during the discussion of their thesis.
Positive feeling is where students find it
e
n
j
oy
a
b
le
when interacting and discussing with supervisor
(eg I feel happy when discussing with my
supervisor I think I choose the right supervisor,
while the negative feeling is where students feel
negative emotions when they
i
nt
e
ra
ct
and discuss
with supervisors as disappointed and sad while or
after discussion with the supervisor (e.g. I do not
li
ke the personality of my supervisor, and I feel
disappointed with my supervisor).
Sub Dimensions instrumental measure of how
students feel that the supervisor helps them in
discussions
a
bout the thesis, providing assistance
morally and materially to the advancement of the
thesis, the supervisor has
t
he ability, and good
understanding in the field are being researched as
well as the positioning status is equivalent to
students (e.g. my supervisor Gives me always
literature to help my work, and I feel that my
supervisor always give me the right advice to revise
my work). As for the negative sub-dimensions
measure the relationship b
et
w
e
en students and
supervisors which hampered the progress of the
research supervisor of s
t
uden
t
The third dimension is the comparison level. The
third dimension relates to the expectations of the
r
e
sul
t
s obtained from the relationship. Where the
expectations of students are compared to the events
experienced by
t
h
e
student before undergoing a
thesis. Satisfaction depends on the expectations
established by previous exper
i
en
c
e. Someone will
have a level of comparison higher when a person
is happy, this is what determines satisfaction
i
n
such a relationship (e.g. Others students in my
department have better supervisor than the one I
have, I had
t
h
e
better supervisor before, the reality
is different with my expectation about my
supervisor, and I think my supervisor is better in the
field of my topic than my supervisor before). The
total of the item in this dimension is four items
a
nd
three from those items are negative items (reversed).
The following is the negative items from comparison
level
:
Others students in my department have better
supervisor than the one I have (reversed)
I had the better supervisor before (revers
e
d)
The reality is different with my expectation
about my supervisor (r
e
vers
e
d)
I think my supervisor is better in the field of
my topic than my supervisor befor
e
.
4 RESULTS
In the process of developing a reliable measure for
students’ satisfaction with their academic advisors,
each
t
es
t
item was carefully analyzed. According to
the Classical Test Theory, in order to obtain an
accurate measurement,
it
is necessary to reduce all
random errors caused by participants’
misinterpretations of items, their feelings, or
situational factors. The first step for establishing a
reliable measurement was the analysis of difficulty
(r
eac
tion) indexes of the items suggested. The upper
and lower bounds of the reaction index interval for
the Likert scale
it
ems used in the questionnaire were
calculated to be 4.2 and 1.8 respectively (each item
response contained five poss
i
b
le
options). The
Developing a Measure of Students’ Satisfaction with a Supervisor
3161
second indicator examined was the discrimination
index, which takes into account the number of
participants with high and low test scores who gave
a positive answer to a particular question; acceptable
values for the index vary from .20 to .80. It was
calculated through Reliability analysis function in
SPSS as item-to
tal
corr
elati
on.
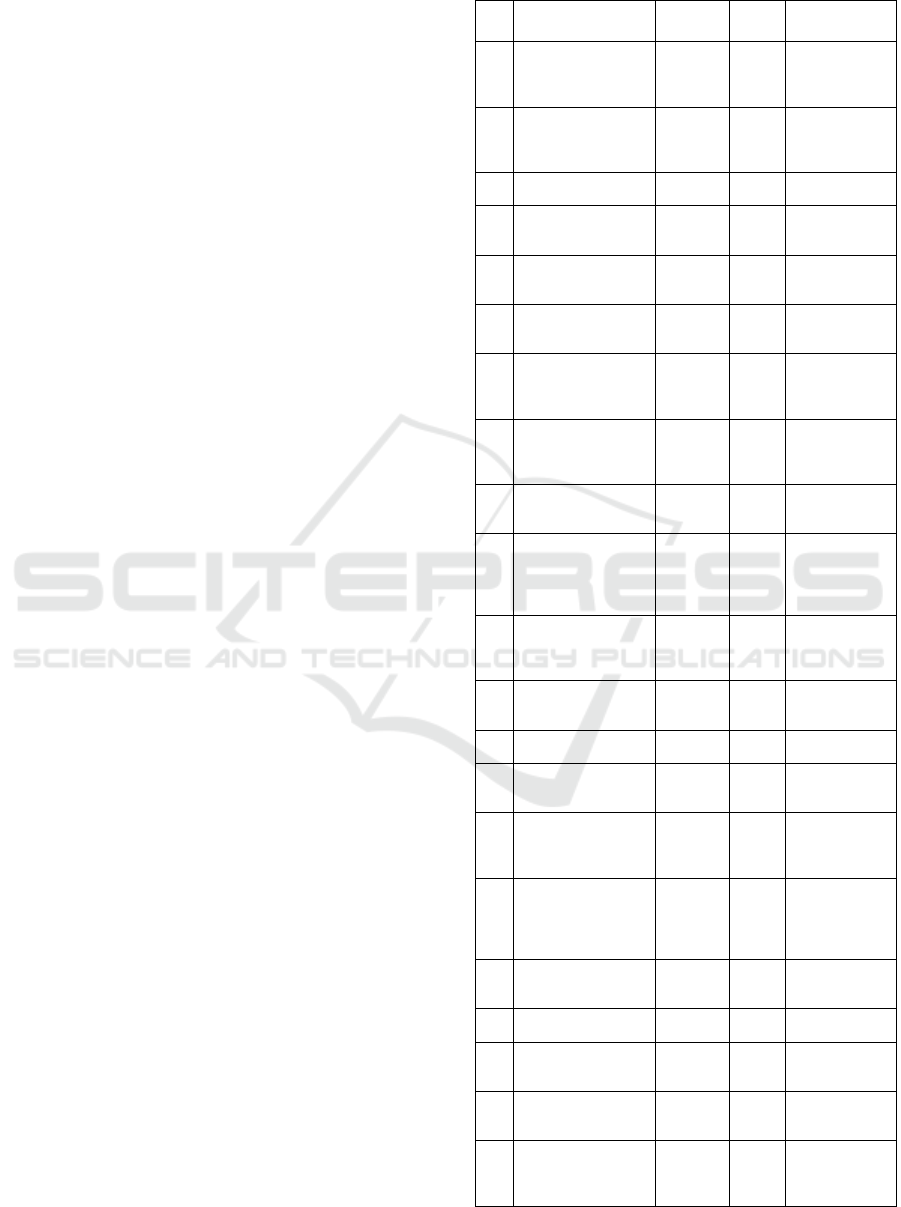
The decision to keep or to remove the items on
the first stage of analysis was based on the results
obtained for each item on both indicators displayed
in Table 1. The calculated values showed that most
of the items fitted
t
h
e
evaluation criteria (i.e.
reaction index in the range 1.8 – 4.2 and
discrimination index in the range .20 - .80). Th
e
tested items demonstrated good reaction indexes;
however, the obtained difficulty indexes were close
to the border values for some items (i.e. 2. “My
supervisor does not take into account my point of
view/opinion”, 6.
“
My supervisor does not treat me
seriously”, 12. “I could do better work without my
supervisor”, 18. “I am disappointed
i
n my
supervisor”, 19. “I think my supervisor does not
really like me”, 33. “I do not like the personality
of my supervisor”, 34. “Other students in my class
have better supervisors than I do”, 35. “I doubt the
research ethics of my supervisor”). Therefore, in
order to decide for further use of those items we
took into account
t
h
e
discrimination index values for
each of those items. In relation with satisfactory
discrimination rates the de
c
ision made was to
include the items in the further analysis procedure.
Also, some of the values of item dis
c
r
i
m
i
n
a
tion
indexes were negative due to the assumption that
participants with higher test scores answered the
items
i
n
c
orr
ectl
y more frequently compared to the
participants with lower scores. However, analysing
those items (i.e. 1.
“
My supervisor does exactly
what I have expected him/her to do”, 15 “My
supervisor knows how to inspire me
t
o continue my
work”, 20. “My supervisor gives me useful advice
on my work”, 24. “My supervisor is always r
ea
dy to
discuss my work with me”, 26. “I feel like together
with my supervisor we can solve all the problems
that I
ca
n face in my work”, 28. “It is more pleasant
for me to work with my supervisor, than with other
teachers“) nega
ti
v
e
discrimination indexes were
accompanied by acceptable reaction indexes. Due to
the satisfactory difficulty
i
ndex results, the items
were involved in the further
te
s
ti
ng.
Three items were excluded after the first
analytical
results were obtained due to poor results
in both index r
ate
s (i.e. 13. “My supervisor respects
my ideas”, 22. “Working together with my
supervisor is a pleasure for me”, 31. “My supervisor
values the effort I put in my work”).
Table 1: Item Reaction and Discrimination Indexes of
Student Satisfaction with Academic Advisor
Scale
Nr Item
Reaction
(SD)
Index
Discrimination
Index
1
My supervisor does
exactly what I have
expected him/her to
do.
3.75
(1.05)
-.170
2
My supervisor does
not take into account
my point of
view/opinion.
1.81
(1.33)
.792
3
My supervisor treats
me as equal
3.97
(1.18)
.395
4
I feel like we just
don't understand
each other.
1.94
(1.32)
.634
5
The requirements of
my supervisor are
too high for me.
2.22
(1.24)
.636
6
My supervisor does
not treat me
seriously.
1.78
(1.13)
.546
7
It takes my
supervisor for a long
time to answer my
letters.
2.63
(1.52)
.622
8
My supervisor uses
the results of my
work for his/her
personal gains.
2.22
(1.29)
.493
9
My supervisor is
enthusiastic about
my work.
4.00
(1.11)
.336
10
My current
supervisor is far
from the kind of
supervisor I would
want.
2.16
(1.35)
.608
11
Other teachers
understand my ideas
better, than my
supervisor.
1.97
(1.22)
.510
12
I could do better
work without my
supervisor.
1.81
(.93)
.450
13
My supervisor
respects my ideas.
4.50
(.80)
-.280
14
I feel comfortable
discussing my work
with my supervisor.
4.16
(1.08)
4.16 (1.08)
15
My supervisor
knows how to inspire
me to continue my
work.
3.70
(1.29)
-.391
16
My supervisor is
more competent in
the field of my work,
than other
teachers.
4.00
(1.14)
.218
17
My supervisor is too
busy to work with
me.
2.47
(1.34)
.237
18
I'm disappointed in
my supervisor.
1.50 (
.95)
.568
19
I think my supervisor
does not really like
me.
1.56
(1.05)
.297
20
My supervisor gives
me useful advice on
my work.
4.19
(1.12)
-.074
21
I have to remind my
supervisor to send
me the promised
materials.
2.71
(1.51)
.520
ICRI 2018 - International Conference Recent Innovation
3162
Nr Item
Reaction
(SD)
Index
Discrimination
Index
22
Working together
with my supervisor
is a pleasure for me.
4.25 (
.95)
-.367
23
Some of my teachers
show more interest
in my topic, than my
supervisor.
2.19
(1.23)
.680
24
My supervisor is
always ready to
discuss my work
with me.
4.03
(1.09)
-.386
25
I have to work hard
to please my
supervisor.
3.26
(1.15)
.216
26
I feel like together
with my supervisor
we can solve all the
problems that I can
face in my work.
4.03
(1.03)
-.148
27
In the past I had
better supervisors.
2.63
(1.50)
.542
28
It is more pleasant
for me to work with
my supervisor than
with other teachers.
3.66
(1.29)
-.213
29
My supervisor helps
me organize my
work.
3.50
(1.41)
.016
30
I feel confused after
discussing my work
with my supervisor.
2.63
(1.07)
.230
31
My supervisor
values the effort I
put in my work.
4.34 (
.90)
-.302
32
It is hard for my
supervisor to meet
my expectations.
2.41
(1.24)
.504
33
I do not like the
personality of my
supervisor.
1.47
(1.05)
.730
34
Other students in my
class have better
supervisors than I
do.
1.81
(1.20)
.692
35
I doubt the research
ethics of my
supervisor.
1.75
(1.08)
.635
36
My supervisor
requires me to
change my work
according to his/her
ideas.
2.28
(1.40)
.227
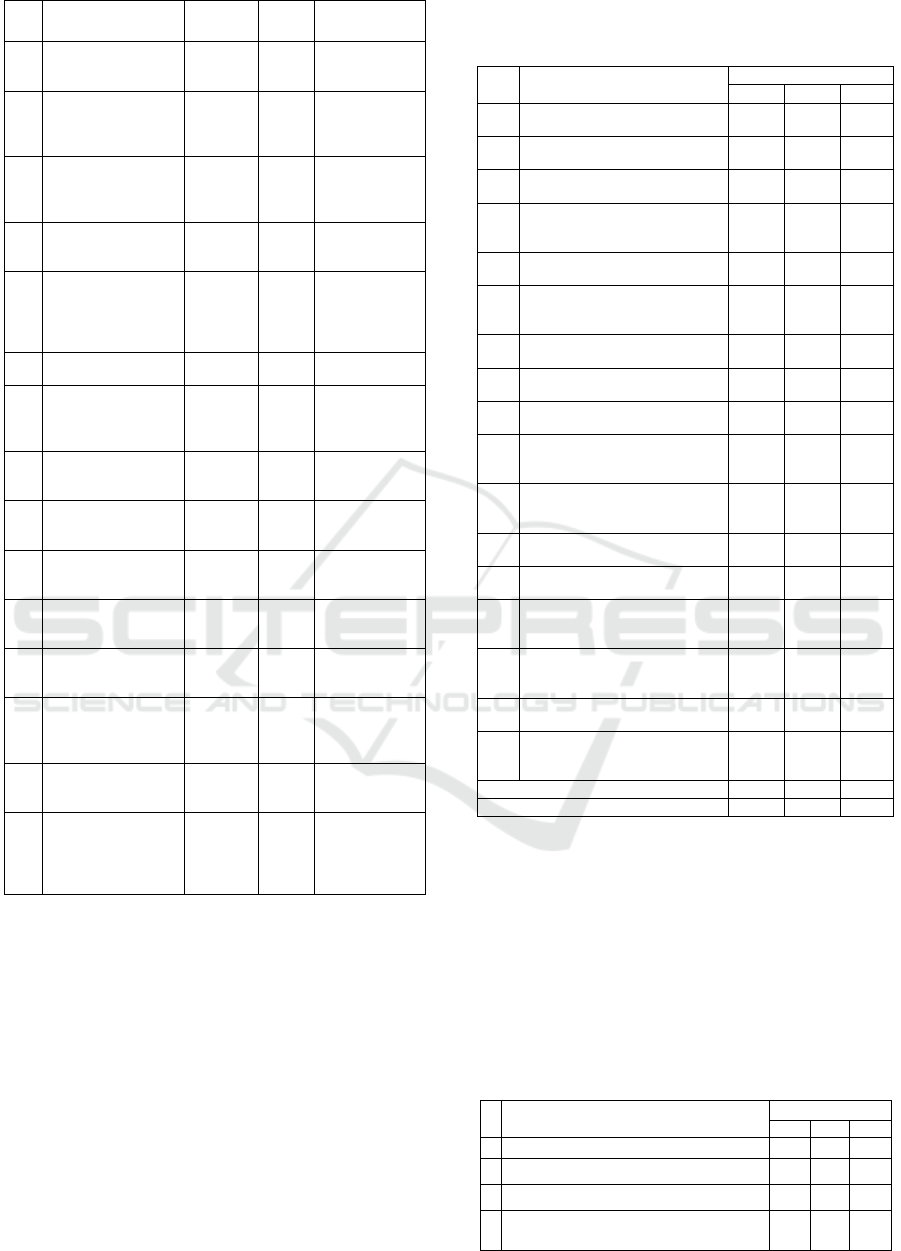
On the next stage of the item analysis, we
performed factor analysis. Principal component
analysis showed
t
ha
t
53.53 percent of the total
variance could be explained by three components.
Consequently, we decided that our final
questionnaire would contain three main subscales
measuring students’ satisfaction with their
ac
adem
ic
advisors. Accordingly, Principal Component
Analysis with Varimax Rotation has performed in
three-
c
ompon
e
n
t
extracted matrixes. The analysis
was run seven times and after each session items
were excluded from the scale due to the value
present in all three components. The results of the
Principal Component Analysis are displayed in
Tab
le
2.
Table 2: Primary Results of Principal Component
Analysis with Varimax Rotation for Student Satisfaction
with
Academic
Advisor
Scale
Nr. Item
Component
1 2 3
1
My supervisor is enthusiastic
about my work.
-.827
2
I feel like we just don't
understand each other.
.789
3
My supervisor does not treat me
seriously.
.783
4
Some of my teachers show more
interest in my topic, than my
supervisor.
.763
5
I feel comfortable discussing my
work with my supervisor.
-.754
6
My supervisor does not take into
account my point of
view/opinion.
.751 .439
7
My supervisor treats me as
equal.
-.683
8
My supervisor is always ready to
discuss my work with me.
-.627 .347
9
Working together with my
supervisor is a pleasure for me.
-.591 .555
10
My current supervisor is far from
the kind of supervisor I would
want.
.563 -.323
11
It is more pleasant for me to
work with my supervisor, than
with other teachers.
.700
12
It is hard for my supervisor to
meet my expectations.
.401 -.590
13
I feel confused after discussing
my work with my supervisor.
-.570
14
My supervisor requires me to
change my work according to
his/her ideas.
-.376 .682
15
My supervisor is more
competent in the field of my
work, than other teachers.
.404 .675
16
I have to work hard to please my
supervisor.
.657
17
My supervisor uses the results of
my work for his/her personal
gains.
.616
Component’s eigenvalues
6.670 1.922 1.382
% of variance
39.23 11.31 8.13
The decision regarding item assigned to each
subscale was made based on the item loadings in
eac
h component: We suggested that greater
loadings would contribute more to the scale
efficiency. Our decision was also based on item-
scale correlations which were revealed to be
significant for all three subscales (p < .01).
Correlation rates are presented in Table 3.
Table 3. Primary Correlation Rates of Student Satisfaction
with Academic Advisor
Scale
Nr.
Item
Correlation
Scale1Scale2 Scale
1
My supervisor is enthusiastic about my
work.
.824
2
I feel like we just don't understand each
other.
.805
3
My supervisor does not treat me
seriously.
.754
4
Some of my teachers show more interest in
my topic than my
supervisor.
.763
Developing a Measure of Students’ Satisfaction with a Supervisor
3163
Nr.
Item
Correlation
Scale1
Scale2 Scale
5
I feel comfortable discussing my work with
my
supervisor.
.756
6
My supe rvisor does not take into account my
point of
view/opinion.
.769
7
My supervisor treats me as
equal.
.796
8
My supervisor is always ready to discuss my
work with
me.
.698
9
Working together with my supervisor is
a
pleasure for
me.
.772
10
My current supervisor is far from the kind o
f
supervisor I would
want.
.676
11
It is more pleasant for me to work with my
supervisor, than with other
teachers.
.737
12
It is hard for my supervisor to meet my
expectations.
.761
13
I feel confused after discussing my work with
m
y
su
p
er
v
iso
r
.
.544
14
My supervisor requires me to change my
work according to his/her
ideas.
.717
15
My supervisor is more competent in the field
of my work, than other teachers.
.625
16
I have to work hard to please my supervisor.
.662
17
My supervisor uses the results of my wor
k
for his/her personal gains.
.711
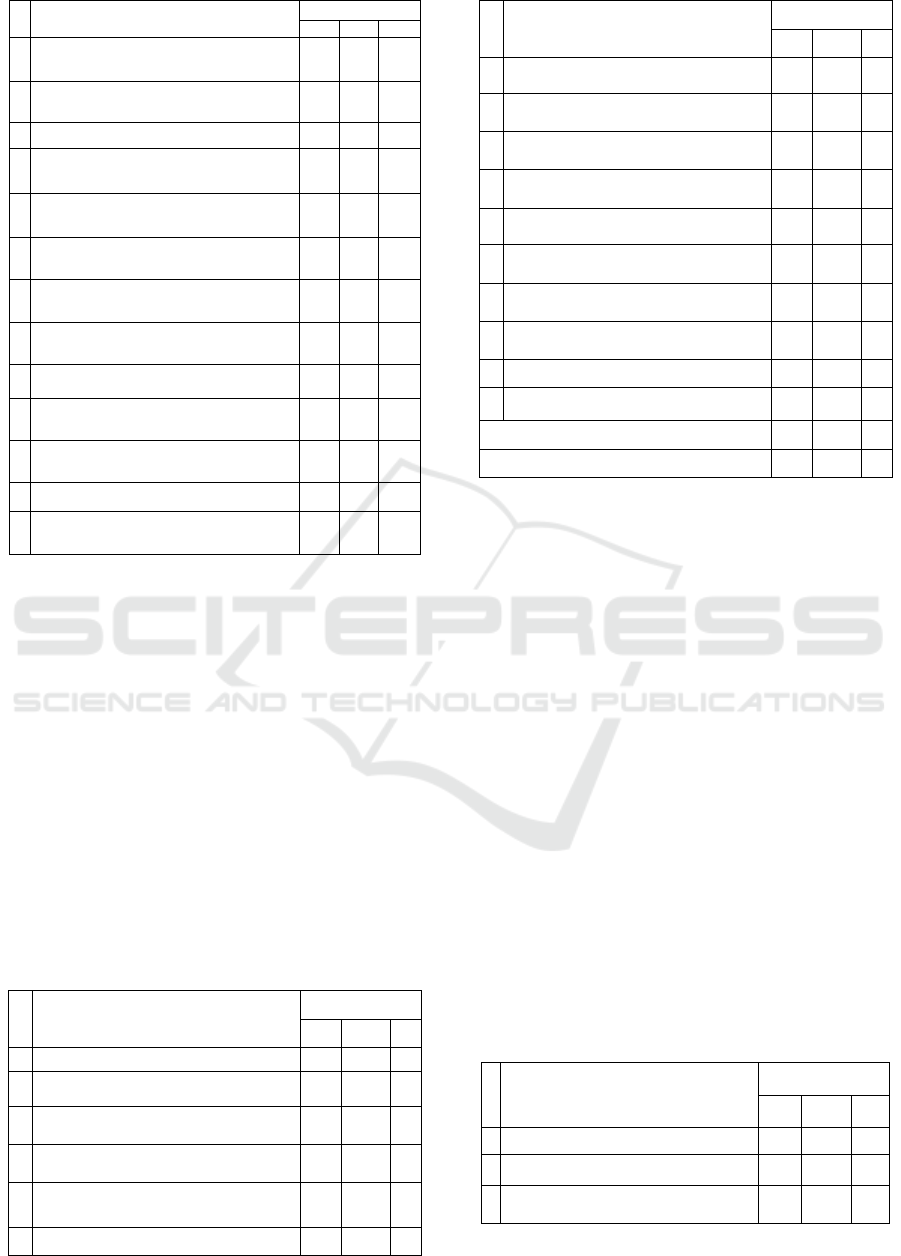
While checking the correlation rates and items’
content, we noticed that two of the items in the first
component (i.e. 6. “My supervisor doesn't take into
account my point of view/opinion”, and 3. “My
supervisor doesn't treat m
e
seriously “) hold similar
meaning and correlate with the subscale with
similar values (.769 and .754 respe
cti
v
el
y). In order
to improve the scale, we decided to discard item 3.
“My supervisor does not treat me seriously” as it
showed
a
lower correlation rate. With the purpose of
avoiding any kind of inaccuracies, a control
Principal Compon
e
nt Analysis was run again, and all
items displayed satisfactory loadings; the results are
presented in Table 4.
Table 4: Final Results of Principal Component Analyses
with Varimax Rotation for Student Satisfaction with
Academic
Advisor scale
Nr.
Item
Component
1
2
3
1
My supervisor is enthusiastic about my
work.
.827
2
I feel like we just don't understand each
other.
.799
3
Some of my teachers show more interest in
my topic, than my
supervisor.
.781
4
I feel comfortable discussing my work with
my
supervisor.
.751
5
My supe rvisor does not take into account my
point of
view/opinion.
.725
.462
6
My supervisor treats me as
equal.
.714
Nr.
Item
Component
1
2
3
7
My supervisor is always ready to discuss my
wor
k
w
i
th
m
e.
-.583
-.433
8
My current supervisor is far from the kind of
supervisor I would
want.
.567
.323
9
It is more pleasant for me to work with my
supervisor, than with other
teachers.
-.796
10
Working together with my supervisor is a
pleasure for
me.
-.542
-.623
11
It is hard for my supervisor to meet my
ex
p
ectatio
n
s.
.377
.600
12
I feel confused after discussing my work with
my
supervisor.
.463
13
My supe rvisor is more competent in the field
of my work than other
teachers.
-.301 .702
14
My supervisor requires me to change my
work according to his/her
ideas.
.373
.656
15
I have to work hard to please my
supervisor.
.648
16
My supervisor uses the results of my work for
h
i
s
/
h
e
r
p
e
r
s
on
a
l
g
a
i
n
s
.
.616
Component’s
eigenvalues
6.103
1.921
1.35
9
% of
variance
38.14
12.00 8.49
The items were assigned to each subscale
according to their loadings and the logical
connection between
t
h
e
m with the purpose to
compile a reliable measurement of our construct.
Thus, it was decided that Subscale one would
include eight items measuring students’ general
relationship with their academic advisors, Subscale
two would include three items representing positive
aspects of working with one’s scientific advisor, and
Subscale three would include five items connected
with negative aspects of working with one’s
scientific advisor. Final item
c
orr
elat
ions were
calculated and all values varied from .50 to .80 for
the first subscale, from .85 to .86 for the second
subs
cale
and from .54 to .71 for the third subscale,
which was regarded to be satisfactory for the final
division of items into the three subscales.
Moreover, all calculated correlations were
significant (p < .01). Results of the corr
elati
on
analysis and item selection in each subscale are
shown in Table 5.
Table 5:
Final
Correlation Rates of Student Satisfaction
with Academic Advisor
Scale
Nr
.
Item
Correlation
Scale1
Scale2Scale3
1
My supervisor is enthusiastic about my
w
o
r
k
.801
2
I feel like we just don't understand each
o
t
h
e
r
.817
3
My current supervisor is far from the kind o
f
supervisor I would
want.
.679
ICRI 2018 - International Conference Recent Innovation
3164
4
Some of my teachers show more interest in
my topic, than my
supervisor.
.804
5
I feel comfortable discussing my work with
my
supervisor.
.762
6
My supe rvisor doesn't take into account my
point of
view/opinion.
.736
7
My supervisor treats me as
equal.
.786
8
I feel confused after discussing my work
with
m
y
su
p
er
v
iso
r
.
.499
9
Working together with my supervisor is a
pleasure for
me.
.858
10
My supervisor is always ready to discuss
my work with
me.
.847
11
It is more pleasant for me to work with my
supervisor, than with other
teachers.
.846
12
It is hard for my supervisor to meet my
expectations.
.567
13
My supervisor requires me to change my
work according to his/her
ideas.
.644
14
My supervisor is more competent in the
field of my work, than other
teachers.
.540
15
I have to work hard to please my
supervisor.
.679
16
My supervisor uses the results of my work
for his/her personal
gains.
.706
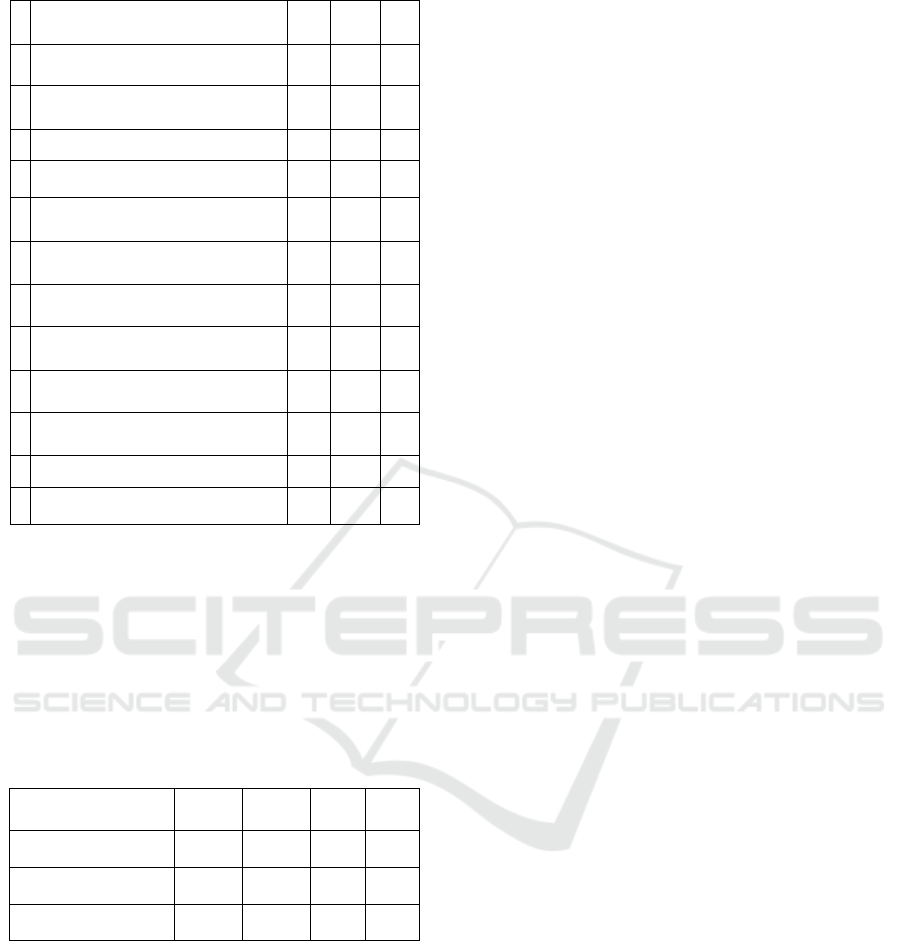
At the final stage of our analysis we calculated
the reliability of each subscale. The reliability
analysis demonstrated that our scales have from
fair (α = .62) to good (α = .88) reliability, thus,
we concluded that
t
h
e
internal consistency of our
scale is acceptable. Reliability statistics are
presented in Table 6.
Table 6. Descriptive Statistics and
Reliability
Indexes for
Satisfaction with Academic Advisor
Scale
Scale
Number of
items
Cronbach’s
alpha
Mean
SD
Relationship with academic
advisor
8
.878
16.59
7.13
Working with academic
a
d
visor-
P
ros
3
.797
11.94
2.83
Working with academic
a
d
v
isor-
Cons
5
.622
14.13
3.93
5 CONCLUSIONS
The findings of the present study support the
hypothesis based on Interdependence Theory.
Validity and reliability of the scale were
successfully tested as well. Thus, we may conclude
that the new approach to
t
h
e
measurement of
satisfaction with the relationship with an academic
advisor may be established. We may assume, that
not only the items, which address the state of
satisfaction directly, may assess satisfaction. The
present study proves that items, which are designed
to measure different components of a relationship,
may assess s
atis
f
ac
tion.
Interdependence theory suggests that satisfaction
with relationship occurs in a situation when rewards
and
c
osts appear to be balanced. Satisfaction would
not be experienced when one perceives that the
partner (here supervisor) takes more from than gives.
The pre-test of the Satisfaction with Academic
Advisor Scale (SAAS) revealed f
ac
tors measuring
costs and reward of working relationship with one’s
advisor. Thus, subscale two, which includes
t
hr
ee
items representing positive aspects of working with
one’s scientific advisor can be interpreted as a factor
des
c
r
i
bing rewards that one gets from work with an
academic advisor. While subscale three including
five items connected w
it
h negative aspects of
working with one’s scientific advisor is measuring
costs for work with one’s superv
i
sor.
The only surprising factor is subscale one
including eight items measuring students’ general
relationship w
it
h their academic advisors. It is
different from the subscale, which was designed at
the beginning of the s
t
udy, comparisons scale. We
may assume, that the new measuring more general
personal satisfaction with th e r
ela
tionship with
one’s supervisor perceived not only like professional
but also as a person. Still, the items from the new
f
act
or do not measure general satisfaction with the
relationship. The new factor assesses one’s
perception of the interaction
a
nd reveals some
crucial aspects of the re
lati
onship.
The limitation of the present study is t h e size
of t h e sample. For further research, it is needed to
conduct pre-test of three-factor scale on a larger
sample. However, the present study results support
the hypothesis of relationship w
it
h supervisor as
complex two-way interaction, which has outcomes
for the two par
tie
s.
The Interdependent Theory suggests a complex
matrix of interaction. Process of t h e
transformation of given situation into effective
situation includes one’s perception of partner’s
outcomes Thus, we may suggest, that th
e
next step
of the research project would be the development of
test assessing one’s perception of supervisor’s
out
c
om
e
s from the working relationship. The
completed interaction matrix would have significant
predicting validity. It would predict the quality of
the interaction between student and advisor and will
help to improve it and make more lasting
a
nd
frui
t
ful.
Developing a Measure of Students’ Satisfaction with a Supervisor
3165

REFERENCES
Garcia, M. E., Malott, R. W., & Brethower, D. (1998). A
system of thesis and dissertation supervision: Helping
graduate
students succeed. Teaching of Psychology,
15(4),
186-191.
Kelley, H. H., & Thibaut, J. E. (1978). Interpersonal
relations: A theory of interdependence. New York,
NY:
Wiley.
Kenneth, R. (2016). The advising alliance
for international and domestic graduate students:
Measurement invariance
and
implications for
academic stress. Journal of Counseling Psychology.
Article in
press.
Mori, Y., Inman, A. G., & Caskie, G. I. L. (2009).
Supervising international students: Relationship
between
acculturation,
supervisor multicultural
competence, cultural discussions, and supervision
satisfaction. Training and Education in
Professional
Psychology, 3(1),
10-18.
Morningside College Advising Assessment Instrument.
Retrieved
from
http://provost.uncc.edu/sites/provost.uncc.edu/files/me
dia/Best-Practices-Evaluating-Academic-
Advising%2BAttachments.pdf
Pyhältö, K., Vekkaila, J., & Keskinen, J. (2015). Fit
matters in the supervisory relationship: doctoral
students
and
supervisors perceptions about the
supervisory activities. Innovations in Education and
Teaching International, 52(1),
4-16.
Soria, K. M. (2012). Advising satisfaction: Implications
for the first-year students’ sense of belonging and
student
retention. The Mentor: An Academic Advising
Journal. Retrieved from
https://dus.psu.edu/mentor/2012/10/advising-
satisfaction/
Szymanska, I. (2011) Best practices for evaluating
academic advising Retrieved
from
http://provost.uncc.edu/sites/provost.uncc.edu/files/me
dia/Best-Practices-Evaluating-Academic-
Advising%2BAttachments.pdf
Tenenbaum, H. R., Crosby, F. G., & Gliner, M. D.
(2001). Mentoring relationships in graduate school.
Journal
of
Vocational Behavior, 59,
326-341.
Williams, L. (1994). A tool for training supervisors:
Using the supervision feedback form (SFF). Journal
of Marital
and
Family Therapy, 20,
331–315.
Worthen, V. E., & Dougher, M. K. (2000). Evaluating
effective supervision. Paper presented at the
American
Psychological Association Convention,
Washington,
D.C.
ICRI 2018 - International Conference Recent Innovation
3166
