
How Demographics Affect Quality of Work Life and Work-Life
Balance
Rina Anindita
1
, Lindawati
1
, Taufiqur Rachman
1
and Hasyim
1
1
Management Department, University Esa Unggul, Jakarta
Keywords: Demographics, Quality of Work Life and Work-Life Balance
Abstract: This research aims to identify is there any impact on the quality of work life and work-life balance of
tourism industry workers given by demographics factor (age,gender and marital status). How age gives
impact on quality of work life and work-life balance; how gender gives impact on quality of work life and
work-life balance; and how marital status gives impact on quality of work life and work-lifebalance.
Methods of data analysis used in this research arethe chi-square method with the help of two
categorizations, three and five in all data from all respondents. This research was conducted in some big
cities in Indonesia involving 150 male and female workers, working in the tourism industry. The findings
show that there is no impact on the quality of work life from age, gender and marital status. Age does give
an impact to work-life balance, while gender and marital status do not give any impact to work-life balance.
1 INTRODUCTION
From the time we were born, humansare destined to
work. Law 1945 article 27 verse 2 set a rule that
every citizen shall have the right to work and to earn
a humane livelihood. While seeing ourselves or
other people try as hard as we can to compete to earn
a degree and try to make our dreams true, we may
often wonder what is the purpose of work while at
the same time some of us may think it is because we
would have no choice about what to do. As a
conclusion, we may say that working aims to earn
money (White, 2017).
When the person is working, usually it is done
after they are finished their study either in high
school or university level according to their
tendency or age limitation. For male workers,
working usually becomes a continuous routine
especially after marriage. That is to fulfil their
responsibility either from their perspective, local
norms or by law. On the other side, a Korean
website, Chosun surveyed in April 2017 and
concluded that 46% percent of women quit their job
after marriage. Though there are women who quit
after marriage, some of them still continue.
According to Wolfman B.S. (1992) as cited from
Sumiyatiningsih (2014) motivation for women who
continue working after marriage usually followed by
two factors, motivation to fulfil economic needs and
toactualize themselves.
Quality of work life and work-life balance
studies mainly conducted due to traditional thinking
that women who play two or three roles: as a wife,
mom and career woman may find it difficult to play
all roles in their lives with averagely equal time
spend. This perspective may not wrong eventhough
we can see it happens among us or maybe we
experience it by ourselves. Men are treated and seen
as a strong human who always taught to be the
breadwinner since their young age. In opposite,
women are treated to be able to do domestic chores
to be seen as weak creatures thus make them stay at
home and handle all domestic problems. The
traditional domestic roles like this may still be
applicable for some families. However, in the
modern way of living nowadays, it may not be too
relevant anymore.
Priherdityo (2016) on CNN stated that Indonesia
has the 6th largest career women in the world. With
a percentage for senior position for women is in
34%. It means that by time men and women can
have the same opportunity to climb the company
ladder. Women’s position is getting more and more
attention by studies. It may be based on the thinking
perspective or by another attention. Aside from that,
study about quality of work life for men is not as
much as about women.
2616
Anindita, R., Lindawati, ., Rachman, T. and Hasyim, .
How Demographics Affect Quality of Work Life and Work-Life Balance.
DOI: 10.5220/0009949226162627
In Proceedings of the 1st International Conference on Recent Innovations (ICRI 2018), pages 2616-2627
ISBN: 978-989-758-458-9
Copyright
c
2020 by SCITEPRESS – Science and Technology Publications, Lda. All rights reserved

In a general perspective, age usually can be seen
as the measurement of how mature someone to see
things in their life. It is seen as how someone can
organize themselves and everything surrounding
them. For example, we may find it is difficult to
balance our school life and family life when we were
still teenagers. However, as we grow older, now we
are facing another problem: how to balancing our
work life with family life, social life and leisure
time. Another complexity is, when talking about
work life, there are times when we feel comfortable
at work,but also there are times when we do notfeel
any positive vibes through work. The problems that
may occur is it may reduce our productivity and
develop negative feelings in the workplace.
While age usually acts as a measurement of
one’s maturity, gender is usually seen from people’s
perspective about how should someone live their
life. Even male and female roles are not only set by
social norm, but also by law. Indonesian law
regulation put men like the one who should protect
his wife and give everything she needs, also women
are the one who is responsible for the domestic affair
(Under Marriage Law of 1974 article 34 verse 1). As
human needs have increased, women’s role in the
workplace cannot be underestimated and make
gender diversity is now a modern issue in the
workplace. While many efforts were made to make
women and men being equal, but there is still
another effort that needs to being put.
We can see that eventhough women roles inthe
workplace have increased but gender equity has not
come out in an equal way between men and women.
As people always see men likestrong creatures and
women as a weak creature but an in-depth study of
quality of life and work life balance in men
perspective has been rarely found. In this modern
era, good quality of life and work life balance are
not only limited by how a person’s role at the
workplace and their family that most people always
associate it with women as the employee, a mother
and wife. But also, include a person’s social life that
can be associated with a broader circle: singles and
men.
We may wonder now, why the quality of work
life and work-life balance need to be learned again if
they are too common to be learned by scholars? The
answer may vary, but the quality of work life and
work-life balance will always be themain focus by
companies nowadays since many companies are
putting more effort to encourage their employees to
balance their lives domains. For example, PwC
(report) provides some facilities to facilitate their
employees’ work-life balance. They held: PwC Say,
PWC Away day, PwC Outing and PwC Gathering.
Also, they provide lounge, in-house clinic and dental
clinic, nursing room and other facilities to support
their employees’ quality of work life. Some articles
also now encourage the interviewee to ask about the
company’s work-life balance through interview
session.
For this research, the researcherchooses men and
women aged above 25 years old who works in
Jakarta and Tangerang. Jakarta is considered to be
the busiest city in Indonesia as it is the capital city of
Indonesia and Tangerang is seen as the satellite city
that supports workers who work in Jakarta. Reported
by Tranghanda in Hamdani (2017), around four
million people commute from satellite cities such as
Tangerang, Bekasi, Bogor and Depok to work in
Jakarta. Since Jakarta and Tangerang are connecting
and supporting each other in the economic sector,
we consider the workers in these both cities as the
workers whom the quality of life and the work-life
balance may get affected by their condition in their
journey to and from work.
The purpose of this study is to know the impact
of demographics to the quality of work life for
workers in Jakarta and Tangerang, and The impact
of demographics to work-life balance for workers in
Jakarta and Tangerang.
2 HYPOTHESES
DEVELOPMENT
2.1 Demographic to Quality of Work
Life
In her study, Anyaoku (2016) finds that QWL
depends on the gender by using Independent
Samples Test. In addition, also in her study
librarians age 45-60 reported significantly higher
satisfaction in contributing to the growth and
development to the society compared to those aged
20-29. Related to Anyaoku (2016), Amirtash and
Tondnevis (in Mirkamali and Thani, 2011) carried a
study and concluded that there is a significant
relationship between QWL and some of its aspects
with age and number of teaching years in faculty
members.
2.2 Demographic to Work-Life Balance
Thriveni and Rama (2012) bring a conclusion that
demographic variables such as age, income,
experience, marital status influence the women
How Demographics Affect Quality of Work Life and Work-Life Balance
2617

employees in their work-life balance. McMillan et
al. (2011) in Tomaževič et al. (2014) describes
work/life issues impact everyone without seeing
their education level, gender, income level, family
structure, occupation, race, age, job status or
religion. Panisoara and Serban (2013) did a special
study to find a relationship of marital status and
work-life balance. To reduce inequity, they divided
all respondents into four categories: unmarried,
married without children, married with children
under 18 and married with children above 18. All
four categories do not have a significant relationship
to work-life balance.
2.3 Hypothesis
Quality of work life programs mainly focuses on
two sectors, productivity and increases the
satisfaction of employees (Gadon, 1984 in Ahmad,
2017). In his journal, Wright (2002) also depicts that
factors like age, employment, gender, education and
income are very important to relate to the level of
QWL among the employees. Ahmad (2017) in his
study also proved that the study suggested a
statistically significant correlation between the
demographic variables such as age, a period of
service, income and education of employees of
University and QWL. The result excluded gender as
it has no significant correlation to QWL. From the
description above, hence, hypothesis 1 to 3 are
offered.
H
1
: Demographic is related to the quality of
work life
H
1a
: Age is related to the quality of work life
H
1b
: Gender is related to the quality of work
life
H
1c
: Marital Status is related to the quality of
work life
Working women at midlife age mostly
experience varieties of challenges such as, caring for
children, parents, or spouse, yet sustaining marriage
in the face of the opposite pulls of overload and
complacency, juggling various rules, and stimulating
(Whelan Berry and Gordon, 2004; Wallen, 2002 in
Marcinkus et al., 2007). Due to the new gender
equity which women nowadays are more likely also
in work population, shifting role expectations (in the
family), and family time scarcity, many men and
women are required to find new ways to balance
their professional and personal lives (Rao and Indla,
2010). From that findings, hypothesis 4 – 6 are
offered.
H
2
: Demographic is related to work-life
balance
H
2a
: Age is related to work-life balance
H
2b
: Gender is related to work-life balance
H
2c
: Marital Status is related to work-
lifebalance
3 RESEARCH METHOD
3.1 Sampling Method
The method of this research is purposive sampling
that is a type of non-probability sampling technique.
Non-probability sampling focuses on units that are
investigated based on the judgement by the
researcher. This means, before the research has
started, the researcher has classified which group of
respondents that meet the characteristics the
researcher needs. The goal of purposive sampling is
to focus on particular characteristics of a population
which will enable us to answer the questions (Lund,
2012).
These are some characteristics of the respondents
for this research:
a) Workers aged >21
b) Workers with minimum one year of work
c) Workers that work in a formal sector (not civil
workers)
3.2 Data Analysis Technique
3.2.1 Validity Test
The importance of validating research instruments
especially questionnaires are spread through most
studies. Validity test expresses the stage or degree in
which the measurements in the research instrument
measure the purpose of the research, it varies
depending on which instrument the researcher is
using when the research is going. Several varieties
that can be usedare faced validity, construct validity,
content validity and criterion validity. Validity tests
are categorized into two components, internal and
external validities. Internal validity refers to how
accurately the measures obtained from the what the
research is quantifying what it was designed to
measure, while external validity refers to on what
stage the measures can obtain from the sample that
describes the population general (Bolarinwa, 2015).
Questionnaire validity test was conducted by
Pearson Product Moment Correlations using SPSS
(SPSS, 2015). The validity test by Pearson was done
by seeing the correlation on each item on the
ICRI 2018 - International Conference Recent Innovation
2618

questionnaire in a total score. Here is the basic
making decision when using validity test. The
Pearson Product Moment formula is as shown
below:
∑
∑
∑
∑
.
∑
∑
∑
∑
(1)
Source: Siregar (2016)
Where:
rxy = Items correlation coefficient
n = total subject
∑x = total score from each item
∑y = total multiplication from each item
When the scoring is done, we can decide the next
action that we should do after we read the score.
These rules applied after we get the score.
a. Seeing the value of significance:
i. If the significance value < 0.05, then the
instrument is declared invalid
ii. If the significance value > 0.05, then the
instrument is declared invalid
b. Comparing the value of rxy table with r product
moment:
i. If the value of rxy> r table product moment,
then the instrument is declared invalid
ii. If the value of rxy< r table product moment,
then the instrument is declared invalid
3.2.2 Reliability Test
Reliability can be established by using a pilot test
with 20 to 30 respondents outside the sample
(Bolarinwa, 2015). This step is used basically to
check the consistency of the respondents
(Collingridge, 2014). Cronbach Alpha is the most
common test used to measure internal consistency
reliability. Cronbach Alpha values range from 0-1.0
that the acceptable value range starts from 0.70. In
most cases, the lowest value is 0.60 to make the
score acceptable.
The formula of Cronbach Alpha can be seen
below:
1
1
∑
(2)
Where:
r
11
= the coefficient of instrument reliability
k = number of questions
S
i
2
= score variants from all questions
St = deviation standard from all instrument
Some conditions could affect Cronbach values,
they are:
a. Numbers of items, the scale of <10 variables
could cause Cronbach alpha to be low;
b. Distribution of score, normality increases
Cronbach alpha value while skewed data
reduces it;
c. Timing, Cronbach alpha does not indicate the
stability or consistency of the test over time;
d. The wording of the items, the negative-worded
questionnaire should be reversed before scoring;
e. Items with 0. 1 and negative scores; Ensure that
items/statements that have 0 s, 1 s and negatives
are eliminated.
3.3 Score Interpretation
Psychology score interpretation is normative, means
that all scores that have been collected measure to
the relative position of theoretic population score
mean as a parameter. In the end, the quantitative
score that is still being a number can be interpreted
qualitatively (Azwar, 2015). To interpret the score
thoroughly, we may make categorization to put each
unit to its group which has an elevating position
based on the attribute that measured. This research
then measures the impact of demography onthe
quality of work life and demography to work-life
balance with two tests. The first one in three
categories and the second one in five categories.
Three categories measure each relationship as
follows:
μ1,0 Low
μ1,0
μ1,0
Medium
μ1,0
High
While five categories measure each relationship as
follows:
μ1,5 Very low
μ1,5 μ0,5 Low
μ0,5 μ0,5 Medium
μ0,5 μ1,5 High
μ1,5 Very High
Where:
X = Total score of questionnaires
µ = Mean
= Deviation standard
Since this research used three variables which
demographic has three its variables, in total,six
categories are measuring applied in this research to
find the precise answer.
How Demographics Affect Quality of Work Life and Work-Life Balance
2619

3.4 Chi-Square
Chi-Square is a statistical measure used in the
context of sampling analysis for comparing a
variance to a theoretical variance (Kothari, 2004).
As a non-parametric test, chi-square can be used as a
test of goodness of fit and as a test of independence.
Before applying the chi-square method, some
conditions shouldbe applied:
a. Observations recorded and used are collected on
a random basis.
b. All the items in the sample must be
independent, means no relation between items
c. A group should not contain very few items (less
than 10).
d. The overall number of items must also be
reasonably large. It should normally be at least
50, howsoever small the number of groups may
be.
e. The constraints must be linear. Constraints
which involve linear equations in the cell
frequencies of a contingency table (i.e.,
equations containing no squares or higher
powers of the frequencies) are known are
known as linear constraints
Chi-squareis then calculated as follows:
(3)
Where:
2
= chi square
O
ij
= observed frequency of the cell in i
th
row and
j
th
column
E
ij
= expected frequency of the cell in i
th
row and j
th
column.
∑ = Summation
Observed frequency can be defined as counts
made from experimental data. In other words, the
observed frequency is obtained after the experiment
happen. In another side, expected frequency is the
number from calculations made by using theory
(Statisticshowto, 2017). In chi-square, both units are
said having a relationship if the significant value is
under 0,05. Alternatively, if it is written in number
sentence, the statement becomes, sig < 0,05.
4 RESULTS AND DISCUSSION
4.1 Results
4.1.1 Quality of Work Life (QWL)
Quality of Work Life uses two categorization, three
and five. For each different categorization
calculation applied. The calculation is done using
SPSS with score result, minimum = 22; maximum =
80, mean = 42.87 and deviation standard = 6.68.
From this calculation, all 150 questionnaires were
used and classified into each suitable category as
shown in Table 1.
Table 1: Quality of Work Life 3 Categorization
No. Formula Interpretation Total Percentage
1. X < 38.9 Low 15 10%
2.
38.9 ≤ x <
52.723
Medium 120 80%
3. 52.723 ≤ x High 15 10%
From the table, it shows that 15 respondents have
a low level, 120 respondents have a medium
level,and 15 respondents have a high level of quality
of work life. The interesting part is, the majority of
respondents fall in the medium level of quality of
work life. For the next step, the researcher has
broken down the categories from three to five
categories to get the detail result.
Table 2: Quality of Work Life 5 Categorization
No. Formula Interpretation Total Percentage
1. X ≤ 35.45 Very low 7 5%
2.
35.45 < x ≤
42.36
Low 38 25%
3.
42.36 < x ≤
49.26
Medium 72 48%
4.
49.26 < x ≤
56.17
High 28 19%
5. 56.17 < x Very high 5 3%
Source: Researcher’s own SPSS Result, 2018
According to Table 2, in this categorization, we
have found that 7 respondents can be classified in
the very low level of QWL, 38 respondents in low
level, 72 respondents in medium level, 28
respondents in high level and 5 respondents in very
high level. Compare to results in three
categorization; the finding is still related that
respondents vastly have a medium level of quality of
work life.
ICRI 2018 - International Conference Recent Innovation
2620
4.1.2 Work-Life Balance (WLB)
There are two categorizations for Work-Life
Balance (WLB), three and five categorizations. The
calculation is done using SPSS with the following
result: minimum = 16.00, maximum = 39.00, mean
= 27.24 and deviation standard = 3.60. The same
questionnaires (respondents) were used for this
calculation. The result for three categorisations can
be seen in Table 3.
Table 3: Work-Life Balance 3 Categorizations
No. Formula Interpretation Total Percentage
1. X < 23.63 Low 8 5.34%
2.
23.63 ≤ x <
27.23
Medium 50 33.34%
3. 27.23 ≤ x High 92 61.32%
From the table shown above, there are 8
respondents fall in low level, 50 respondents fall in
medium level,and 92 respondents fall in the high
level of work-life balance. Moreover, from the
results majority fall in high level. To get the detail
result, the researcher did another test of WLB in five
categorizations. The result can be seen in Table 4.
Table 4:Work-Life Balance 5 Categorizations
No. Formula Interpretation Total Percentage
1. X ≤ 21.84 Very low 3 2%
2.
21.84 < x ≤
25.44
Low 9 6%
3.
25.44 < x ≤
29.04
Medium 105 70%
4.
29.04 < x ≤
32.64
High 31 20.7%
5. 32.64 < x Very high 4 1.3%
Source: Researcher’s own SPSS result, 2018
Among those 150 respondents, there are 3
respondents with very low WLB level, 9
respondents fall in low level, 105 respondents in
medium level, 31 respondents in high level and 4
respondents fall in the very high level of WLB.
Compare to the previous Table 4.6 there is a
different result that from all respondents that
classified to a high level of WLB in three
categorizations, when it is all broken down to five
categories, most of all respondents that classified to
the high level had been classified to medium level of
WLB.
4.1.3 Chi-square Test
In this research, the researcher uses three
demographics factor: age, gender and marital status
as an X and both QWL and WLB as Y. The impact
level from X to both Ys is seen from the result of
Chi-square test using SPSS software. The rule is if
the Pearson chi-square test shows result score >0.05
it means X has an impact to Y. In contrast, if the
Pearson chi-square test shows result score <0.05 it
means X does not have an impact to Y. Since there
are two categorizations for both Y variables, each
demographic factor will be tested separately with
each Y categorization.
4.1.4
Demographics Crosstabulation Age
Two tests were done for both variables,
demographic (age) to QWL. each test shows the
impact of age to QWL in three or five
categorizations. In age classifications, there are
originally six age classifications, but since there are
two classifications that did not get any respondents
thus both of them will not be shown in this table or
any test.
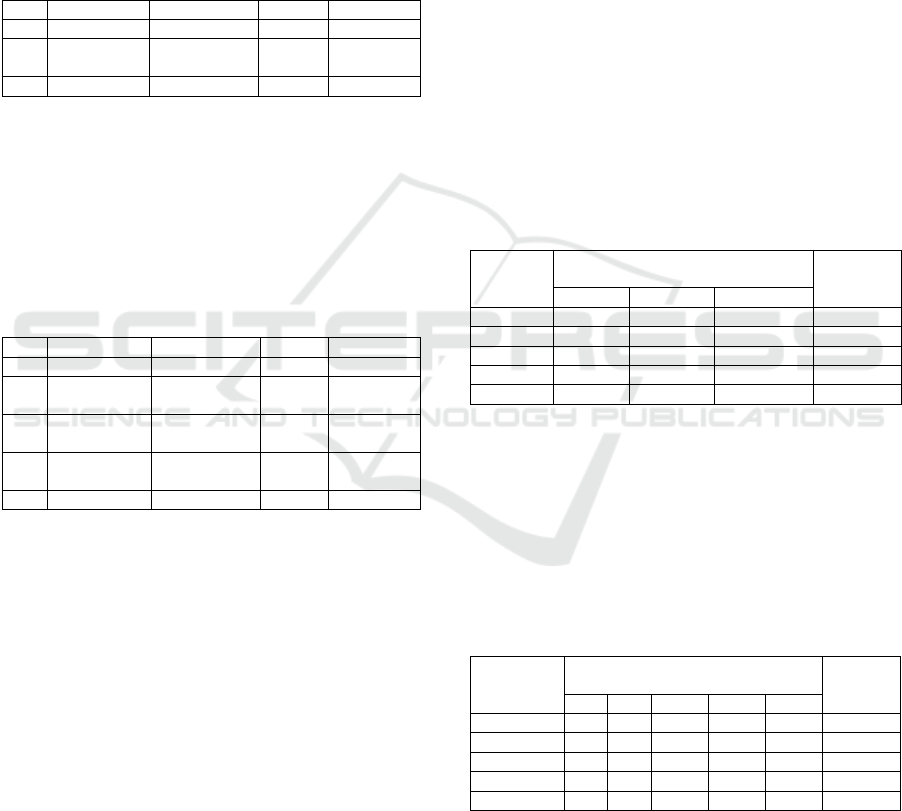
Table 5: Crosstabulation Age to QWL 3 Categorizations
Age
Quality of Work Life
(Categorization)
Total
1 2 3
21 – 25 8 57 4 69
26 – 35 6 54 9 69
36-45 1 7 2 10
46-55 0 2 0 2
Total 15 120 15 150
Source: Researcher’s own SPSS Result, 2018
Based on Table 5, the score of sig.
test is
0.696 that rejects the hypothesis and has a meaning
that there is no relationship between age and quality
of work life. After finished doing this test, the
researcher did another test for QWL in five
categorizations. The result shows in Table 6.
Table 6: Crosstabulation Age to QWL 5 Categorizations
Age
Quality of Work Life
(Categorization)
Total
1 2 3 4 5
21 - 25 4 18 35 10 2 69
26 - 35 3 17 31 15 3 69
36-45 0 3 4 3 0 10
46-55 0 0 2 0 0 2
Total 7 38 72 28 5 150
Source: Researcher’s own SPSS Result, 2018
In this test, QWL has divided into five
categorizations which makes the researcher able to
analyze deeper. The sig.
score is known at 0.935
which also rejects the hypothesis from the researcher
How Demographics Affect Quality of Work Life and Work-Life Balance
2621

and confirm the finding from the previous table that
these two variables have no relationship which age
has no impact on QWL of the respondents. On the
next step, two tests were done between age and
WLB (three and five categorizations).
Table 7 :Crosstabulation Age to WLB
Age
Work-LifeBalance (Categorization)
Tot
al
1 2 3 4 5
21 - 25 3 1 49 12 4 69
26 - 35 0 7 45 16 0 68
36-45 0 1 9 1 0 11
46-55 0 0 0 2 0 2
Total 3 9 103 31 4 150
Source: Researcher’s own SPSS Result, 2018
Based on Table 7, in this test sig.
= 0.036
confirms that there is an impact on age to WLB.
This brings hypothesis 2a can be accepted and
rejects H0. Even though most of the respondents fall
in the third category, but compare to older
respondents (aged >35) younger respondents have
more tendency to have higher work life balance.
Gender
Gender only falls into two classifications: male
and female. In this section, gender will be tested
with QWL and WLB. For each Y variable, there will
be 2 tests. Each table shows the connection between
two variables in three and five categories.
Table 8: Crosstabulation Gender to QWL 3
Categorizations
Gender
Work-Life Balance
(Categorization)
Total
1 2 3
Male 5 44 10 59
Female 10 76 5 91
Total 15 120 15 150
Source: Researcher’s own SPSS Result, 2018
According to Table 8, this test shows there is no
relationship between gender to WLB from the test
score, sig.
= 0.71, while in the chi-square
method, two variables are said having a relationship
if the significance test is < 0.05. To confirm the
finding in this test, the researcher did another test
with QWL in five categorizations.
Table 9: Crosstabulation Gender to QWL 5
Categorizations
Gender
Quality of Work Life
(Categorization)
Total
1 2 3 4 5
Male 2 17 25 11 4 59
Female 5 21 47 17 1 91
Total 7 38 72 28 5 150
Source: Researcher’s own SPSS Result, 2018
Similar to the previous table, according to Table
9, the sig.
score also rejects the relationship and
any impacts from gender to QWL by scoreof 0.296.
This means for this research, all respondents come
from both gender (male and female) tend to have a
balance level of QWL.
Table 10: Crosstabulation Gender to WLB 3
Categorizations
Gender
Work-Life Balance
(Categorization)
Total
1 2 3
Male 3 20 36 59
Female 5 30 56 91
Total 8 50 92 150
Source: Researcher’s own SPSS Result, 2018
Based on Table 10, the researcher finds that
gender does not give any impacts to WLB based on
the sig.
score, 0.989. To support this finding, the
researcher did another test which between gender to
WLB in five categorizations.
Table 11: Crosstabulation Gender to WLB 5
Categorizations
Gender
Work-Life Balance (Categorization)
Total
1 2 3 4 5
Male 0 6 38 14 1 59
Female 3 3 65 17 3 91
Total 3 9 103 31 4 150
Source: Researcher’s own SPSS Result, 2018
Based on Table 11, this test was done by
compiling data of gender variable to WLB,and the
categorization has been spread into five to see the
relationship from both variables thoroughly. The sig.
score for this test is at 0.214 which support the
previous test and rejects the researcher’s hypothesis.
This means, ones’ work life balance does not
affected by gender.
Marital Status
This research divides marital status into three
classifications: single, married, widowed. The
researcher will do four test for this variable. Two
tests to know the connection (impact) between
ICRI 2018 - International Conference Recent Innovation
2622

marital status to QWL (3 and 5 categorizations) also
another to between marital status to WLB (3 and 5
categorizations).
Table 12: Crosstabulation Marital Status to QWL 3
Categorizations
Marital
Status
Quality of Work Life
(Categorization)
Total
1 2 3
Single 13 84 12 109
Married 2 31 3 36
Widowed 0 5 0 5
Total 15 120 15 150
Source: Researcher’s own SPSS Result, 2018
As shown in Table 12, this test was done by
compiling data from the marital status variable and
quality of work life. The sig.
score for this test is
at 0.581 which shows there is no relationship
between marital status and QWL and rejects the
researcher’s hypothesis
Table 13: Crosstabulation Marital Status to QWL 5
Categorizations
Marital
Status
Quality of Work Life (Categorization)
Total
1 2 3 4 5
Single 7 23 52 23 4 109
Married 0 12 19 4 1 36
Widowed 0 3 1 1 0 5
Total 7 38 72 28 5 150
Source: Researcher’s own SPSS Result, 2018
To support the previous finding, the researcher
did another test which broadensthe quality of work
life variable to five categorizations as shown in
Table 13. According to sig.
test, the researcher got
the score at 0.313 which rejects the researcher’s
hypothesis. In another word, marital status does not
give any impact to ones’ work life balance.
Table 14: Crosstabulation Marital Status to WLB 3
Categorizations
Marital
Status
Work-Life Balance (Categorization)
Total
1 2 3
Single 7 34 68 109
Married 1 13 22 36
Widowed 0 3 2 5
Total 8 50 92 150
Source: Researcher’s own SPSS Result, 2018
After compiling data and did test to marital status
and quality of work life, the researcher did two more
tests. This test is between marital status to work-
lifebalance in three categorizations as shown in
Table 14. From sig.
score, 0.620 it shows that
marital status does not give any impact to work life
balance and rejects the researcher’s hypothesis.
Table 15:Crosstabulation Marital Status to WLB 5
Categorizations
Marital
Status
Work-Life Balance (Categorization)
Total
1 2 3 4 5
Single 3 6 73 23 4 109
Married 0 2 26 8 0 36
Widowed 0 1 4 0 0 5
Total 3 9 103 31 4 150
Source: Researcher’s own SPSS Result, 2018
This last test was done to support the previous
finding. Based on Table 15, from sig.
test, the
researcher found the score is at 0.690. This test
result is similar to the previous test and also rejects
the researcher’s hypothesis which means marital
status does not give any impacts to ones’ work life
balance.
Results Analysis
In this research, demographics are presented by
three variables: age, gender and marital status while
quality and work life and work-life balance present
themselves. In the calculation method, all
demographics were tested to each Y variable with
two categorizations (three and five). Results show
that from 12 tests, 11 tests indicate invalidation of
the hypotheses (sig.
> 0.05) and only one test
appears to confirm the researcher’s hypothesis (sig.
<0.05).
Table 16: Sig. Chi-square Test Result Demographics to
QWL
Hypothesis
Hypothesis
Statement
Sig.
score
Interpretation
H1a
Age is related to
the quality of
work life
0.696 Age is not related
to the quality of
work life
0.935
H1b
Gender is
related to the
quality of work
life
0.71 Gender is not
related to the
quality of work
life
0.296
H1c
Marital status is
related to the
quality of work
life
0.581 Marital status is
not related to the
quality of work
life
0.313
Source: Researcher’s own SPSS Result, 2018
As shown in Table 16, the data show based on
test all hypotheses are rejected (
> 0.05). H1a is
rejected from this test based on the
test. Age,
gender, and marital status are not related to ones’
quality of work life. This score means that no matter
how young or old is someone, their quality of work
How Demographics Affect Quality of Work Life and Work-Life Balance
2623

life will not be affected by it and contrast with
Anyaoku’s (2016) study that states about QWL is
significantly related to age. Although, in five
categorization the results come in more detail which
shows respondents also have a tendency to move
from medium to low level or medium to high level.
After finding the relationship between age and
QWL, the researcher did a test to find the
relationship between gender and QWL. This
research starts with the initiative about how women
often become the object of QWL and WLB studies
with low attention to men. The table above shows
that there is no relationship between gender to QWL
(
> 0.05). Which means, men and women do not
have a significant different level of QWL thus, make
H1b is rejected. This may be explained from
respondents’ job that does not provide any
differences between male and female workers. Since
all workers have the same responsibilities, it makes
employees feel that they are equal and make a good
relationship between all workers.
Another test is to find a relationship between
marital status and QWL. It appears that marital
status is not related to QWL (
> 0.05), rejects
H1c. This shows that in every status each respondent
has, it does not have any impact on their quality of
work life level. The results can be happened since
the respondents taken for this research is too
homogenous (single) that makes the data calculation
be tendentious to one data and make the result
unrelated to another one.
Table 17: Sig. Chi-square Test Result Demographics to
WLB
Hypothesis
Hypothesis
Statement
score
Interpretation
H2a
Age is related
to work-life
balance
0.036
Age is related
to work-life
balance
H2b
Gender is
related to
work-life
balance
0.989 Gender is not
related to the
quality of work
life
0.214
H2c
Marital status
is related to
work-life
balance
0.620 Marital status
is not related to
the quality of
work life
0.690
Source: Researcher’s own SPSS Result, 2018
The latest tests were done to find the result of
those three hypotheses given by the researcher.
From the Table 17, p-value only confirms H2a
which stated age is related to work-life balance.
From this research, it shows that the younger
respondents tend to have high work-life balance
level than the older respondents. This against the
perception that older respondents may have a high
level of work-life balance.
In contrast to Poulouse and Sudarsan (2014)
study which shows gender is related to WLB, this
research shows that gender is not related to WLB
(
> 0.05), rejects H2b. The rejection may come
from many aspects. The respondents used in this
research may not come in the balance amount thus
make the information given becomes more
tendentios into only one gender. In another side, the
contrast result may also come from the balance work
and no discrimination applied at a workplace that
makes workload between male and female workers
are no far from different. Thus, make all workers
have a possible chance to spend their after-work
time with their personal life longer.
From gender, the latest test is done between
marital status and work-life balance. The
score
for this test is > 0.05 which shows there is no
relationship between marital status and work life
balance. The rejection of H2c may come from some
causes for the example, the homogenous data from
the respondents and there is a significant difference
from one cluster to others. Data used in this research
comes from 73% single respondents. This means,
the score from the calculation may not represent the
whole respondents since there is a significant
difference of three clusters used in this research.
This make this research’s finding contrast with
Thriveni and Rama (2012) that states demographics
(marital status) has a significant relationship with
work life balance. Instead, this research matches the
finding from Panisoara and Serban (2013) that states
marital status has no relationship with work life
balance.
The results of this study are not consistent with
the result of the previous study, Anyaoku (2016) that
shows there is a relationship of age to QWL. Also is
not consistent with Poulouse and Sudarsan (2014)
about their review that states there is a relationship
between demographics to WLB. Moreover, the
cause of major rejection in this study may come
from the majority of answers from respondents. In
QWL part, the average of respondents answer agree
95 throughout all statements that over 100
respondents agree they work in a nice building
company, get good facilities from their workplace,
they participated in sounding their opinion, satisfied
at their work, and have good coworkers.
While in WLB part, the answers vary between
disagree and agree,but the majority is still in “agree”
ICRI 2018 - International Conference Recent Innovation
2624

part with 70 respondents. From that, over 100
respondents agree they work,or they job encourage
them to enjoy their personal life.Although, this study
may be consistent with other studies. The different
results of this study with other may come from the
characteristics of the respondents used that is too
homogenous, the psychological condition of the
respondents when filling in this questionnaire, and
also how the respondents react to the questionnaire.
4.2 Research Findings
Based on this research, there are some findings can
be found from each Y variable. Quality of work life
and work-life balance may be affected by
demographics if some certain conditions applied to
the respondents and also the researcher uses certain
measurements to classify which respondents can be
used as the respondent in the research. Thus, data
used in this research did not support the hypotheses,
certain conditions such as time and the current
condition when the respondents answer the
questionnaire, the level of understanding when the
respondent read the questionnaire and also honesty
level of what the respondent truly feel may affect the
answers given. Certain measurements that may be
needed can be about how many respondents needed
for each cluster.
Age is not related to the quality of work life from
the
score result, 0.696 and 0.935. Gender also is
not related to the quality of work life from the
score result 0.71 and 0.296. The last, marital
status is also not related to the quality of work life
from the
score 0.581 and 0.313. From all the tests
score above H1 is rejected. In contrast, age is related
to work life balance with
score 0.045 that
confirms H2a. But the following score tests for
gender to work life balance are at 0.433 and
0.821,also another latest score tests marital status to
work life balance are at 0.098 ad 0.894. In another
word, H2b and H2c are rejected.
4.3 Results Limitations
There are some limitations for this research that may
give some insights for the next research as
corrections, those are:
a. There are only 150 respondents used in this
research.
b. This research used too homogenous
respondents, means majority respondents used
in this research are either in one or two clusters
of demographic variables. This research used
respondents majority age 21-25, female, and
single.
c. Respondents may respond to the questionnaire
with anunclear statement. This may happen if
the respondents do not understand the
statement.
d. Variables used in this research are only two
without intervening connection.
5 CONCLUSIONS
5.1 Summary
This study observed how demographics related to
the quality of work life and work-life balance.
Alternatively, in another word, is there any impact
from demographics of ones’ life to their quality of
work life and work-life balance. Literature review
for these variables may vary with a different
result,but most of them are a study about women.
Based on the tests had taken, there are six
findings that among those six, five of them rejects
the hypotheses.The results are explained as follow:
a. Age is not related to the quality of work life.
This means, whether the person is relatively
young or old, their quality of work life will not
be affected. Younger people can have a high
level of quality of work life,and older people also
can have the same level as younger people.
b. Gender is not related to the quality of work life.
This result shows that male and female workers
can have the same level of quality of work life.
c. Marital status is not related to the quality of work
life. People with single, married or widowed
status can have the same level of quality of work
life. This means, having own family does not
give any impact of ones’ quality of work life.
d. Age is related to work-life balance. In this result,
Age does give any impact of ones’ work-life
balance. For this research, it shows that younger
people tend to have a high level of work-life
balance. While in contrast, older people tend to
have a lower level of work-life balance.
e. Gender is not related to work-life balance. In this
category, the researcher does not find any impact
from gender to work-life balance.
f. Marital status is not related to work-life balance.
This means, in any status of a person it does not
give any impact to ones’ work-life balance.
How Demographics Affect Quality of Work Life and Work-Life Balance
2625

5.2 Recommendations
Based on the results had shown above, the
researcher has some recommendations as follow:
a. For employer around Jakarta and Tangerang
Quality of work life and work-life balance are
two important things that caught more and more
attention lately. This means, in years to come
employee will not only looking for work with a
goodsalary but also with good facilities and
flexibilities to the employee. To attract high
potential employees, the employerneeds to be
more flexible to give an adequate salary, fair
bonus and at least a basic facility to all
employees. For the example, nursery room, fair
leaves days for all employees and vehicle to rent
or borrow for employees who urgently needed.
b. For the successor of this research
This research used respondents that being a
majority in this research. This makes this
research’s P-value be affected. Thus, to have a
fair result, diversity of respondents may need. In
another option, a balance amount of respondent
can produce a fair result.
5.3 Implications
There are two implications can be used from this
research, they are:
a. Practical Implication
This research may be implied in daily life by the
employer to increase their employees quality of
work life and work-life balance. Readers also can
imply this research findings by trying to put all
lives domains in an equal balance. In another
side, many employers prefer to hire single
candidates as an employee because most
employers are afraid that married employees may
put their personal life as a priority of work. Since
this research shows that marital status is not
related to either quality of work life and work-
life balance, thus, employers may need not to
doubt the integrity of married workers.
b. Theoretical Implication
The researcher hopes that the result of this
research may bring new insight to employers
about how the quality of work life and work-life
balance level of employees in the hospitality
industry in Jakarta and Tangerang.
REFERENCES
Ahmad, S. (2017). The Co-Relation Between Qwl And
Demographic Factors Of Private University
Employees In India. PEOPLE: International Journal
of Social Sciences, 3(2).
Anyaoku, E. N. (2016). Demographic Determinants of
Quality of Work Life of Librarians Working in
Nigeria. International Journal of Advanced Library
and Information Science, 4(1): 312.
Azwar, S. (2015). Penyusunan Skala Psikologi.
Yogyakarta : Pustaka Pelajar.
Bolarinwa, O. A. (2015). Principles and methods of
validity and reliability testing of questionnaires used in
social and health science researches. Nigerian
Postgraduate Medical Journal, 22(4): 195.
Collingridge, D. (2014). Validating a Questionnaire. 13
December. Retrieved from
https://www.methodspace.com/validating-a-
questionnaire/
Hamdani, T. (2017). Ada 4 Juta Pekerja Butuh Tempat
Tinggal di Jakarta. 17 November. Retrieved from
https://economy.okezone.com/read/2017/05/03/470/16
82113/ada-4-juta-pekerja-butuh-tempat-tinggal-di-
jakarta
Kothari, C.R. (2004). Research Methodology: Methods
and Techniques. New Delhi: New Age International
(P) Limited, Publishers.
Lund Research. (2012). Laerd Dissertation: Purposive
Sampling. 13 December. Retrieved from
dissertation.laerd.com/purposive-sampling.php
Marcinkus, W. C., Whelan-Berry, K. S., and Gordon, J. R.
(2007). The relationship of social support to the work-
family balance and work outcomes of midlife women.
Women in Management Review, 22(2): 86-111.
Mirkamali, S. M., and Thani, F. N. (2011). A study on the
quality of work life (QWL) among faculty members of
University of Tehran (UT) and Sharif University of
Technology (SUT). Procedia-Social and Behavioral
Sciences, 29: 179-187.
Panisoara, G., & Serban, M. (2013). Marital status and
work-life balance. Procedia-Social and Behavioral
Sciences, 78: 21-25.
Poulouse, S., and Sudarsan, N. (2014). Work Life
Balance: A Conceptual Review. International Journal
of Advances in Management and Economics, 3: 01-17.
Priherdityo, E. (2016). Wanita Karir Indonesia Terbanyak
Keenam di Dunia.12 November. Retrieved from
https://www.cnnindonesia.com/gaya-
hidup/20160308121332-277-116053/wanita-karier-
indonesia-terbanyak-keenam-di-dunia/
PWC. (2017). PWC: Work-Life Balance. 17 November.
Retrieved from
https://www.pwc.com/id/en/careers/why-pwc/work-
life-balance
Rao, T. S. S., and Vishal, I. (2010). Work, family or
personal life: Why not all three? Indian Journal of
Psychiatry, 52(4): 295–297.
Siregar, S. (2016). Statistika Deskriptif untuk Penelitian.
Jakarta : Rajawali Pers.
ICRI 2018 - International Conference Recent Innovation
2626

Spss, Brother. (2015). How to Test Validity
Questionnaires using SPSS. 13 December. Retrieved
from http://www.spsstests.com/2015/02/how-to-test-
validity-questionnaire.htm
Statisticshowto. (2017). Expected Frequency: Definition,
Formula, Calculation. 13 December. Retrieved from
http://www.statisticshowto.com/expected-frequency/
Sumiyatiningsih, D. (2014). Pergeseran Peran Laki-laki
dan Perempuan dalam Kajian Feminis. WASKITA
Jurnal Studi Agama dan Masyarakat.
Thriveni, K. K., and Devi, V. R. (2012). Impact of
Demographic Variables on Work-Life Balance of
Women Employees (with special reference to
Bangalore City). International Journal of Advances in
Management and Economics, 1.
Tomazevic, N., Kozjek, T., and Stare, J. (2014). The
Consequences of a Work-Family (Im) balance: From
the Point of View of Employers and Employees.
International Business Research, 7(8): 83.
White, P. (2007). What is the Purpose of Work? 04
October. Retrieved from
http://www.drpaulwhite.com/what-is-the-purpose-of-
work/
How Demographics Affect Quality of Work Life and Work-Life Balance
2627
