
Service Quality as Mediation Variable between Online
Transportation Image and Interaction Quality and Consumer
Satisfaction
Arief Adhy Kurniawan
1
, Berlilana
1
, Sri Murni Setyawati
2
1
Teknik Informatika, STMIK AMIKOM Purwokerto, Central Java, Indonesia
2
Economic Faculty, Jenderal Soedirman University, Central Java, Indonesia
Keywords: Satisfaction of online consumer transportation.
Abstract: This study discusses service quality as a mediating variable between corporate image and quality of interaction
with customer satisfaction. This study was conducted on consumers of online transportation services in
Purwokerto. The sample size for the study was 105 respondents. Data analysis techniques were done by path
analysis with AMOS software. The results of data analysis obtained consumer satisfaction influenced by the
quality of service. Service quality is influenced by the company's image and the quality of interaction. Service
quality is able to be a mediating variable between company image and interaction quality.
1 INTRODUCTION
Corporate image is a variable that plays an important
role in the formation of intentions. The Image is
defined in the mind of the buyer, partly by its
functional quality and partly by the aura of
psychological attributes (Martineau, 1958). The
image is shaped by the customer as a result of the
overall evaluation of the company and its offering, or
even assesses the image projected by a particular
product category (LeBlanc & Nguyen, 1996). Some
researchers suggest that imagery is included in the
theoretical framework of customer decision making
(Brunner, Stöcklin, & Opwis, 2008). So that the
image is not lost, the company tries to improve the
quality of its services. The results of the study by Han
and Hyun (2017) show that there is a positive
influence on the company's image on service quality,
this shows that companies that have a good image will
provide quality services so that their image becomes
stronger in the minds of consumers. The Corporate
image also affects consumer loyalty, namely the
better the image of a company, the more loyal the
consumer is to a company (Kandampully &
Suhartanto, 2000).
Consumer loyalty is a consumer who has a strong
desire to buy back or subscribe to a product or service
that is consistently preferred in the future, giving rise
to the purchase of the same brand or brand series
repeatedly, despite the situational influence and
marketing efforts that have the potential to cause
brand switching behavior (Oliver, 1999). To
minimize the shift of consumers to other brands or
other services the company strives that what is done
in providing services to consumers can provide
satisfaction to consumers. Consumer satisfaction is
important to note because customer satisfaction
determines consumer loyalty (El-Adly & Eid, 2016;
Han & Hyun, 2018).
The satisfaction that the company builds with
service and instills a good perception of services.
Perceptions that can be formed from consumers
include corporate images. The existence of these
perceptions, consumers will prove what they perceive
to be a satisfaction. Corporate image or image is a
company image that is built by brand associations that
relate to a habit, lifestyle, benefits, product attributes,
geographical, price, competitors, celebrities and
others (Durianto & Sugiarto, 2001). Building an
important image for the company when competition
is intense. As happened in the transportation business
competition that uses technology services such as Go-
Jek. The strength of the company's image needs to be
maintained and enhanced to obtain consumers and
make consumers satisfied. This shows the importance
of the company's image to improve customer
satisfaction, in accordance with the results of the
Adhy Kurniawan, A., Berlilana, . and Murni Setyawati, S.
Service Quality as Mediation Variable between Online Transportation Image and Interaction Quality and Consumer Satisfaction.
DOI: 10.5220/0009947830993106
In Proceedings of the 1st International Conference on Recent Innovations (ICRI 2018), pages 3099-3106
ISBN: 978-989-758-458-9
Copyright
c
2020 by SCITEPRESS – Science and Technology Publications, Lda. All rights reserved
3099

study (Lahap, Ramli, Said, Radzi, & Zain, 2016). Tse
and Wilton (1988) state that subjects in a good
performance will make consumers feel more
satisfied. Ladhari, Souiden, and Dufour (2017) stated
that one of the variables that influence consumer
satisfaction is service quality. Kandampully (2000)
states that a company's competitive advantage can
begin with service quality. The quality of the service
makes the product sold more valuable.
Companies that pay attention to the quality of
interaction will make the service better, so that the
better the quality of interaction, the better the quality
of service. This is in accordance with the results of
the study can be seen that there is a positive effect of
interaction quality on service quality (Clemes, Gan,
& Ren, 2011; Wu & Cheng, 2013). In addition, the
quality of interaction also affects consumer
satisfaction. This is consistent with the research (Joon
Choi & Sik Kim, 2013), which states that there is a
positive influence on the quality of interaction on
consumer papacy, meaning that the better the quality
of interaction, the more satisfied consumers will be in
the transaction.
From the results of previous research, there is a
problem or research gap, namely, some research
results suggest that service quality affects consumer
satisfaction and loyalty. But there are studies that
show no influence between variables studied, namely
Beerli, Martin, and Quintana (2004) obtain perceived
quality and satisfaction research results which are
variables that do not influence each other. Caruana
(2002) obtained the results of service quality research
affecting consumer satisfaction but did not affect
consumer loyalty. In the study of Wallin Andreassen
and Lindestad (1998), the problem is that the value
and perception of quality do not affect consumer
satisfaction and high consumers of consumer
satisfaction are not the main pathway towards
consumer loyalty rather than corporate image. In low-
level consumers, the image of the company becomes
the main pathway towards consumer loyalty rather
than consumer satisfaction. The existence of a
research gap as stated above then built a model of the
relationship between the variables of corporate
image, service quality, quality of interaction and
customer satisfaction.
2 THEORETICAL
BACKGROUND AND
HYPOTHESIS
2.1 Image
Keller (1993) defines the overall image as a
perception of a company as reflected in the
relationship between consumers and companies
recorded in customer memory. Imagery is described
as the overall perception of a product or company that
is developed which ultimately is based on information
obtained and processed (Assael, 1984). The image is
also defined as the overall image refers to the beliefs,
impressions, and ideas of consumers about the
company, brand, product, service, or purpose (Rein,
Kotler, & Haider, 1993). According to (Bolton &
Drew, 1991) corporate image has a positive effect on
consumer satisfaction. From the results of the study
(Wallin Andreassen & Lindestad, 1998) also obtained
that corporate image has a positive effect on customer
satisfaction. A good corporate image will be
maintained by the company by providing services that
should be better. This is in accordance with the results
of the study by Han and Hyun (2017). This shows that
the better the company image, the better the quality
of service. Therefore in this study, the following
hypothesis was formulated:
H
1
: Company image has a positive effect on
customer satisfaction online transportation
services
H
2
: Company image has a positive effect on the
quality of online transportation services
2.2 Service Quality
In service quality research, measurement of customer
expectations in service companies is measured,
namely customer trust in service companies
compared to perceptions regarding the reality of
services received (Parasuraman, Zeithaml, & Berry,
1985). There are five factors in service quality
(Parasuraman et al., 1985), namely:
a. Reliability, namely the ability to provide
promised services immediately, accurately and
satisfactorily.
b. Responsiveness, namely the desire of staff to
assist customers and provide responsive services.
c. Assurance, including the knowledge, competence,
politeness, and trustworthiness of the staff, free
from danger, risk or doubt.
d. Empathy, including the ease of establishing
relationships, good communication, personal
ICRI 2018 - International Conference Recent Innovation
3100

attention, and understanding of the customer's
individual needs.
e. Tangibles, including physical facilities,
equipment, employees and means of
communication.
Consumers expect good service for every
transaction made. If the service provided is good, the
consumer will feel the satisfaction of the transaction.
Based on research by Ladhari et al. (2017) one of the
variables that influence consumer satisfaction is the
quality of service. Therefore in this study, the
following hypothesis was formulated:
H
3
: Service quality has a positive effect on customer
satisfaction online transportation services
2.3 Interaction Quality
The interaction quality is defined as positive results
derived from the verbal conversation and information
exchange between service providers or companies
and customers (Auh, 2005) More than that in this
interaction the customer is involved in a deeper
interaction, the quality, and depth of the
conversational interaction is very clear. So, build the
quality of interaction involvement experienced by
customers from a dialogue with service providers.
The quality of this interaction builds more narrowly
in scope and touches especially the quality of
relationships that are built from engaging in an
interactive conversation.
Consumers interact with the company through
designated employees who can improve service
quality. The better the quality of interaction, the better
the quality of service. This is consistent with research
This is consistent with the results of the study
(Clemes et al., 2011; Wu & Cheng, 2013), which
states that there is a positive influence on interaction
quality on service quality. Caruana's (2002) study
obtained the results of service quality research
affecting consumer satisfaction. Consumers will feel
satisfaction if the interaction is done in accordance
with expectations. This shows that the better the
quality of interaction, the more satisfied a consumer
is. This is consistent with the research (Joon Choi &
Sik Kim, 2013), which states that there is a positive
influence on the quality of interaction on consumer
papacy, meaning that the better the quality of
interaction, the more satisfied consumers will be in
the transaction. Therefore in this study, the following
hypothesis was formulated:
H
4
: The quality of interaction has a positive effect
on the quality of online transportation services
H
5
: Quality of interaction has a positive effect on
customer satisfaction online transportation
services
The existence of research that shows the influence
of image on service quality (Bolton & Drew, 1991;
Wallin Andreassen & Lindestad, 1998) and the
quality of service to customer satisfaction (Caruana,
2002; Ladhari et al. (2017)). In addition, there are also
research results that show the quality of interaction on
service quality (Clemes et al., 2011; Wu & Cheng,
2013), which states that there is a positive influence
on interaction quality on service quality. This shows
the variable quality of service to mediate between
image and quality of interaction with customer
satisfaction. Therefore in this study, the following
hypothesis was formulated:
H
6
: Quality of service as a mediation between the
image of customer satisfaction
H
7
: Service quality is a mediation between the
quality of interaction with customer satisfaction
3 METHODS
3.1 Procedure
The research was conducted by survey method to
consumers of online transportation services in
Purwokerto. The study was conducted with a research
instrument in the form of a closed questionnaire with
an alternative bipolar adjective answer scale 1 to 10.
This scale is a refinement of the semantic scale with
gelatin response which can be an interval scale. Each
respondent is used to indicate or disagree on each
statement given an interval scale using the 10-point
Bipolar Adjective technique. This is done by only
bringing two extreme categories (Ferdinand, 2002).
The hypothesis testing procedure is carried out
using analysis with structural equation modeling
software. Testing the first hypothesis up to the
hypothesis that is done to see the value of the Critical
Ratio. Mediation testing is carried out by procedures
developed by Sobel (Ghozali, 2006) and known as the
Sobel test (Sobel test).
3.2 Measures
This study examines the relationship between image,
service quality, interaction quality and customer
satisfaction variables. Images are measured by six
indicators of company image according to (Bloemer
& De Ruyter, 1998), namely location, merchandise,
customer service, price, advertising, and personal
selling. Service quality is measured by the indicators
Service Quality as Mediation Variable between Online Transportation Image and Interaction Quality and Consumer Satisfaction
3101

used by Parasuraman et al. (1985) who conducted
special research on several types of services and
managed to identify the five main factors that
determine service quality, namely reliability,
responsiveness, assurance, empathy, and tangibles.
The quality of interaction is measured by indicators
of relationship satisfaction, commitment, intimacy,
trust, passion, and love (Fletcher, Simpson, &
Thomas, 2000). Consumer satisfaction is measured
by the indicators used (Dimitriades, 2006), namely
overall satisfaction with the company, the company
always meets consumer expectations, interesting
experiences and never forgets the company.
4 RESULT
Figure 1 shows the results of the path analysis and the
significance test can be seen in Figure 1 and Table 1.
Table 1: Results of hypothesis testing
Exogenous-
Endogenous
Estimat
ed
S.E T value P
value
Image-
Consumer
satisfaction
-0.032 0,130 -0,382 0,702
Image- Service
Quality
0,286 0,120 2,897 0,004
Service Quality-
Consumer
satisfaction
0,478 0,125 4,917 0,000
Interaction
Quality- Service
Quality
0,439 0,092 4,414 0,000
Interaction
Quality-
Consumer
satisfaction
0,423 0,106 4,727 0,000
Figure 1 shows the results of path analysis and the
value of the Goodness of fit index. Goodness of index
value consists of chi-square = 260,025, probability =
0,000, Cmin / df = 1,42, RMSEA = 0,064, GFI =
0,817, AGFI = 0,770, CFI = 0,960 and TLI = 0.955.
The goodness of fit index provides information that
there is still an indicator of the Goodness of fit index
that has not indicated that the model is fit, ie chi-
square with a probability of 0,000 (less than 0.05), the
value of GFI and AGFI is less than 0.9. There is a
goodness of fit index value that provides information
on the indicator Goodness of fit index which shows
that the model is fit, ie Cmin/df less than 2, RMSEA
is less than 0.08, the value of CFI and TLI is more than
0.95. Based on the value of the Goodness of Fit, the
index shows that the model used in this study cannot
be used as a solid model, because there is still a
goodness of fit index that is marginal (Chi-square,
probability, GFI and AGFI). Path coefficients and
significance tests are shown in Table 1. The Goodness
of index score consists of chi-square = 260.025,
probability = 0,000, Cmin / df = 1.42, RMSEA =
0.064, GFI = 0.817, AGFI = 0.770, CFI = 0.960 and
TLI = 0.955. The value of the goodness of fit index
provides information on the Goodness of fit index
indicating that the model is fit, ie chi-square with
probability 0.000 (less than 0.05), GFI and AGFI
value less than 0.9. There is a value of the goodness of
the fit index which gives the Goodness of fit index
indicating that the model is fit, ie Cmin / df less than
2, RMSEA less than 0.08, CFI and TLI values greater
than 0.95. Based on the value of Goodness of fit index
indicates that the model used in this study can not be
used as a solid model, because there is still a goodness
of fit index is marginal (Chi-square, probability, GFI
and AGFI).
Based on Table 1, it can be seen that the
standardized estimated image value of consumer
satisfaction is -0.032, t = -0.382 and P = 0.702. So H0
is accepted, meaning that the image does not affect
consumer satisfaction, so the results of the analysis do
not support the first hypothesis. The standardized
estimated image value of service quality is 0.286, t =
2.897 and P = 0.004. So H0 is rejected, meaning that
the image influences service quality, so the results of
the analysis support the second hypothesis. The value
of the standardized estimated service quality against
consumer satisfaction is 0.478, t = 4.917 and P =
0.000. So H0 is rejected, meaning service quality
affects consumer satisfaction, so the results of the
analysis support the third hypothesis. The
standardized estimated interaction quality value of
service quality is 0.439, t = 4.414 and P = 0.000. So
H0 is accepted, meaning that interaction quality
affects service quality, so the results of the analysis
support the fourth hypothesis. The standardized
estimated interaction quality value for consumer
satisfaction is 0.423, t = 4.727 and P = 0.000. So H0
is rejected, meaning that interaction quality affects
consumer satisfaction, so the results of the analysis
support the fifth hypothesis.
Table 2 shows the results of the mediation test
with Sobel t-test. The result of image-service quality-
consumer satisfaction mediation was 2.0226 with p =
0.0431. This shows the service quality variable can be
a mediating variable between image and consumer
satisfaction, thus supporting the sixth hypothesis. The
results of the mediation test interaction quality-
service quality-consumer
ICRI 2018 - International Conference Recent Innovation
3102
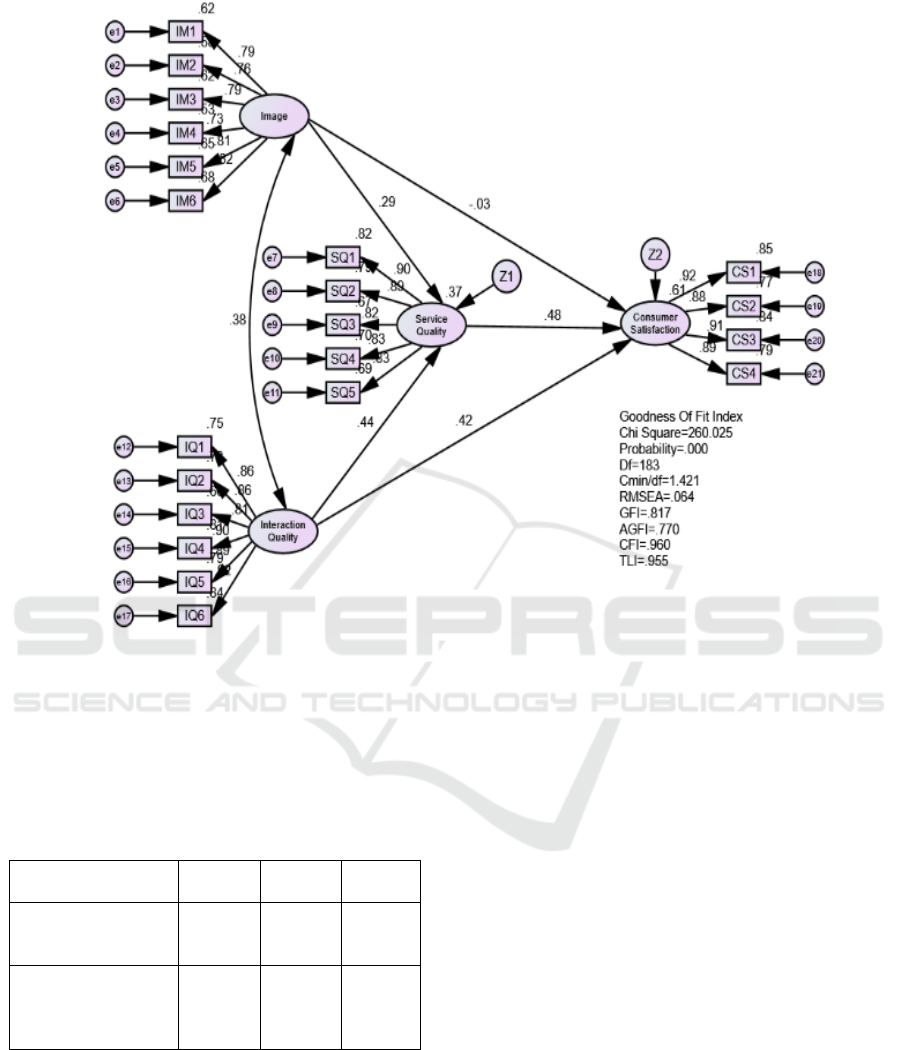
Figure 1: Research Model
satisfaction is 2.9840 with p = 0.0028. This shows the
service quality variable can be a mediating variable
between interaction quality and consumer
satisfaction, thus supporting the seventh hypothesis
Table 2. The mediating effect of the image, interaction
quality, service quality, and consumer satisfaction
5 DISCUSSION
The results of this study indicate a model that is not
fit based on chi-square, probability, GFI and AGFI so
that only discussion of the relationships between
variables in the research hypothesis. Based on the
results of hypothesis testing it can be seen that the
image variable has no effect on customer satisfaction.
The results of this study are different with Bolton &
Drew (1991), Wallin Andreassen & Lindestad
(1998). This difference is motivated by the character
of the sample, in the study of Wallin Andreassen and
Lindestad (1998) using a sample of consumers with
high-cost travel packages, rarely traveling with travel
packages. In contrast to consumers, online-based
transportation services that can be obtained at a low
cost and consumers tend to often use online-based
transportation services. In previous studies, travel
packages were enjoyed with a rare frequency, so
when using the service, it was not a matter of cost and
expected a trip with a classy image, so that the image
had an effect on consumer satisfaction. Consumers of
online-based transportation services allow it to be
used for everyday transportation, so consumers need
cheaper costs and do not question the image of the
transportation service provider company. This results
in the company's image not affecting consumer
satisfaction.
The results of the study show that service quality
affects consumer satisfaction. The results of this
Independen
Variable
t hitung P Value Result
Image- Serv
Quality- Consumer
satisfaction
2,0226 0,0431 Support
Interaction quality -
Serv Quality-
Consumer
satisfaction
2.9840 0,0028 Support
Service Quality as Mediation Variable between Online Transportation Image and Interaction Quality and Consumer Satisfaction
3103

study support Han & Hyun (2017). Service quality
affects consumer satisfaction, meaning that the better
the service provided by the driver of transportation
services, the more satisfied consumers will be. Han &
Hyun (2017) is done in dominant restaurants selling
products and services. Products sold in the form of
food menus, while services sold in the form of a
restaurant atmosphere and various services to
consumers. Although there are differences in the
character of consumers, there are similarities in terms
of services, so the service business that is sold
coupled with good service can make consumers feel
satisfied.
The results of this study also show that interaction
quality affects
service quality. The results of this study
support previous research conducted by (Clemes et
al., 2011; Wu & Cheng, 2013). The results of this
study support the previous research with the
background of the respondent's character together in
the service company, Clemes et al. (2011) conducted
research on motel service companies, while Wu and
Cheng (2013) conducted research on aviation
transportation services. The similarity of the
respondent's character opportunities for the results of
mutual support is getting bigger. The results of this
study also show that interaction quality affects
consumer satisfaction. This shows that the better the
quality of interaction, the more satisfied.
6 CONCLUSION
This study resulted in the conclusion of the study that
the improvement of application-based transportation
company image was able to improve service quality,
but was not able to improve customer satisfaction.
This study also concluded that improving the quality
of interaction between drivers and consumers was
able to improve service quality and customer
satisfaction. The quality of interaction has a more
significant effect on service quality compared to the
image. Service quality has a more significant
influence on customer satisfaction compared to
company image. The placement of service quality
variables as mediation variables turned out to be
important in this model, it was proven that service
quality variables were able to mediate the relationship
between image variables and customer satisfaction
and the quality of interaction with customer
satisfaction.
7 MANAGERIAL IMPLICATION
This research produces practical implications for
online transportation service providers, should
improve customer satisfaction by improving the
image of online transportation companies,
encouraging the driver to better interact with
consumers and provide better quality services to
consumers.
8 LIMITATION AND FUTURE
RESEARCH
The limitation of this study is that in measuring
customer satisfaction it does not identify consumer
behavior in using other transportation services, so
satisfaction is only from the point of view of
transportation services. In subsequent studies, it is
expected that there will be additional moderation
variables that lead to consumer satisfaction from
consumers who have used other online transportation
services that use cars as a means of transportation
services.
REFERENCES
Assael, H. (1984). Consumer behavior and marketing
action: Kent Pub. Co.
Auh, S. (2005). The effects of soft and hard service
attributes on loyalty: the mediating role of trust. Journal
of Services Marketing, 19(2), 80-92.
Beerli, A., Martin, J. D., & Quintana, A. (2004). A model
of customer loyalty in the retail banking market.
European Journal of Marketing, 38(1/2), 253-275.
Bloemer, J., & De Ruyter, K. (1998). On the relationship
between store image, store satisfaction and store
loyalty. European Journal of Marketing, 32(5/6), 499-
513.
Bolton, R. N., & Drew, J. H. (1991). A multistage model of
customers' assessments of service quality and value.
Journal of consumer research, 17(4), 375-384.
Brunner, T. A., Stöcklin, M., & Opwis, K. (2008).
Satisfaction, image and loyalty: new versus
experienced customers. European journal of marketing,
42(9/10), 1095-1105.
Caruana, A. (2002). Service loyalty: The effects of service
quality and the mediating role of customer satisfaction.
European Journal of Marketing, 36(7/8), 811-828.
Cho, Y. K. (2015). Creating customer repurchase intention
in Internet retailing: The effects of multiple service
events and product type. Journal of Retailing and
Consumer Services, 22, 213-222.
Clemes, M. D., Gan, C., & Ren, M. (2011). Synthesizing
the effects of service quality, value, and customer
ICRI 2018 - International Conference Recent Innovation
3104

satisfaction on behavioral intentions in the motel
industry: An empirical analysis. Journal of Hospitality
& Tourism Research, 35(4), 530-568.
Dimitriades, Z. S. (2006). Customer satisfaction, loyalty
and commitment in service organizations: Some
evidence from Greece. Management Research News,
29(12), 782-800.
Doyle, P., & Fenwick, I. (1974). How store image affects
shopping habits in grocery chains. Journal of Retailing,
50(4), 39-52.
Durianto, D., & Sugiarto, T. S. (2001). Strategi
Menaklukkan Pasar Melalui Riset Ekuitas dan Perilaku
Merek. Jakarta: Gramedia Pustaka Utama.
El-Adly, M. I., & Eid, R. (2016). An empirical study of the
relationship between shopping environment, customer
perceived value, satisfaction, and loyalty in the UAE
malls context. Journal of Retailing and Consumer
Services, 31, 217-227.
Ferdinand, A. (2002). Structural equation modeling dalam
penelitian manajemen. Semarang: Badan Penerbit
Universitas Diponegoro.
Fletcher, G. J., Simpson, J. A., & Thomas, G. (2000). The
measurement of perceived relationship quality
components: A confirmatory factor analytic approach.
Personality and Social Psychology Bulletin, 26(3), 340-
354.
Flores-Zamora, J., & García-Madariaga, J. (2017). Does
opinion leadership influence service evaluation and
loyalty intentions? Evidence from an arts services
provider. Journal of Retailing and Consumer Services,
39, 114-122.
Garvin, D. A. (1984). Product quality: An important
strategic weapon. Business horizons, 27(3), 40-43.
Ghozali, I. (2006). Aplikasi analisis multivariate dengan
program SPSS: Badan Penerbit Universitas
Diponegoro.
Han, H., & Hyun, S. S. (2017). Impact of hotel-restaurant
image and quality of physical-environment, service,
and food on satisfaction and intention. International
Journal of Hospitality Management, 63 (2017), 82-92.
Han, H., & Hyun, S. S. (2018). Role of motivations for
luxury cruise traveling, satisfaction, and involvement in
building traveler loyalty. International Journal of
Hospitality Management, 70, 75-84.
Jarvelin, A., & Lehtinen, U. (1996). Relationship quality in
a business-to-business service context. Paper presented
at the Quis.
Joon Choi, B., & Sik Kim, H. (2013). The impact of
outcome quality, interaction quality, and peer-to-peer
quality on customer satisfaction with a hospital service.
Managing Service Quality: An International Journal,
23(3), 188-204.
Kandampully, J. (2000). The impact of demand fluctuation
on the quality of service: a tourism industry example.
Managing Service Quality: An International Journal,
10(1), 10-19.
Kandampully, J., & Suhartanto, D. (2000). Customer
loyalty in the hotel industry: the role of customer
satisfaction and image. International journal of
contemporary hospitality management, 12(6), 346-351.
Keaveney, S. M., & Hunt, K. A. (1992). Conceptualization
and operationalization of retail store image: A case of
rival middle-level theories. Journal of the Academy of
Marketing Science, 20(2), 165-175.
Keller, K. L. (1993). Conceptualizing, measuring, and
managing customer-based brand equity. The Journal of
Marketing, 1-22.
Kotler, P., & Amstrong, G. (2004). Prinsip-prinsip
Marketing. Edisi Ketujuh, Penerbit Salemba Empat,
Jakarta.
Ladhari, R., Souiden, N., & Dufour, B. (2017). The role of
emotions in utilitarian service settings: The effects of
emotional satisfaction on product perception and
behavioral intentions. Journal of Retailing and
Consumer Services, 34, 10-18.
Lahap, J., Ramli, N. S., Said, N. M., Radzi, S. M., & Zain,
R. A. (2016). A Study of Brand Image towards
Customer's Satisfaction in the Malaysian Hotel
Industry. Procedia-Social and Behavioral Sciences,
224, 149-157.
LeBlanc, G., & Nguyen, N. (1996). An examination of the
factors that signal hotel image to travellers. Journal of
vacation Marketing, 3(1), 32-42.
Lee, J.-S., Hsu, L.-T., Han, H., & Kim, Y. (2010).
Understanding how consumers view green hotels: how
a hotel's green image can influence behavioural
intentions. Journal of sustainable tourism, 18(7), 901-
914.
Lewis, B. R., & Soureli, M. (2006). The antecedents of
consumer loyalty in retail banking. Journal of
consumer Behaviour, 5(1), 15-31.
Liang, L. J., Choi, H. C., & Joppe, M. (2018). Exploring the
relationship between satisfaction, trust and switching
intention, repurchase intention in the context of Airbnb.
International Journal of Hospitality Management, 69,
41-48.
Martineau, P. (1958). The personality of the retail store.
Ngobo, P.-V., & Jean, S. (2012). Does store image
influence demand for organic store brands? Journal of
Retailing and Consumer Services, 19(6), 621-628.
Oliver, R. L. (1999). Whence consumer loyalty? The
journal of marketing, 33-44.
Ostrowski, P. L., O'Brien, T. V., & Gordon, G. L. (1993).
Service quality and customer loyalty in the commercial
airline industry. Journal of travel research, 32(2), 16-
24.
Parasuraman, A., Zeithaml, V. A., & Berry, L. L. (1985). A
conceptual model of service quality and its implications
for future research. The Journal of Marketing, 41-50.
Rein, I., Kotler, P., & Haider, D. (1993). Marketing Places:
Attracting Investment, Industry, and Tourism to Cities,
States, and Nations.
Song, J., & Regan, A. (2003). Combinatorial auctions for
transportation service procurement: The carrier
perspective. Transportation Research Record: Journal
of the Transportation Research Board(1833), 40-46.
Tjiptono, F. (2001). Strategi Pemasaran: Andi.
Yogyakarta.
Tjiptono, F. (2004). Manajemen jasa: Yogyakarta: Andi.
Service Quality as Mediation Variable between Online Transportation Image and Interaction Quality and Consumer Satisfaction
3105

Tse, D. K., & Wilton, P. C. (1988). Models of consumer
satisfaction formation: An extension. Journal of
marketing research, 204-212.
Wallin Andreassen, T., & Lindestad, B. (1998). Customer
loyalty and complex services: The impact of corporate
image on quality, customer satisfaction and loyalty for
customers with varying degrees of service expertise.
International Journal of service Industry management,
9(1), 7-23.
Wong, A., & Sohal, A. (2002). Customers’ perspectives on
service quality and relationship quality in retail
encounters. Managing Service Quality: An
International Journal, 12(6), 424-433.
Woodside, A. G., Frey, L. L., & Daly, R. T. (1989). Linking
sort/ice anlity, customer satisfaction, and behavioral
intention. Journal of health care marketing, 9(4), 5-17.
Wu, H.-C., & Cheng, C.-C. (2013). A hierarchical model of
service quality in the airline industry. Journal of
Hospitality and Tourism Management, 20, 13-22.
Zeithaml, V. A., Berry, L. L., & Parasuraman, A. (1996).
The behavioral consequences of service quality. The
Journal of Marketing, 31-46.
ICRI 2018 - International Conference Recent Innovation
3106
