
Prediction of Timeliness of Graduating with Naïve Bayes Algorithm
Cisde Mulyadi
1
, Sukron
2
1
Study Program of Management Informatics, STMIK Cipta Darma Surakarta, Veteran Street, Sukoharjo, Indonesia
2
Study Program of Undergraduate Informatics, STMIK Cipta Darma Surakarta, Sukoharjo, Indonesia
Keywords: Naïve Bayes algorithm, predictions, timely graduation
Abstract: The number of students who graduated not on time and dropped out at the final level is still a problem for
universities in Indonesia. This can be overcome by making predictions on the number of students who
graduate on time so that later it is also known that the prediction of the number of students who graduate is
not correct. This study has succeeded in making the prediction model of student graduation using the Naïve
Bayes algorithm with an accuracy rate of 94.92%, a precision value of 96.30%, and a recall value of 98.11%.
Students who are predicted to pass in a timely manner will be given special handling so that later they can
graduate on time.
1 INTRODUCTION
Timely graduation is one of the benchmarks in
assessing the quality of study programs in a
university, especially in Indonesia. According to
Book VI of the Accreditation Instrument Assessment
Matrix, the three diploma study program will get a
score of 4 (maximum) if the exact graduation
percentage is greater or equal to 70%. With a rating
limit of 70% it is actually not a difficult thing to
achieve, but if it is not considered later it will be a
problem.
If the number of incoming students is greater than
the number of students who graduate then there will
be a buildup of students who will become a problem
in the long run. The accumulation of the number of
students can cause universities to add facilities such
as lecture halls. Therefore, universities must be able
to maintain the balance of the two, which is wrong by
predicting the number of students who graduate on
time. The number of students who graduate on time
from the results of this prediction will later become a
reference in the acceptance of new students in order
to create balance.
In addition, if it is known that the prediction of the
number of students who graduate on time, it can also
be known that the number of students predicted not to
graduate on time. Student data which is predicted not
to pass on time can be used as a reference for study
program managers to provide special treatment so
that later students can graduate on time so that the
percentage of graduation on time can reach 100% or
at least close to 100%.
Another problem faced by universities is that
many students drop out at the final level of their
studies. The number of dropout students is also one
of the assessments in accreditation. If this can be
predicted, the number of dropout students can be
reduced.
To make predictions based on past data can be
done with data mining techniques. Data mining is the
process of finding useful patterns and trends in large
data sets (Larose & Larose, 2015). One of the data
mining functions that can be used to predict is
classification. The task of classification is to predict
the output of variables / classes that are categorical or
polynomial (Kotu & Deshpande, 2015). Some data
mining methods can be applied for classification.
Popular classification algorithms are Decision Trees,
Neural Networks, k-Nearest Neighbors, Naive Bayes,
and Genetic algorithms (Yukselturk, Ozekes, &
Türel, 2014). This study will apply the Naïve Bayes
algorithm to get a prediction model for the timeliness
of graduating students.
2 LITERATURE REVIEW
2.1 Data Mining
According to Gartner Group data mining is a process
of finding meaningful relationships, patterns, and
Mulyadi, C. and Sukron, .
Prediction of Timeliness of Graduating with Naïve Bayes Algorithm.
DOI: 10.5220/0009946430433050
In Proceedings of the 1st International Conference on Recent Innovations (ICRI 2018), pages 3043-3050
ISBN: 978-989-758-458-9
Copyright
c
2020 by SCITEPRESS – Science and Technology Publications, Lda. All rights reserved
3043

tendencies by examining in a set of data stored in
storage using statistical and mathematical techniques
(Larose, 2005). According to (Hoffer and Topi,
2012), the purpose of data mining is:
1. Explanatory, which is to explain some
observation activities or conditions.
2. Confirmatory, which is to confirm an existing
hypothesis.
3. Exploratory, which is to analyze new data on an
odd relationship
Data mining has many functions that can be used.
The data mining function can be combined in certain
cases to answer existing problems (MacLennan et al.,
2012). The following are data mining functions in
general:
1. Classification is to classify a target class into the
selected category.
2. Clustering is to find grouping attributes into
segments based on similarity.
3. Association, which is to find the relationship
between atriut or item set, based on the number
of items that appear and the existing rule
association.
4. Regression is to find predictions from an existing
pattern.
5. Forecasting is for forecasting the time to come
based on trends that have occurred in the past.
6. Sequence Analysis is to find the sequence pattern
of a series of events.
7. Deviation Analysis is to find rare events that are
very different from normal conditions (abnormal
events).
2.2 Classification
The main things in the classification are: first, the
construction of the model as a prototype to be stored
as memory and second, the use of the model to do
recognition / classification / prediction on another
data object to be known in which class the data object
is in a model that is easily stored (Prasetyo, 2012).
The process of finding patterns that explain important
data is known as classification. There are many
classification methods in data mining, including
Decision Tree, K-Nearest Neighbor, Neural Network
and Naïve Bayes.
2.3 Naïve Bayes
Naïve Bayes classification is one of the most popular
data mining techniques to classify large amounts of
data and can be used to predict the probability of class
membership. Naive Bayes is a simple probabilistic
based prediction technique based on the application
of Bayes theorem (Bayes rule) with a strong (naïve)
independence assumption. In other words, the Naive
Bayes model used is an "independent feature model"
(Prasetyo, 2012).
P(H|E,e)=p(H|E)* P(e|E,H)p(e,E) (1)
Where:
E = evidence
E = evidence of new observations
P(H|E,e) = the probability of the H hypothesis is
correct if new evidence appears E from evidence e
p(H|E) = the probability of hitosesis H is correct if
given evidence E
P(e|E,H) = the connection between e and E if H is true
p(e|E) = link without looking at any hypothesis
2.4 Confusion Matrix
The confusion matrix method represents the
evaluation results of the model using a matrix table,
if the dataset consists of two classes, the first class is
considered positive, and the second class is
considered negative (Bramer, 2007). Evaluation
using confusion matrix produces accuracy, precision,
and recall values. Accuracy is a percentage of the
accuracy of record data that is correctly classified
after testing the classification results. Precision or
confidence is a proportion of positively predicted
cases that are also positively true to the actual data.
Recall or sensitivity is the proportion of actual
positive cases that are correctly predicted positively
(Han and Kamber, 2006).
Table 1: Confusion Matrix
Correct
Classification
Classified as
+ -
+ True positives False negatives
- False positives True negatives
The following is the evaluation of the confusion
matrix model:
a. Accuracy value (acc) is the proportion of the
correct number of predictions.
b. Sensitivity or recall is used to compare the
proportion of tp to positive tuples.
c. Specificity is used to compare the proportion of
tn to negative tuples.
d. PPV (positive predictive value) or precision is
the proportion of cases with positive diagnosis.
e. NPV (negative predictive value) is the proportion
of cases with a negative diagnosis.
f.
ICRI 2018 - International Conference Recent Innovation
3044

2.5 ROC Curve
Receiver Operating Characteristic (ROC) curves
show accuracy and compare visual classifications.
ROC expresses confusion matrix. ROC is a two-
dimensional graph with false positives as horizontal
lines and true positive as vertical lines (Vercellis,
2011).
It can be concluded that, one point on the ROC
curve is better than the other if the transverse
direction from the bottom left to the top right in the
graph. The indicator of accuracy is the AUC (Area
Under Curve) value. The level of accuracy can be
diagnosed as follows (Powers, 2011):
a. Accuracy 0.90 - 1.00 = Excellent classification
b. Accuracy 0.80 - 0.90 = Good classification
c. Accuracy 0.70 - 0.80 = Fair classification
d. Accuracy 0.60 - 0.70 = Poor classification
e. Accuracy 0.50 - 0.60 = Failure
2.6 Related Work
The study of the use of data mining to predict the
timeliness of graduating students has been widely
published.
The biggest challenge faced by universities is
reducing the number of students who drop out of
study (Pal, 2012). The number of students who drop
out of study is an indicator of how well academic
performance and management of new student
admission selection. This causes universities to focus
more on the strength of students than the quality of
education. In this study, data mining applications are
applied to produce predictive models for the
management of students dropping out of study, so that
it can be known which students need more support.
The results showed that the machine learning
algorithm was able to build a predictive model
effectively from the data of existing study dropouts.
Performance in academic programs is one of the
most important factors affecting the quality of higher
education available to students (Al-Barrak & Al-
Razgan, 2015). In this study, data mining techniques
were used especially classification to analyze student
scores in different evaluative tasks for structured data
courses. For this purpose, compared three different
classifiers to predict student performance.
Classification techniques are applied here for both
numeric and categorized attributes. The results show
that the model based on the Naïve Bayes algorithm
provides the most accurate predictions with 91%
accuracy to predict student failures in the course.
Other studies show that the most influential
factors in student graduation rates are the Semester
Achievement Index (IPS) and the Total Semester
Credit System (SKS) as a whole and every semester
(Amelia, Lumenta & Jacobus, 2017). Student study
period can be predicted based on factors related to
student academic, such as study programs, semester
achievement index scores and number of credits at
university. The Naïve Bayes algorithm used can
determine the prediction of the study period of
students with the level of Accuracy on the algorithm
testing worth 85.17% on the average value of testing
in five semesters.
Another study states that one of the biggest
challenges facing higher education today is predicting
student academic paths (Abu-Oda & El-Halees,
2015). Many higher education systems are unable to
detect student populations that tend to break up due
to lack of intelligence methods to use information,
and guidance from the university system. Data
mining methods to classify and predict dropout
students, proposed two different classifiers, namely
Decision Tree (DT), and Naive Bayes (NB), and
trained using the dataset that has been collected. The
results showed that the accuracy of DT reached
98.14%, while NB reached 96.86%.
Research conducted by Sulistiono and Defiyanti
shows that the Naïve Bayes algorithm has the highest
level of accuracy (Sulistiono and Defiyanti, 2015).
The accuracy of the Naïve Bayes algorithm is 93.58%
compared to the C4.5 algorithm of 93.05 and the
Neural Network of 89.56%. That is why the author
uses the Naïve Bayes classification method to
conduct this research. Naïve Bayes classification
method was chosen because the Naïve Bayes method
is a simple statistical probability method but produces
accurate results.
3 PROPOSED METHOD
The method used in this study is an experiment that
includes investigation of causal relationships using
self-controlled testing (Dawson, 2009). This study
aims to get a prediction model for the timeliness of
graduating prospective students. Because recognized
/ accepted research must follow recognized rules
(Dawson, 2009), then in this study conducted by
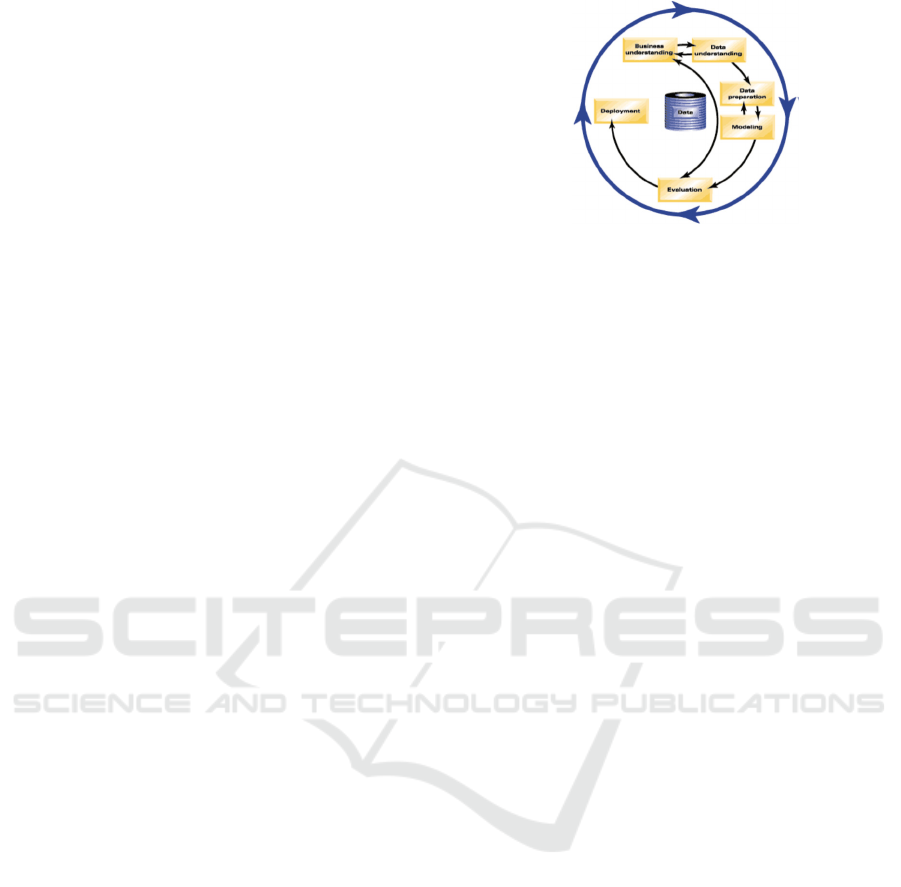
following the stages in data mining which has six
phases of CRISP-DM (Cross Industry Standard
Process for Data Mining) (Chapman et al., 2000) The
stages are as follows:
1. Business Understanding
The first stage is understanding the goals and needs
from a business point of view, then translating this
knowledge into defining problems in data mining.
Furthermore, plans and strategies will be determined
to achieve these goals.
Prediction of Timeliness of Graduating with Naïve Bayes Algorithm
3045
2. Data Understanding
This stage begins with data collection which will then
be followed by a process to get an in-depth
understanding of data, identify data quality problems,
or to detect an interesting part of the data that can be
used for hypotheses for hidden information.
3. Data Preparation
This stage includes all activities to build the final
dataset (data that will be processed at the modeling /
modeling stage) from raw data. This stage can be
repeated several times. At this stage also includes the
selection of tables, records, and data attributes,
including the process of cleaning and transforming
data to be used as input in the modeling (modeling)
stage.
4. Modeling
In this stage, the selection and application of various
modeling techniques will be carried out and some
parameters will be adjusted to obtain optimal values.
In particular, there are several different techniques
that can be applied to the same data mining problem.
On the other hand there are modeling techniques that
require special data formats. So that at this stage it is
still possible to return to the previous stage.
5. Evaluation
At this stage, the model has been formed and is
expected to have good quality when viewed from the
point of view of data analysis. This stage will evaluate
the effectiveness and quality of the model before
using it and determine whether the model can achieve
the objectives set in the initial phase (Business
Understanding). The key to this stage is to determine
whether there are business problems that have not
been considered. At the end of this stage must be
determined the use of the results of the data mining
process.
6. Deployment
At this stage, the knowledge or information that has
been obtained will be arranged and presented in a
special form so that it can be used by users. The
deployment stage can be in the form of making a
simple report or implementing a repeat data mining
process within the company. In many cases, the
deployment phase involves consumers, in addition to
data analysts, because it is very important for
consumers to understand what actions must be taken
to use the model that has been made.
Figure 1: CRISP-DM Process (Larose, 2006)
4 RESULTS AND DISCUSSION
The results of this study are discussed according to
the stages in data mining which has six phases of
CRISP-DM.
4.1 Business Understanding
Business understanding is the first stage in the
CRISP-DM process which is more appropriately
referred to as the stage of understanding the study.
This stage can be broken down into the following
stages.
4.1.1 Determining Business Objectives
At this stage what is meant by business objectives is
the purpose of this study. The purpose of this study is
to get a prediction model for the timeliness of
graduating students. Data on alumnus data from 2017
graduates in one of the three diploma study programs
at STMIK Cipta Darma Surakarta so that later can
increase the number of students who graduate on time
in the following years. This is done because many
students do not graduate on time. The results of this
study can later be used as a basis for decision making
in determining the study program policy.
4.1.2 Conduct Situation Assessment
At this stage it takes understanding of the study
objectives and translating them into data mining
goals. Based on the study objectives that have been
determined at the previous stage, it is necessary to
understand what things are considered to affect the
accuracy of graduating students. Furthermore, based
on an understanding of previous studies, data on
attributes that affect the accuracy of student
graduation are obtained. The attributes of the
ICRI 2018 - International Conference Recent Innovation
3046
student's data will be processed using data mining
methods.
4.1.3 Determine the Initial Data Mining
Strategy
The initial strategy in implementing the purpose of
doing data mining is to request student data first to the
Academic Administration and Student Information
section (AASI) STMIK Cipta Darma Surakarta.
4.2 Data Understanding
Student datasets are obtained from AASI STMIK
Cipta Darma Surakarta in the form of excel
documents of 112 records.
4.2.1 Initial Data Collection
The main data source used in this study is the alumnus
dataset of 2017 graduates, one of the three diploma
study programs at STMIK Cipta Darma Surakarta
with the file type Microsoft Excel Worksheet (.xls).
4.2.2 Describe Data
The 2017 alumnus dataset consists of several
attributes including NIM, name, study program
specialization, final assignment title, gender, student
status, Semester 5 GPA, the value of course in
Research Methodology and graduation status.
4.2.3 Evaluation of Data Quality
The results of evaluation of data quality are finding
many null values called missing values in the
attributes in the student dataset.
4.2.4 Attribute Selection
Attributes used are specialization of study program,
gender, student status, Semester GPA 5, Research
Methodology courses and graduation status. The use
of value attributes in the Research Methodology
course is rarely used in the prediction model of
student graduation. This attribute is considered
important because it determines the competence of
students in the preparation of the final project.
4.3 Data Preparation
Data preparation includes all activities to build
student datasets that will be applied to the modeling
tool, from the initial raw data in the form of student
datasets and will then carry out data mining
processes.
4.3.1 Data Selection
Attributes used are specialization of study program,
final assignment title, gender, student status,
Semester GPA 5, Research Methodology course
value and graduation status.
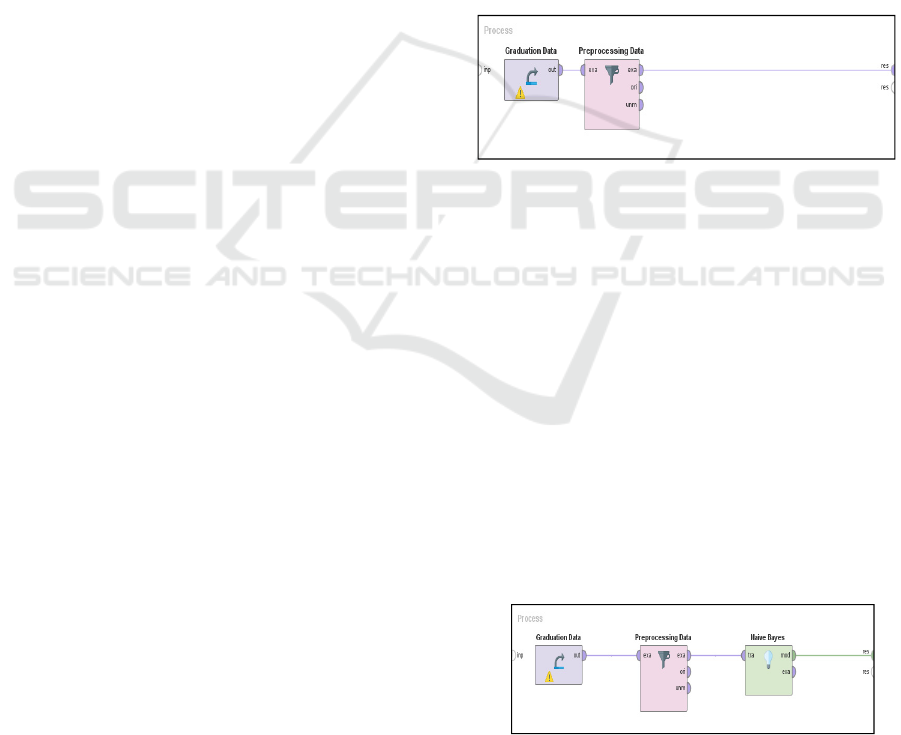
4.3.2 Preprosessing Data
Data that has been collected is processed to reduce
irrelevant data, or data with missing attributes.
Processing is also the conversion of redundant
(excessive) values, or too diverse values into smaller
groups to facilitate the formation of models. At this
stage it is a stage to ensure that the data of students
selected is feasible for processing.
Figure 2: Preprocessing Data
4.3.3 Data Transformation
Numerical data such as the year of graduation
must be carried out in the form of initialization data
in nominal form.
4.4 Modeling
Modeling is a phase that directly involves data
mining techniques, namely by selecting data mining
techniques and determining the algorithm to be used.
In this study proposed a prediction model for the
timeliness of graduate students using data mining
techniques, namely with the Naïve Bayes algorithm.
Modeling stages were carried out on 109 datasets
with Rapidminer 8.2 tools as shown in Figure 2.
Figure 3: Modeling with Naïve Bayes
Prediction of Timeliness of Graduating with Naïve Bayes Algorithm
3047
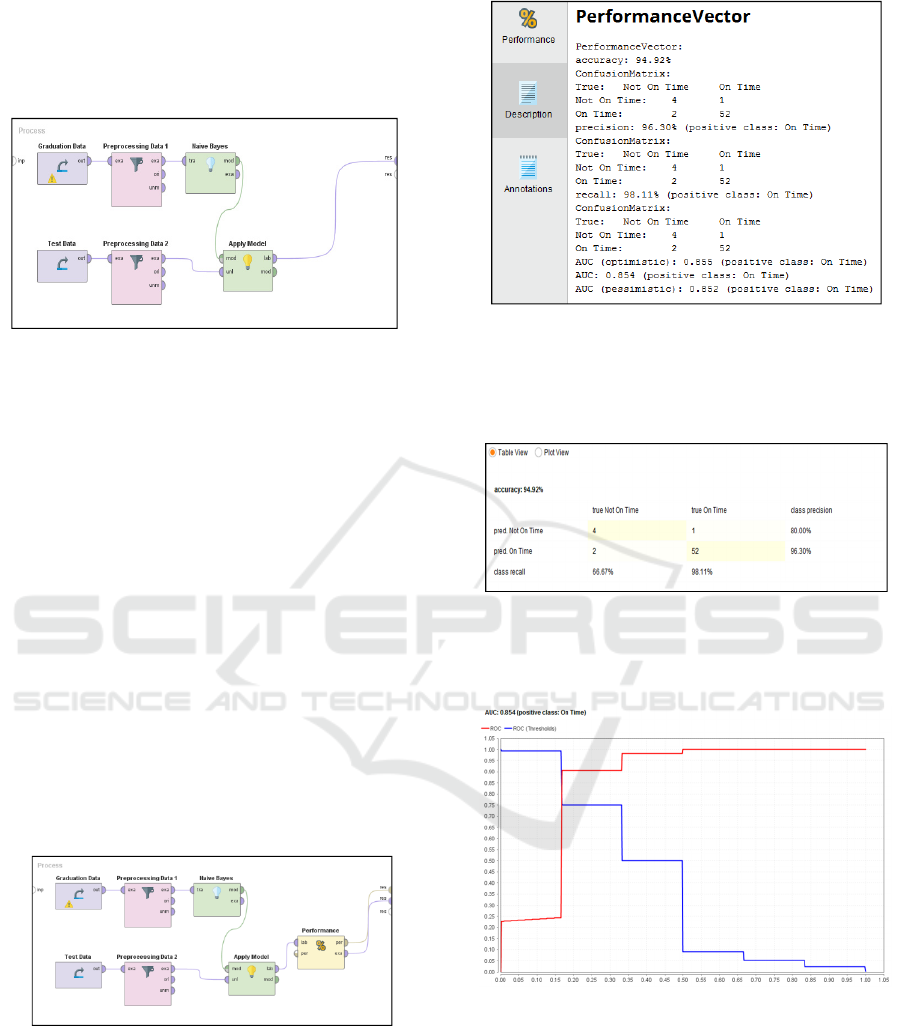
Furthermore, the Naïve Bayes model was tested
by using the block apply model for 59 datasets (Test
Data) which were taken randomly to get the
prediction results (Figure 4).
Figure 4: Apply Model
4.5 Evaluation
Evaluation is an advanced phase of the purpose of
data mining. Evaluation is carried out in depth with
the aim that the results at the modeling stage are in
accordance with the objectives to be achieved in the
business understanding stage.
4.5.1 Evaluation Results
This stage assesses the extent to which data mining
modeling results meet the objectives of data mining
that have been determined at the business
understanding stage. In this evaluation phase the
confusion matrix method is used as a method that will
test the precision, recall and accuracy of the pattern
formed. Recall and accuracy values are obtained by
adding a performance block after applying the model
as shown in Figure 5 below.
Figure 5: Performance
The results of processing with performance blocks are
shown in Figure 6. The accuracy values obtained are
94.92%, the precision value is 96.30%, and the recall
value is 98.11%.
Figure 6: Performance Vector
While the sensitivity value is 98.11%, the
specificity value is 66.67%, the PPV value is 96.30%,
and the NPV is 80% as shown in Figure 7.
Figure 7: Screenshoot Accuracy Result
While the AUC value obtained is 0.854 as shown in
Figure 8.
Figure 8: ROC Curve
4.5.2 Review Process
This stage is used to ensure that all stages or
important factors that have been carried out in the
data processing are missing. Based on the results of
the examination, it was ensured that all stages had
been carried out and nothing had been missed.
ICRI 2018 - International Conference Recent Innovation
3048

4.5.3 Determine Next Steps
At this stage is the stage in determining the next
steps taken. There are 2 options, namely returning to
the initial stage (business understanding) or
continuing to the final stage (deployment).
Considering the results of data mining modeling
fulfill the purpose of data mining that has been
determined at the business understanding stage then
proceed to the deployment stage.
4.6 Deployment
Deployment is the final stage in making reports
on data mining activities. Final report containing
knowledge gained or pattern recognition in data in the
data mining process.
Based on the studies conducted, a new pattern,
information, and knowledge has been produced in the
data mining process to determine the prediction
model for student graduation timeliness based on the
alumnus data of 2017. In order to assess the
performance of the student graduation prediction
model as discussed previously, the Confusion Matrix
method . The following is shown again the confusion
matrix results in table 2.
Table 2: Confusion Matrix Result
n = 59
Prediction
Not On Time On Time
Actual Not On
Time
4 (TN) 2 (FP)
Actual On
Time
1 (FN) 52 (TP)
Note: n= sum of test data, TN= True negatives, FP=
False positives, FN= False negatives, TP= True positives
In the case of this study if explained in more detail as
follows:
a. True negatives means that the number of students
predicted to pass is not on time and in fact does
not pass on time
b. False positives means that the number of students
is predicted to pass on time but in reality they do
not graduate on time
c. False negatives means that the number of
students is predicted to pass not on time but in
fact pass on time
d. True positives means that the number of students
predicted to pass is not on time and in fact does
not pass on time
The following is the evaluation of the confusion
matrix model:
a. Accuracy value (acc) of 94.92% shows the
proportion of the correct number of predictions.
Of the 59 data tests that were correctly predicted
(both on time and not on time), there were 56.
b. Value of sensitivity or recall of 98.11% indicates
the proportion of TP to (TP + FN).
c. Specificity value of 96.30% shows the
proportion of TN to (TN + FP).
d. PPV (positive predictive value) or precision
value of 96.30% shows the proportion of cases
with positive diagnosis or proportion of TP to
(TP + FP).
e. NPV (negative predictive value) of 80% shows
the proportion of cases with negative diagnosis
or proportions of TN to (TN + FN).
While the AUC value obtained at 0.854 shows the
level of accuracy of good classification or it can also
be said that this student graduation prediction model
includes a good classification.
5 CONCLUSIONS
Based on the previous discussion, it can be
concluded that the Naïve Bayes algorithm is able to
produce a prediction model for the timeliness of
graduating students with an accuracy rate of 94.92%,
96.30% precision, 98.11% recall and AUC value
0.854 (good classification). This model can produce
predictions of students who graduate on time and not
on time. The data of students who are predicted to
pass are not timely to be input for the study program
manager to provide special treatment for these
students so that later they can graduate on time.
This study can still be developed with the addition
of alumnus data attributes that are considered to
improve predictions so that the results are more
accurate. In addition this study only uses alumnus
data in one study program and a particular generation
so it is still very possible to increase the number of
study programs or data of several alumnus forces in
one study program.
REFERENCES
Abu-Oda, G. S., & El-Halees, A. M. (2015) Data Mining in
Higher Education: University Student Dropout Case
Study. International Journal of Data Mining &
Knowledge Management Process (IJDKP). [Online] 5
(1), 15-27. Available from:
doi:10.5121/ijdkp.2015.5102 [Acessed 15
th
July 2018].
Al-Barrak, M. A., & Al-Razgan, M. S. (2015). Predicting
Students’ Performance Through Classification: A Case
Study. Journal of Theoretical and Applied Information
Technology, 167-175.
Prediction of Timeliness of Graduating with Naïve Bayes Algorithm
3049

Amelia, Mongan Winny, Lumenta, Arie S. M., & Jacobus,
Agustinus, Prediksi Masa Studi Mahasiswa dengan
Menggunakan Algoritma Naïve Bayes, E-Journal
Teknik Informatika, Vol 11, No.1 (2017) ISSN : 2301 –
8364
Bramer, Max. (2007). Principles of Data Mining. London:
Springer. ISBN-10: 1-84628-765-0, ISBN-13: 978-1-
84628-765-7.
Chapman, P., Clinton, J., Kerber, R., Khabaza, T., Reinart,
T., Shearer, C. and Wirth, R. (2000), CRISP–DM Step-
by-step Data Mining Guide. [Online]. Available from:
www.crisp-dm.org/CRISPWP-0800.pdf [Accessed 6th
August 2018).
Dawson, C. W. (2009) Projects in Computing and
Information Systems A Student’s Guide (2nd ed.). Great
Britain: Pearson Education.
Han, J., & Kamber, M. (2006) Data Mining Concept and
Tehniques. San Fransisco: Morgan Kauffman. ISBN
13: 978-1-55860-901-3.
Kotu, V., & Deshpande, B. (2015) Predictive Analytics and
Data Mining. Concepts and Practice with RapidMiner.
Massachusetts: Elsevier Inc.
Larose, D. (2005) Discovering Knowledge In Data.
Canada: Willey Interscience.
Larose, Daniel T. (2006) Data Mining Methods and
Models. Hoboken. New Jersey : Jhon Wiley & Sons,
Inc.
Larose, D. T., & Larose, C. D. (2015) Data Mining and
Predictive Analytics (2nd ed.). New Jersey: John Wiley
& Sons, Inc.
Pal, S. (2012) Mining Educational Data Using
Classification to Decrease Dropout Rate of Students.
International journal of multidisciplinary sciences and
engineering, 3(5), 35-39.
Powers, D.M.W. (2011) Evaluation: From Precision, Recall
and F-Measure to ROC, Informedness, Markedness&
Correlation. Journal of Machine Learning
Technologies, 29 (1), 37-63.
Vercellis, C. (2009) Business Intelligence : Data Mining
and Optimization for Decision Making. John Wiley &
Sons, Ltd.
Yukselturk, E., Ozekes, S., & Türel, Y. K. (2014).
Predicting Dropout Student: An Application of Data
Mining Methods in an Online Education Program.
European Journal of Open, Distance and e-Learning.
[Online] 17(1), 118-133. Available from:
doi:10.2478/eurodl-2014-0008 [Accessed 18
th
July
2018].
Sulistiono, Heru. (2015) Kajian Penerapan Algoritma
C4.5, Neural Network dan Naïve Bayes untuk
Klasifikasi Mahasiswa yang Bermasalah dalam
Registrasi. Faktor Exacta.
ICRI 2018 - International Conference Recent Innovation
3050
