
Welfare Relationship and Achievement Motivation on Teacher
Performance: Survey in Private Madrasah Tsanawiyah in Tebet
District, South Jakarta
Muhammad Nizom Chotib
1
, Andrian Aziz Widodo
1
, Saripudin Hamzah
1
, Eni Kunaenih
1
and Sutardjo
Admowidjoyo
1
1
Islamic Education Doctoral Program, Universitas Islam Jakarta
Keywords: Welfare, Achievement Motivation, Teacher Performance
Abstract: This study aims to analyze and reveal the presence or absence of teachers and teachers who excel either
partially or collectively on teacher performance in Private Madrasah Tsanawiyah Tebet District, South
Jakarta. The population of this study were teachers in Madrasah Tsanawiyah in Tebet Sub-District, South
Jakarta, with a sample of three schools, namely Private Attahiriyah Mts, Assyafiiyah 01 Private Mts, and
Syarif Hidayatullah Private Mts. The research method by doing variables between teachers (X1) and teacher
achievement motivation (X2) on the independent variables (dependent variable) is teacher performance (Y).
Using descriptive research methods, using a questionnaire with a correlational approach. Based on the
results of data analysis carried out and the results of calculations both manually and manually using
computer programs that can be used. (1) Teacher welfare has a significant relationship with teacher
performance with an increase of 39.8%. the significant between teacher achievement motivation and
performance of 38.5% (teacher) (3) shows a significant relationship between teacher and teacher with
different teachers. teacher achievement on teacher performance is 57.9% and the remaining 42.1% by other
factors.
1 INTRODUCTION
There are several factors that influence the quality of
education, namely teachers, funds, curriculum, non-
teacher resources, facilities, and learning resources.
Among these factors, teacher factors have a great
influence on the quality of education.
The teacher is the main key to the
implementation of education that will lead students
to changes in behavior, intelligence and will
determine the progress of the nation in the future.
According to Samana (1994: 15), the teacher is a
lifelong student. If the existing teacher in a nation
has a low level of qualification or competence, then
the quality of education in the nation can be
ascertained to be low as well. But on the contrary, if
the level of qualification or competence of teachers
in a nation is high, the quality of education in the
nation can be ascertained high.
Currently, based on global mapping, Indonesia
is ranked 40th or last of 40 countries. Then
according to international scientific literacy
research, Indonesia ranks 40th out of 42 countries.
This reflects that the quality of education in
Indonesia is still very low. Even though the level of
literacy in Indonesia is currently quite high, reaching
94% and the illiteracy rate in Indonesia is only 6%.
The low teacher competency in Indonesia can be
seen from the results of the national teacher
competency test conducted in 2012. Based on the
results of the teacher competency test, the average
score of teachers across Indonesia is only 44.5.
While the value of teacher competence reaches a
minimum of 70 from a maximum score of 100
(Kurniasih and Sani, 2015: 21).
Law of the Republic of Indonesia number 14 of
2005 concerning Teachers and Lecturers, suggests
that teachers are professional educators with the
main task of educating, teaching, guiding, directing,
training, evaluating, and evaluating students in early
childhood education through formal education, basic
education and secondary education. Professionalism
in education needs to be interpreted that teachers
Chotib, M., Widodo, A., Hamzah, S., Kunaenih, E. and Admowidjojo, S.
Welfare Relationship and Achievement Motivation on Teacher Performance: Survey in Private Madrasah Tsanawiyah in Tebet District, South Jakarta.
DOI: 10.5220/0009943924232430
In Proceedings of the 1st International Conference on Recent Innovations (ICRI 2018), pages 2423-2430
ISBN: 978-989-758-458-9
Copyright
c
2020 by SCITEPRESS – Science and Technology Publications, Lda. All rights reserved
2423

must be people who have instincts as educators
understand and understand students.
Many factors determine a school to be of high
quality, but various studies on the effectiveness of
teacher teaching, can be concluded that teachers
have a very dominant influence on student learning
achievement. This can be understood because the
teacher is an active resource, while other resources
are passive. The best curriculum, facilities, learning
infrastructure, but the teacher's quality level is low,
it will be difficult to get high-quality education
results.
Good teachers always try to improve the quality
of their profession and themselves, teachers who
always evaluate their own performance, where the
purpose of self-performance evaluation is to
improve the learning process in the future. Teachers
must have strong motivation to improve their
profession and quality.
One place to give birth to intelligent generation
and character is a madrasa. The word madrasa is a
more well-known word because this word is in Law
Number 20 of 2003 concerning the National
Education System (National Education System). It is
said that the madrasa is a public school characterized
by Islam. Since the Act was enacted we know two
kinds of public schools, namely schools and
madrasas. Schools are public schools consisting of
elementary, junior high, high school / vocational
high school while madrasas are public schools
consisting of MI, MTs, and MA / MAK there is no
difference between schools and madrasas both in
their goals and curriculum; the difference lies in the
system. Madrasas use Islamic systems while schools
use general systems.
2 THEORY
2.1 Definition of Teacher Welfare
Welfare comes from a prosperous word which
means safe, safe and prosperous (apart from all
kinds of disturbances, difficulties and so on)
(Poerwadarminta, 2006: 1051). While welfare is
security and safety (enjoyment of life, prosperity,
etc.) (Poerwadarminta, 2006: 1051).
According to Supriyadi (1998: 7) said
welfare in a broad sense includes salaries,
allowances, incentives and others given for carrying
out their duties. Furthermore, welfare is said to
include material aspects in the form of salaries,
incentives, provision of facilities such as housing,
libraries, health benefits and so on. And non-
material aspects such as ease of promotion, work
atmosphere, legal protection, social security and
others.
From the description above, it can be
concluded that welfare is an atmosphere of birth and
inner being that is safe, prosperous, and peaceful,
and that the level of welfare can be seen in terms of
being born as prosperous if the income budget is
greater than expenditure. So that in this case
materially can be fulfilled daily needs, and in terms
of his mind is said to be prosperous if in carrying out
his duties with a sense of pleasure and with the
intention of worship, so that in this case there is a
sense of comfort and peace in living his life.
2.2 Definition of Motivation
The term motivation comes from the Latin word
"movere" which means encouragement or
movement. Motivation questions how to direct
power and the potential to work towards the goals
set (Hasibuan, 2006: 141).
According to Bejo Siswanto, (2006: 119),
motivation can be interpreted as a mental state and
mental attitude of people who provide energy,
encourage activities (moves), and lead or channel
behavior towards achieving needs that give
satisfaction or reduce imbalances.
Motivation can be grouped into two types
according to Malayu S. P Hasibuan (2006: 150),
namely (1) positive motivation (positive incentives),
managers motivate subordinates by giving prizes to
those who perform well (2) negative motivation
(negative incentives), managers motivate
subordinates by giving punishment to those whose
jobs are poor (low achievement).
2.3 Understanding Performance
According to the A.A. Anwar Mangkunegara (2009:
67), the term performance comes from the word job
performance or Actual performance (work
performance or actual achievement achieved by
someone). Definition of performance (performance
achievement) is the result of work that is in the
quality and quantity achieved by an employee in
carrying out their duties in accordance with the
responsibilities assigned to him.
According to Prawirasentono (1999: 2):
Performance is the result of work that can be
achieved by a person or group of people in an
organization, in accordance with the authority and
responsibility of each, in order to achieve the goals
ICRI 2018 - International Conference Recent Innovation
2424

of the organization concerned legally, not violating
the law and in accordance with moral or ethical ".
With regard to teacher performance
standards, Sahertian as quoted by Kusmianto (1997:
49) in the teacher performance appraisal handbook
by supervisors explains that:
Teacher performance standards are related to the
quality of teachers in carrying out their duties such
as: (1) working with students individually, (2)
preparation and planning of learning, (3) utilization
of learning media, (4) involving students in various
learning experiences, and (5 ) active leadership from
the teacher.
3 METHODOLOGY
3.1 Research Methods
The method used in this research is quantitative
explanatory descriptive research based on primary
and secondary data collected from teachers in 3
(three) Private Madrasah Tsanawiyah (MTs) schools
registered in education units (schools) in Tebet
Subdistrict.
3.2 Research Variables
There are three types of variables that will be used
as data collection tools in this study, namely teacher
performance variables (Y), teacher welfare variables
(X1), and achievement motivation variables (X2).
The three variables are expressed in the form of
instruments using attitude scales with ranges,
strongly agree (SS), agree (S), agree enough (CS),
disagree (TS), strongly disagree (STS).
The problems in the research are as follows:
Figure 1: Model of Relationship Between Variables X1
and X2 to Variables Y
3.3 Population and Sample
According to Furqon (2002: 135) what is meant
by the population is a set of objects, people or
circumstances that at least have the same general
characteristics. The population targeted in this study
as well as data sources are teachers from 8 MTs
schools. Private registered in the education unit
(school) in Tebet District, South Jakarta.
Sample 50% of teachers from 3 MTs schools.
Private registered in the education unit (school) in
Tebet Subdistrict.
3.4 Data Collection Techniques
Data collection techniques used in this study consist
of (1) Secondary Data, namely from books or other
documentary materials that have to do with research
conducted (2) Primary Data that is collecting data
directly into the field by observation, interview and
questionnaire.
3.5 Data Analysis Techniques
Analysis of the data used in this study includes (1)
Descriptive Analysis. The type of descriptive
analysis used in the form of presentation in the form
of frequency distribution tables and presentation in
the form of tables and charts (2) Correlation
Analysis. After the required data is obtained, then
the multiple correlation method is used to find the
relationship between teacher's welfare level (X1),
teacher's teaching motivation (X2) and student
learning achievement (Y). Correlation analysis is
used to measure the relationship between variables
so that it is useful to know how strong the
relationship or influence between independent
variables with the dependent variable between X1
and Y or between X2 and Y. The correlation
coefficient has a value between -1 and +1 as follows:
a. If r is positive then the variables are positively
correlated and strong (meaning) meaning that if
the variable X rises then the variable Y also
rises as well as vice versa. The closer the r
value to +1, the stronger the correlation, and
vice versa.
b. If r is negative then the variables are negatively
correlated meaning that if the variable X rises
then the variable Y goes down and vice versa.
The closer the 1st r value is, the stronger the
correlation, and vice versa.
c. If r is 0 (zero), the variables do not show
correlation, meaning that if the variable X rises
or falls, the Y variable does not change.
d. If r +1 or -1 then the variables show a perfect
positive or negative correlation.
To determine the closeness of the relationship or
correlation between variables, the values of the
correlation coefficient (KK) are as follows:
Welfare Relationship and Achievement Motivation on Teacher Performance: Survey in Private Madrasah Tsanawiyah in Tebet District,
South Jakarta
2425

a. Correlation coefficient = 0 means there is no
correlation.
b. 0 <KK≤0.20 means that the correlation is very
low or very weak.
c. 0,20 <KK≤0,40 means low or weak correlation
but certain.
d. 0.40 <KK≤0.70 means a significant correlation.
e. 0.70 <KK≤0.90 means high or strong
correlation.
f. 0.90 <KK≤1.00 means that the correlation is
very high or very strong.
g. KK = 1 means perfect correlation.
To measure the degree of closeness the relationship
between the two variables in this study can be
calculated with a relative value that can be shaped:
a. Correlation coefficient (r)
The linear correlation coefficient can be calculated
by product moment method with the following
formula:
22
. yx
xy
r
Where:
r = correlation coefficient
x = average deviation of variable X
y = variable devisionation of variable Y
b. Multiple linear correlation coefficients
The multiple correlation coefficient is the index or
number used to measure the closeness of the
relationship between three or more variables.
c. Determination Coefficient
The coefficient of determination is a value to
measure the contribution of variable X to the rise
and fall of Y with the formula as follows KD = r2 x
100%
d. Regression Analysis
In this study using multiple linear regression
analysis, namely analysis for more than two
variables (multiple linear regression) expressed by
linear equations:
Y = a + b1x1 + b2x2
Where:
Y = dependent variable
X1X2 = independent variable
a = Y value, if X1 = X2 = 0
b1 = the amount of increase or decrease in Y in
units, if X1 rises or falls one unit and X2 is constant.
b2 = the amount of increase or decrease in Y in
units, if X2 rises or falls one unit and X1 is constant.
a, b1, b2 = multiple linear regression coefficients.
3.6 Statistical Hypothesis
The statistical hypothesis to be tested can be
formulated as follows:
1. Hypothesis I: H0 : Py1 = 0
Ha : Py1 > 0
2. Hypothesis II: H0 : Py2 = 0
Ha : Py2 > 0
3. Hypothesis III: H0 : Py12 = 0
Ha : Py12 > 0
4 RESEARCH RESULTS
4.1 Data Description
Primary data in this study obtained from data
collection using questionnaire research instrument in
the form of a total score of respondents' answers.
The total score of respondents' answers from the
teacher welfare questionnaire as primary data
teacher welfare variables, the total score of
respondents' answers from the questionnaire teacher
achievement motivation as primary data variable
teacher achievement motivation, and the total score
of respondents' answers from teacher performance as
primary data variable teacher performance. The
research objective is to calculate the level of
influence between each variable, then the primary
data then needs to be processed and analyzed by
multiple linear regression methods. To process the
data in order to obtain more accurate results, the
SPSS (Statistical Program for Social Science)
computer program version 22 is used. The 3 (three)
variables that will be analyzed consist of the
dependent variable is Teacher Performance (Y),
while Independent variables used are teacher welfare
(X1) and teacher achievement motivation (X2).
Furthermore, the three variables will be described
based on research data.
4.1.1 Description of Data about Teacher
Performance (Y)
Testing the validity of teacher performance data
instruments (Y) uses trial data with the number of
respondents (N) = 20 samples and the number of
statements as many as 40 items. Search results with
dk = 20-1 = 19 and α = 0.05 obtained rtable = 0.361
then compare the rtabel with each item count. If it is
obtained r count t rtabel then the statement item is
considered valid. From the results of the search it
was found that items 22, 34 and 35 were declared
invalid (drop), so the number of statements to be
used in the study was 37 items.
ICRI 2018 - International Conference Recent Innovation
2426

Based on the results of the validity test above,
the reliability of the teacher performance data
instrument (Y) is then tested using a trial data with a
total of 20 samples and a valid number of statements
(N) of 37 items. Search results with dk = 20-1 = 19
and α = 0.05 obtained rtable = 0.355 and r count =
0.989 so that r count ≥ rtable then the statement item
is considered reliable as a measuring tool.
4.1.2 Description of Data about Teacher
Welfare (X1)
Testing the validity of teacher welfare data
instruments (X1) uses trial data with the number of
respondents (N) = 20 samples and the number of
statements as many as 20 items. Search results with
dk = 20-1 = 19 and α = 0.05 obtained rtable = 0.361
then compare the rtable with each item count. If it is
obtained r count t rtabel then the statement item is
considered valid. From the results of the search, it is
known that all the statement items are declared
valid, then the number of statements to be used in
the study is 20 items.
Based on the results of the validity test above,
reliability testing of teacher welfare data instruments
(X1) is then performed using trial data with a total of
20 samples and a valid number of statements (N) of
20 items. Search results with dk = 20-1 = 19 and α =
0,05 obtained rtable = 0,355 and r count = 0,975,
thus r count t rtable then the statement item is
considered reliable as a measuring tool.
4.13 Description of Data about Teacher
Achievement Motivation (X2)
Testing the validity of teacher achievement
motivation data instruments (X2) using trial data
with the number of respondents (N) = 30 samples
and the number of statements as many as 35 items.
Search results with dk = 30-1 = 29 and α = 0.05
obtained rtable = 0.361 then compare the rtabel with
each item count. If the rtable ≥ rtable is obtained, the
whole statement item is considered valid. From the
results of the search, it was found that there were no
items declared invalid (drop), so all statements could
be used in the study as many as 35 items.
Based on the results of the validity test above,
reliability testing of teacher achievement motivation
data instruments (X2) was then used using trial data
with a total of 34 samples and a valid number of
statements (N) of 35 items. Search results with dk =
34-1 = 33 and α = 0,05 obtained rtable = 0,388 and r
count = 0,949, thus r count ≥ rtable then the
statement item is considered reliable as a measuring
tool.
4.2 Test Requirements for Analysis
1. Test for Normality Error Estimates
The normality test of regression Y error estimates
for X is intended to find out whether the population
is normally distributed or not.
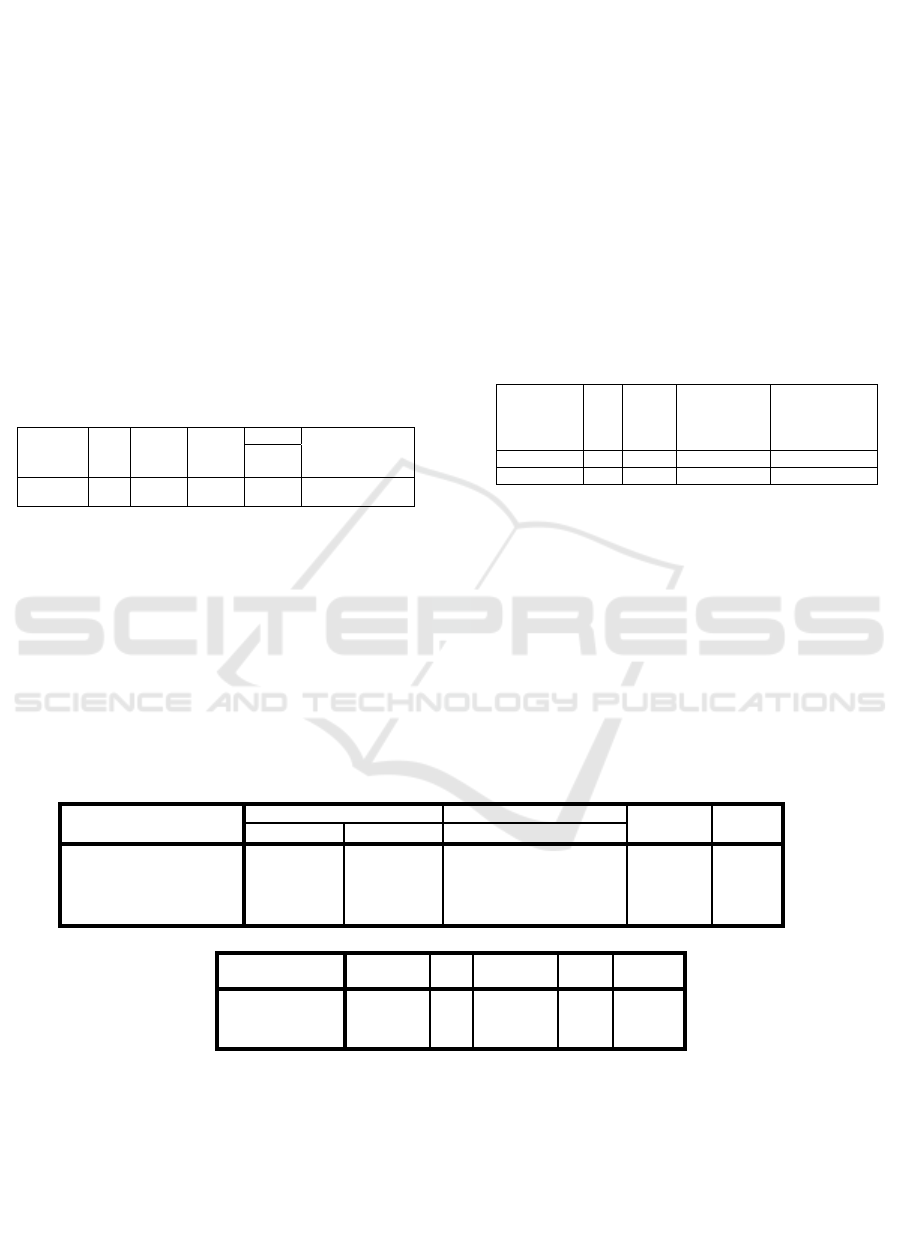
Summary of Estimated Error Normality Test
Information:
Y: Teacher's performance
X1: Teacher welfare
X2: Teacher's achievement motivation
2. Homogeneity Test Population Variance
After testing the normality, then the homogeneity of
variance is tested with the aim to test the
homogeneity of variance between groups of Y
scores grouped based on the similarity of X scores.
Regression
Estimation
Error Y
above
N Sig.
Test
Limit
Information
Y 34 0,200 0,05
Sig. > 0,05
,
means normal
distribution
X
1
34 0,200 0,05
Sig. > 0,05,
means normal
distribution
X
2
34 0,200 0,05
Sig. > 0,05,
means normal
distribution
Table 1: Summary of Homogeneity Variance Test Results
Information:
Y: Teacher's performance
X
1
: Teacher welfare
X
2
: Teacher's achievement motivation
4.3 Hypothesis Testing
4.3.1 Relationship between Teacher Welfare
(X1) and Teacher Performance (Y)
In this first test, the hypothesis proposed was "There
is a positive relationship between teacher welfare
and teacher performance".
Table 2: Meaning Test of the Correlation Coefficient
between X
1
and Y Information:
Sample dk r
y1
t
count
t
table
Information
α = 0,05
34 32 0,631 4,603 1,694 Significant
dk = degree of freedom
ry1 = correlation coefficient
between teacher welfare (X
1
)
and teacher performance (Y).
Welfare Relationship and Achievement Motivation on Teacher Performance: Survey in Private Madrasah Tsanawiyah in Tebet District,
South Jakarta
2427
Based on the results of this analysis it can be
concluded that there is a significant relationship
between teacher welfare and teacher performance.
The findings of this study have successfully
accepted the research hypothesis which states "There
is a significant relationship between teacher welfare
and teacher performance".
4.3.2 The Relationship between Teacher
Achievement Motivation (X2) and
Teacher Performance (Y)
In this second test, the second hypothesis proposed
in this study is "there is a positive relationship
between teacher achievement motivation and teacher
performance".
Table 3: Meaning Test of the Correlation Coefficient
between X
2
and Y Information:
Sample dk r
y2
t
count
t
table
Information
α =
0,05
34 32 0,625 4,526 1,694
Signifi
cant
dk = degree of freedom
ry2 = correlation coefficient
between teacher achievement
motivation (X
2
) and teacher
performance (Y)
From the results of the simple analysis it can be
concluded that there is a significant relationship
between teacher achievement motivation and teacher
performance. The findings of this study have
successfully accepted the research hypothesis which
states "There is a significant relationship between
teacher achievement motivation and teacher
performance".
4.3.3 Relationship between Teacher Welfare
(X1) and Teacher Achievement
Motivation (X2) with Teacher
Performance (Y)
The third hypothesis proposed in this study is "there
is a positive relationship between teacher welfare
and teacher achievement motivation together
with teacher performance".
Table 4: Variance Analysis (ANAVA) for Meaning Test
Dual Regression (Y = 38,033 + 0,641 X
1
+ 0,435 X
2
)
Regression
Estimation
Error Y
above
Dk Sig.
Signification
Limit
Information
X
1
36 0,114 0,05 Homogeneous
X
2
30 0,290 0,05 Homogeneous
From the table above, the results of testing the
significance of multiple regression obtained Fcount
of 21,342 is greater than Ftable of 3,28 at the
numerator 2 and the denominator is 33 at the
significance level α = 0,05. Thus it can be concluded
that multiple regression equations for teacher
welfare data and teacher achievement motivation
together have a significant (meaningful) effect on
teacher performance.
Table 5: Test Significance of Multiple Correlation Coefficients
Model
Unstandardized Coefficients Standardized Coefficients
t Sig.
B Std. Error Beta
1 (Constant) 37.297 13.232 2.819 .006
Welfare teacherTeacher's
achievement motivation
.330 .073 .415 4.518 .000
.455 .100 .419 4.556 .000
Model
Sum of
Squares df
Mean
Square
F Sig.
1 Regression 1774.207 2 887.103 21.342 .000
b
Residual 1288.529 31 41.565
Total 3062.735 33
a. Dependent Variable: Teacher performance
b. Predictors: (Constant), Teacher’s achievement motivation,
teacher welfare
The statistical hypothesis:
H
0
: ρy12 = 0 (there is no relation X
1
and X
2
to Y)
H
1
: ρy12 ≠ 0 (there are relations X
1
and X
2
to Y)
By comparing t
count
with t
table
, a decision can be
made:
If t
count
<t
table
accepts H
0
and rejects H
1
If t
count
> t
table
rejects H
0
and accepts H
1
From the calculation results obtained t
count
=
2.819> t
table
= 1.694 (N = 34 and α = 0.05) with sig.
= 0.000 and smaller than 0.05, this means that the
ICRI 2018 - International Conference Recent Innovation
2428

coefficient of the independent variable is significant,
so it can be concluded that there is a significant
relationship between teacher performance and
teacher welfare and teacher achievement motivation.
Based on the calculations in the table above,
shows that the two independent variables namely
teacher welfare (X
1
) and teacher achievement
motivation (X
2
) together contribute to the teacher's
performance. This shows a significant relationship
between teacher welfare (X
1
) and teacher
achievement motivation (X
2
) with teacher
performance (Y). The strength of the relationship
between the two independent variables with one
dependent variable is expressed through the multiple
regression equation Ŷ = 38.033 + 0.641 X
1
+ 0.435
X
2
.
The coefficient of determination between
teacher welfare (X
1
) and teacher achievement
motivation (X
2
) together with teacher performance
(Y) is equal to (0.761) 2 = 0.579, so that the amount
of teacher welfare variables (X
1
) and teacher
achievement motivation (X
2
) on teacher
performance (Y) of 57.9%, meaning that the
variance that occurs in teacher performance can be
explained by (X
1
) and (X
2
) through the regression
equation Ŷ = 38.033 + 0.641 X
1
+ 0.435 X
2
.
Thus the research hypothesis states that
"There is a significant relationship between
teacher welfare and teacher achievement
motivation with teacher performance" received.
5 CONCLUSION
Based on the results of data analysis carried out and
the results of statistical calculations either manually
or using a computer program a conclusion can be
drawn:
1. Teacher welfare has a significant relationship
with teacher performance with a contribution of
39.8% of changes in teacher performance. Thus,
the principal as a leader has considerable
responsibility to manage the school and the
processes that occur in the school, so that it is
expected to provide welfare for the teacher.
2. There is a significant relationship between
teacher achievement motivation and teacher
performance with a contribution of 38.5%
change in teacher performance. Thus, teacher
performance can be improved by providing
teacher achievement motivation on a regular
basis. Because one of the factors that potentially
affect teacher performance is teacher
achievement motivation.
3. There is a significant relationship between
teacher welfare and teacher achievement
motivation together in providing teacher
performance which expressed the magnitude of
the contribution of teacher welfare variables and
teacher achievement motivation to teacher
performance by 57.9% and the remaining 42.1%
influenced by factors other.
REFERENCES
Ad-Duweisy, Muhammad Abdullah, Menjadi Guru Yang
Sukses & Berpengaruh, Surabaya: eLBA Fitrah
Mandiri Sejahtera, 2009.
Asmani, Jamal Ma’mur, Tips Menjadi Guru Inspiratif,
Kreatif, Dan Inovatif, Jogjakarta: Diva Press, 2013.
Atmowidjoyo, Sutrardjo, Metodologi Penelitian
Pendidikan Dan Ilmu-ilmu Sosial, Jakarta: Duta Karya
Ilmu, 2013.
Daryanto dan Tasrial, Pengembangan Karir Profesi Guru,
Yogyakarta: Gava Media, 2015.
Depdiknas, Pedoman Penyediaan Fasilitas Guru. Jakarta:
Dit. Tenaga Kependidikan Ditjen Dikdasmen, 2001.
________, Undang-undang Republik Indonesia nomor 20
tahun 2003 tentang Sistem Pendidikan Nasional,
Jakarta, 2003.
________, Undang-undang Republik Indonesia nomor 14
tahun 2005 tentang Guru dan Dosen, Jakarta, 2005.
Dimyati dan Mudjiono, Belajar dan Pembelajaran,
Jakarta: Rineka Cipta, 2006.
Direktorat Jenderal Kelembagaan Agama Islam
Departemen Agama RI, Sejarah Madrasah:
Pertumbuhan, Dinamika, dan Perkembangannya di
Indonesia, Jakarta, 2004
Djamarah, Syaiful Bahri dan Aswin Zain, Strategi Belajar
Mengejar, Jakarta: PT. Rineka Cipta, 2006.
Fatah, Nanang, Ekonomi dan Pembiayaan Pendidikan,
Bandung: Remaja Rosdakary, 2000.
Gagne, Robert M, Kondisi Belajar dan Teori
Pembelajaran (Terjemahan oleh Munadir M.A),
Jakarta: PAU-Dikti Depdikbud, 1989.
Hamalik, Oemar, Perencanaan Pengajaran Berdasarkan
Pendekatan Sistem, Jakarta: PT Bumi Aksara, 2008.
Hasibuan, Malayu S. P., 2006. Organisasi dan Motivasi:
Dasar Peningkatan Produktivitas, Jakarta, Bumi
Aksara, 2006.
Iman Kurniasih dan Berlin Sani, Sukses Uji Kompetensi
Guru (UKG), Surabaya: Kata Pena, 2015.
Kusmianto, Panduan Penilaian Kinerja Guru oleh
Pengawas. Bandung: Universitas Pendidikan
Indonesia, 2007.
Makmun, Abin Syamsuddin, Psikologi Pendidikan,
Bandung: Rosda Karya Remaja, 2004.
Margono, S., Metodologi Penelitian Pendidikan, Jakarta,
Rineka Cipta,
Welfare Relationship and Achievement Motivation on Teacher Performance: Survey in Private Madrasah Tsanawiyah in Tebet District,
South Jakarta
2429

("http://id.wikipedia.org/wiki/Kesejahteraan_sosial"),
2005.
Mulyasa, E., Menjadi Guru Profesional (Menciptakan
Pembelajaran Kreatif dan Menyenangkan), Bandung:
PT. Remaja Rosdakarya, 2007.
Munafisah, Pengaruh Kreativitas Dan Kesejahteraan
Guru Terhadap Kinerja Guru PAI Di SMA Se
Kabupaten Pekalongan, Semarang: Tesis Program
Magister Institut Agama Islam (IAIN) Wali Songo,
2010.
Musfah, Jejen. Manajemen Pendidikan (Teori, Kebijakan,
dan Praktik), Jakarta: Prenadamedia Group, 2015.
Nata, Abudin, Perspektif Islam Tentang Strategi
Pembelajaran, Jakarta: Kencana, 2011.
Nawawi, Hadari, Manajemen Sumber Daya Manusia:
Untuk Bisnis Yang Kompetitif. Yogyakarta: Gajah
Mada University Press, 2003.
Nazarudin, Manajemen Pembelajaran (Implementasi
Konsep, Karakteristik, dan Metodologi Pendidikan
Agama Islam di Sekolah Umum, Yogyakarta: Teras,
2007.
Nurdin, Muhammad, Kiat Menjadi Guru Profesional,
Jogjakarta: Ar-Ruz Media Group, 2008.
Poerwadarminta WJS., Kamus Besar Bahasa Indonesia,
Jakarta: Balai Pustaka, 2006.
Purwanto, Evaluasi Hasil Belajar, Yogyakarta: Pustaka
Pelajar, 2011.
Purwanto, Ngalim, Psikologi Pendidikan, Bandung:
Remaja Rosdakarya, 2000.
Purwanto, Ngalim, Prinsip-prinsip & Teknik Evaluasi
Pengajaran, Bandung: PT. Remaja Rosdakarya, 2006.
Qomar, Mujamil, Manajemen Pendidikan Islam, Jakarta:
Erlangga, 2007.
Rivai, Veithzal dan Deddy Mulyadi, Kepemimpinan dan
Perilaku Organisasi, Jakarta: Rajawali Pers, 2013.
Sagala, Syaiful, Konsep dan Makna Pembelajaran,
Bandung: Penerbit Alfabeta, 2005.
Samana, A., Profesionalisme Keguruan, Yogyakarta,
Kanisius,, 1994.
Sanjaya, Wina, Strategi Pembelajaran: Berorientasi
Standar Proses Pendidikan, Jakarta: Penerbit: Prenada
Media Group, 2007.
Sardiman, Interaksi dan Motivasi, Jakarta: PT. Raja
Grafindo Persada, 2007.
Semiawan, Conny R., Memupuk Bakat dan Kreativitas
Siswa Sekolah Menengah. Jakarta: PT. Gramedia,
1984.
Shadily, Hasan, Ensiklopedia Indonesia, Jakarta: Ikhtisar
Baru, 1983.
Shochib, Moh., Pola Asuh Orang Tua Untuk Membantu
Anak Mengembangkan Disiplin Diri, Jakarta: Rineka
Cipta, 2000.
Siagan, Sondang P., Manajemen Sumber Daya Manusia,
Jakarta: Haji Mas Agung., 2006.
Slameto,
Belajar dan Faktor-Faktor yang
Mempengaruhinya, Jakarta: PT. Rineka Cipta, 2003.
Supriyadi, Dedi, Mengangkat Citra dan Martabat Guru,
Yogyakarta: Adacita Karyanusa, 1988.
Suharsaputra, Umar, Administrasi Pendidikan, Bandung:
PT. Refika Aditama, 2010.
Suparlan, Menjadi Guru Efektif, Yogyakarta, Hikayat,
2005.
Syah, Muhibbin, Psikologi Pendidikan dengan
Pendekatan Baru, Bandung: PT Remaja Rosdakarya,
2008.
Syarifuddin, E., Disiplin Guru Dalam Mengajar, P3M
STAIN Serang, 2001.
Uno, Hamzah B., Teori Motivasi dan Pengukurannya:
Analisis di Bidang Pendidikan, Jakarta: Bumi Aksara,
2010.
Usman, Muhammad Uzer, Menjadi Guru Profesional.
Bandung: Remaja Rosda Karya., 2002.
Wirawan, Kapita Selekta Teori Kepemimpinan (Pengantar
Untuk Praktek dan Penelitian), Jakarta: Yayasan
Bangun Indonesia & Uhamka Press, 2013.
Yamin, Martinis dan Maisah, Manajemen Pembelajaran
Kelas (Strategi Meningkatkan Mutu Pembelajaran),
Jakarta: Gunung Persada GP Press, 2009.
Yukl, Gary A. (ahli Bahasa: Udaya Yusuf),
Kepemimpinan dalam Organisasi (Ledership in
Organiziation 3e), Jakarta: Prenhallindo, 2009.
ICRI 2018 - International Conference Recent Innovation
2430
