
The Growth of Several Soybean Genotypes in the Saline Soil
Siti Muzaiyanah
1
and Gatut Wahyu Anggoro Susanto
1
1
Indonesian Legumes and Tuber Crops Research Institute, Jalan Raya Kendalpayak km 8 kotak Pos 66 Malang
Keywords: soybeans, growth, saline soil
Abstract: One of the strategic efforts to increase soybean production towards self-sufficiency with 2.8 million tons of
production is through the expansion of suboptimal planting areas, among others, by using saline soil. The area
of potential saline land in Indonesia is 140,300 ha. This study aims to determine the growth of several
genotypes at a salinity soil level of 10 dS/m. This experiment was conducted using a randomized block design
(RBD) repeated three times. The treatments tested were genotypes consisting of Deja 2, Dering, Karat 13,
Panderman, GepakKuning, DaunLancip, Dega1 and Tanggamus. Variables observed in this study include:
plant height, root length, stover weight, root dry weight and soil salinity level at the age of 24 days, 45 days,
60 days and 75 days. All genotypes still live up to 45 days, but at 60 days after Dering, Tanggamus,
Gepakkuning is dead, and only DaunLancip can survive up to 75 days.
1 INTRODUCTION
One strategic efforts to increase soybean
production towards self-sufficiency with 2.8 million
tons of production is through the expansion of
planting areas, considering that fluctuations in
national production have been closely linked to
fluctuations in harvested areas, and in the past six
years (in 2009-2015) soybean harvested area was
only 493-723 thousand hectares with low
productivity, 1.2-1.3 t/ha. Based on calculations, to
achieve soybean self-sufficiency, national
productivity needs to be increased to 1.4-1.5 t/ha in
the 2.0 million ha harvested area (BPS, 2017).
Expansion of the area can be done by utilizing
marginal land such as dry land, acid dry land, and
saline land. In Indonesia it is estimated that the total
of saline land 440.300 ha which were 304.000 ha
rather saline and 140,300 ha saline (Rachman et al.,
2008).
The intensity of soil salinity was depend on the
kind of soil texture. The coarse-textured soil better on
the ion transportation than fine-textured soil, that the
entry of most solute into the effluent was faster in
coarse-textured soil. The coarse-textured soils have
relatively low total porosity, macro pores which
results in a relatively high volume of leaching and salt
removal. Then clay- textured that used to maintaining
and transporting soil ions. In other hand, light-
textured soils with low clay content and small buffer
capacity had higher K+ concentration than heavy-
textured soils in the soil solution, its seems caused by
cation exchange (Hoseini and Delbari, 2015).
Salinity decreased acid phosphatase activity in
cotyledon during 24 hours after germination. Salinity
also affected percentage and rate of germination in
Lettuce. Length and fresh weight of root and shoot
were reduced significantly with salt treatment in two
lettuce varieties. Biochemically analysis shows that in
the root, acid phosphatase activity could increased or
decreased depend on the genotypes but on shoot its
enzim activity had no difference with the control
(Nasri et al 2015). Tsegay and Gebreslassie (2014)
also report that the percentation of germination, shoot
length and root length of Lathyrus sativus and Pisum
sativum var. abyssinicum decreased with an increase
in salinity level. The germination of both declined
with increasing salinity levels, although reduction in
root length was higher than reduction in shoot length.
Soybean has a varying response to salinity. Each
genotype shows specific to respond to salinity.
Several genotypes can germinate in saline
condition but inhibited on growth for the next stage.
Other genotypes that tent to tolerant on salinity get
well on germination and germinate and get great
growth vigorously although on saline condition.
Ichiyou sensitive genotype on salinity condition,
while Baluran was tolerant up to 125 mM NaCl based
on sprout length and fresh weight (Putri et al. 2017).
Salinity conditions delays soybean seed germination
1636
Muzaiyanah, S. and Wahyu Anggoro Susanto, G.
The Growth of Several Soybean Genotypes in the Saline Soil.
DOI: 10.5220/0009933016361642
In Proceedings of the 1st International Conference on Recent Innovations (ICRI 2018), pages 1636-1642
ISBN: 978-989-758-458-9
Copyright
c
2020 by SCITEPRESS – Science and Technology Publications, Lda. All rights reserved

by negatively regulating gibberellin (GA) while
positively mediating abscisic acid (ABA) biogenesis,
which leads to a decrease in the GA/ABA ratio.
Different soybean genotype showed a similar
repressed phenotype during seed germination under
exogenous NaCl application. Salinity conditions led
to high MDA (malondialdehyde) level during
germination and the post-germinative growth stages.
Salinity conditions also changed catalase, superoxide
dismutase, and peroxidase activities. It condition
made the transcription levels of ABA and GA
biogenesis and signaling genes were altered. Salinity
condition also considerably down-regulated active
GA
1
, GA
3
, and GA
4
levels, whereas the ABA content
was up-regulated; and therefore ratios, such as
GA
1
/ABA, GA
3
/ABA, and GA
4
/ABA, are decreased.
Hence, FLUN partially rescued the delayed-
germination phenotype as consistently with the
hormonal quantification (Shu et al. 2017). Kumar
(2017) report that the increasing of salinity level
delayed the beginning and ending of germination and
reduced final germination percentage because Nacl
and Na
2
SO
4
reduced both germination and seedling
growth in both the soybean varieties. Yuniati (2004)
report that the ratio between fresh weight (FW) and
dry weight (DW) become indicator that genotype
tolerant to salinity condition. The high value of ratio
between fresh weight (FW) and dry weight (DW)
shows that there’s no inhibition on water uptake
prosses. Wilis that indicate as tolerant genotype has
FW/DW ratio higher than Tidar (indicated as
sensitive genotypes). But FW/DW value of Wilis
also decreased with increasing NaCl concentration.
The shoot length of soybean germination decreased
2.2%, 2.2%, 4.4%, and 22.2% at treatment of NaCl
70 mM, 80 mM, 90 mM and 100 mM respectively
from normal condition. In other hand, FW/DW of
Wilis decreased 30%, 31.1%, 32.2%, 33.3% as treat
70 mM, 80 mM, 90 mM and 100 mM NaCl on shoot
respectively from normal condition. Furthermore, the
FW/DW ratio value of Wilis root decreased 13.9%,
18.3%, 24.7%, 28% with 70 mM, 80 mM, 90 mM and
100 mM NaCl treatment respectively from normal
condition. Then the FW/DW ratio value of Wilis root
decreased 3.7%, 20%, 13.8%, 26.3% with 70 mM, 80
mM, 90 mM and 100 mM NaCl treatment
respectively from normal condition.
Salinity stress causes changes morphology of
soybean genotype. Stress salinity affect the roots,
canopy of plants soybeans and plant height decreased
(Purwaningrahayu and Taufiq,2017; Bustingorri and
Lavado, 2011; Hashi et al., 2015, Sabagh et al., 2015;
Farhoudi and Tafti, 2011, Aini, 2014
b
). Legumes
have different respons against stress salinity depend
on both interspecies and varieties. Based on
decreasing yield, critical point salinity stress on
soybean, peanut, and green beans are 5 dS/m, 3.2
dS/m, and 1–2.65 dS/m respectively (Kristiono et al.,
2013). At the soil salinity 3.91 dS m-1 soybean
biomass could decreased up to 48.14% (Aini et al.,
2014). Plant height and number of leaves have not
decrease yet at the level of salinity of 3 dS/m up to the
fourth week of Dering1, Demas1, Devon1 varieties.
But the number of pods, pod weight and 100 seeds
that genotypes were decreased since at level 3 dS/m
of soil salinity (Yunita, 2018). The research objective
was to study the growth of several genotypes at 10
dS/m soil salinity level.
2 MATERIALS AND METHODS
The study was carried out in a greenhouse Balitkabi
in July - September 2017 used slight alfisol soil from
MunengProbolinggo. The soil was dried and put in
polibag 12 kg capacity, filled with 8 kg of soil. The
soil in polybag was irrigated up to 100% moisture
content. Phonska inorganic fertilizers were applicated
alongside the plants during planting. Each pot is
fertilized as much as 4 g per pot. At the beginning of
planting, each pot planted with four seeds and then
thinned at 15 days so that there were only two plants
per pot. Saline water was applied when entering V1
phase (after the first trifoliate is fully formed). During
the study, the crop is protected from pest, disease and
weed disturbances for getting optimal growth of
plants.
The study was arranged using a Randomized
Block Design with the various of genotype as
treatment. The various of genotypes were Deja 2,
Dering, Karat 13, Panderman, GepakKuning,
DaunLancip, Dega1 and Tanggamus. Variables
observed in this study include: plant height, root
length, stover weight, root dry weight and soil salinity
level at the age of 24 dap, 45 dap, 60 dap and 75 dap.
3 RESULTS AND DISCUSSION
There were variety response of several genotypes in
this research. That response show that every genotype
have different defense attact to salinity. Firstly, all
genotypes still alive at 45 days after planting (dap),
but at 60 dap Dering, Tanggamus, Gepakkuning were
dead, and only genotype DaunLancip could survive
up to 75 dap.
The Growth of Several Soybean Genotypes in the Saline Soil
1637
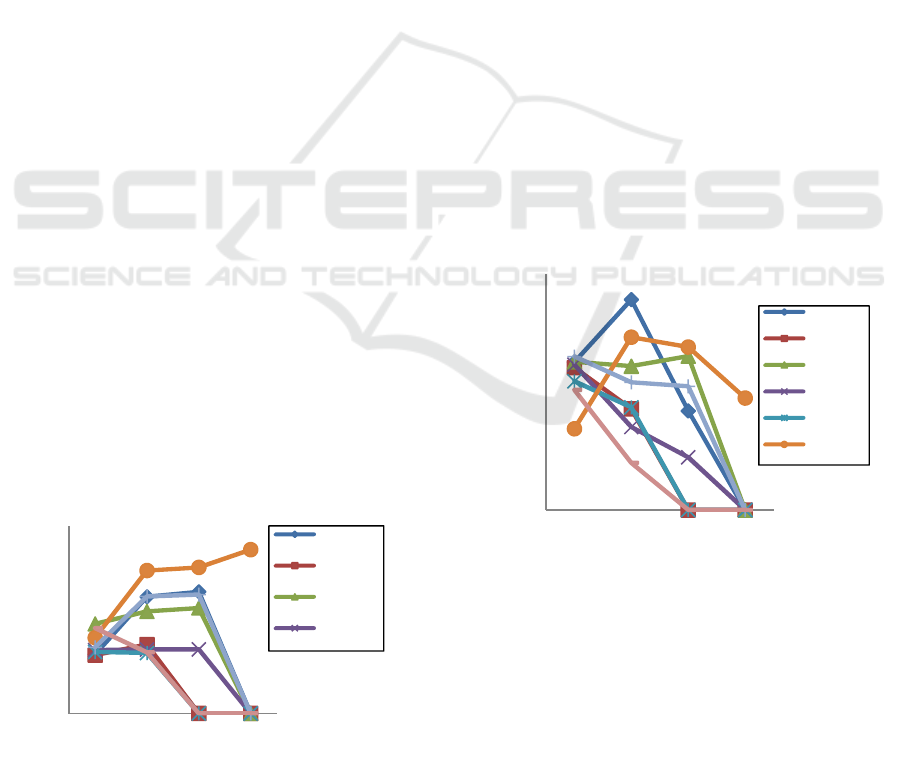
3.1 Plant Height
When it was 24 dap, Karat 13 was the highest plant
among 7 other genotypes, it was 23,9 cm. Then, when
at 45 dap, the height of the Gepak Kuning and
Tanggamus didn’t increased since 24 dap, which is
about 16 cm. While the height of Deja 2, Dering,
Karat 13, Panderman, DaunLancip, Dega1 increased
97.9%; 18.2%; 13.9%; 1.0%; 88.6%; and 76.9%
fromthe height plant at 24 dap. It very slight increased
plant growth when entering 60 dap, Deja 2 only
increased by 4.3%; Karat 13 increased by 3.4%,
Panderman increased by 0.3%; DaunLancip
increased by 2.2%; and Dega 1 increased 1.6%
compared to 45 dap, while Dering, Tanggamus,
GepakKuning were dead. Then at 75 dap, the height
of DaunLancip increased 12.2% compared to 60 dap,
while the others had died (Figure 1).
Similarity result was repoted by Abdelhamid et
al. (2013) that the plant height of faba bean decreased
with increasing salinity. At application NaCl 50 mM
and 100 mM, plant height of faba decreased 18.1%
and 22.9 % respectively from normal condition.
Dolatabadian et al. (2011) reported that the plant
height of soybean decreased since at 50 mM NaCl
consentration parallel with increasing NaCl
concentration. At level concentration of NaCl 25 mM,
50 mM and 100 mM, the plant height of soybean
decreased 0%; 11.9% and 33.3 % respectively from
normal condition. Queiroz et al. (2012) also reported
that the plant height of soybean decreased 15.6%;
25.8%; 33.9% from the normal condition at appliying
NaCl 50 mM, 100 mM and 200 mM respectively. El
Sabagh (2015) also reported that shoot dry weight of
genotypes were positively affected by increasing
salinity level. NaCl treatment stress highly significant
on soybean growth. It revealed that the shoot dry
matter was decreased with the increasing salinity
levels.
Figure 1. The Plant height of several genotypes at several
observation
3.2 Root Length
Only Deja 2 and Daunlancip whose roots continued
to grow up from 24 dap to 45 dap, that were 42.4%
and 112% respectively. While Dering, Panderman,
Gepakkuning, Daunlancip, Dega1 and Tanggamus
approximately decreased 29.0%, 42.9%, 20.3%,
16.9% and 60.8% compared to the root length at 24
daprespectively. The root length of Karat 13 tends to
be stable until 60 dap. Generally, the root length of
the plant decreases at 60 dap, it could caused by the
roots begin to fragile before the plant dies (at 75 dap).
The only one DaunLancip that still alive but also get
decreasing the length of roots at 75 dap. It was 31.3%
decreased length of root compared to 60 dap (Figure
2).
Agarwal et al. (2015) report that salinity has
differentially affected on root length growth depend
on genotypes tolerance. The inhibitory effect of
salinity gradually increases at 6 and 7.2 dS/m but
failed to produce roots at 10 dS/mand beyond.
Queiroz et al. (2012) also reported that the root length
of soybean decreased with increasing NaCl
concentration. At level concentration of NaCl 50 mM,
100 mM and 200 mM, the root length of soybean
decreased 8.9 % 23.2% and 15.9% respectively from
normal condition.
Figure 2. The Plant height of several genotypes at several
observation
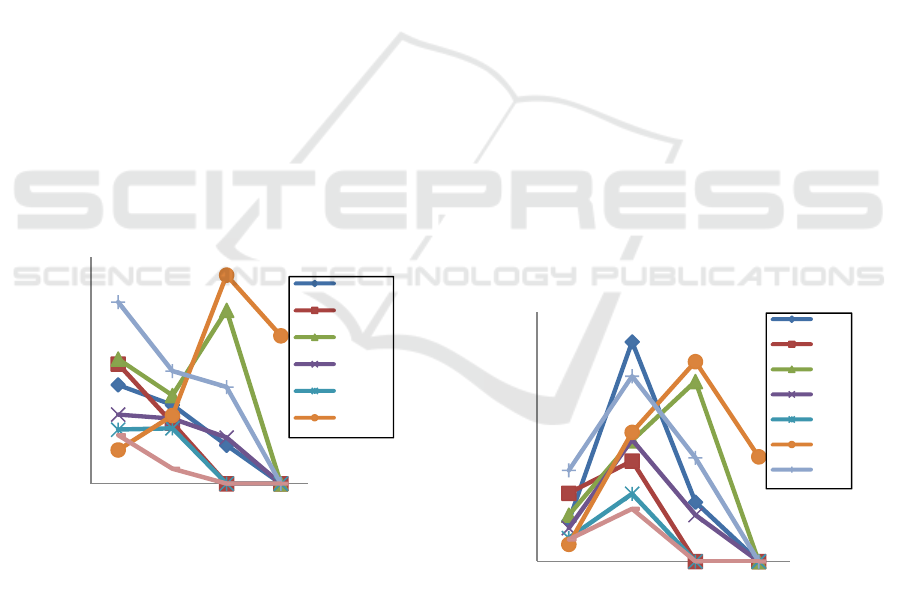
3.3 Plant Dry Weight
When it was 24 dap, the Dega had the highest stover
weight compared to 7 other varieties, but at the age of
45 dap, all genotypes decreased dry stover weight
except Gepakkuning and Daunlancip genotypes. Deja
2, Dering, Karat 13, Panderman, Dega1 and
Tanggamus decreased dry stover weight up to 20.4%;
49.4%; 29.2%; 6.0%; 38.0%; and 69.2% respectively
0
10
20
30
40
50
24dap 45dap 60dap 75dap
Plantheight(cm)
Deja2
Dering
Karat13
Panderman
0
5
10
15
20
25
30
35
40
24dap 45dap 60dap 75dap
Rootlength(cm)
Deja2
Dering
Karat13
Panderman
Gepakkunin
g
Daunlancip
ICRI 2018 - International Conference Recent Innovation
1638
compared to 24 dap. Whereas Gepakkuning
andDaunLancip increased dry stover by 2.3% and
102.2% compared to 24 dap respectively. Then at the
60 dap, GepakKuning was dead, while dry stover
weight of Karat 13 and DaunLancip increased dry
stover weight 96% and 206.3% compared to 45 dap.
While Deja 2, Pandeman, and Dega1 decreased dry
stover weight by 51.1%; 29.0% and 14.2% compared
to 45 hst. At 75 hst, only daunlancip genotypes that
survived but also get dry stover weight reduction by
29.1% compared to 60 dap (Figure 3).
Abdelhamid et al. (2013) reported that the
plant dry weight of faba bean decreased with
increasing salinity. At application NaCl 50 mM and
100 mM, plant dry weight of faba decreased 17.8%
and 48.4 % respectively from normal condition.
Dolatabadian et al. (2011) also reported that the plant
dry weight of soybean decreased with increasing
NaCl concentration. At level concentration of NaCl
25 mM, 50 mM and 100 mM, the weight of dry plant
decreased 50.6%; 71.4% and 88.9 % respectively
from normal condition. Queiroz et al. (2012) also
reported that the weight of soybean dry plant
decreased with increasing NaCl concentration. At
level concentration of NaCl 50 mM, 100 mM and 200
mM, the weight of soybean dry plant decreased
31.4% 40.9% and 62% respectively from normal
condition.
Figure 3. The dry stover weight of several genotypes at several
observation
3.4 Root Dry Weight
Dega 1 was the genotype which has the highest root
dry weight compared to the other seven genotypes at
24 dap, which is about 0.58 g/polybag. However, at
the age of 45 days after planting Deja 2 was a
genotype that had the highest dry root weight of 1.4
g/polybag or an increase of 441% from the 24 dap.
The growth of roof of DaunLancip was the highest of
other although it wasn’t the most drystover weight,
butit increase 651,5% compared by 24 dap, its about
0,8 g/polybag. Dering, Karat 13, Panderman,
GepakKuning, Dega 1 and Tanggamus only increased
47.3%, 160.7%; 265.6%; 188.9%; 103.4% and
140.5% respectively compared to 24 dap or 0.6
g/polybag; 0.8 g/polybag; 0.8 g/polybag; 0.4
g/polybag; 1.2 g/polybag; and 0.3 g/polybag. At 60
dap, only Karat 13 and Daunlancip genotypes that
increased the dry weight of roots, as many as 49.1%
and 54.8% compared to 45 dap as much as 1.15
g/polybag and 1.28 g/polybag. Deja 2, Panderman
and Dega 1 decreased dry root weight by 73% ; 62.0%
and 44.1% compared to 45 dap or about 0.4
g/polybag; 0.3 g/polybag; and 0.7 g/polybag. Dering,
GepakKuning and Tanggamus are dead on this time
(60 dap). At the age of 75 days, onlygenotypes
Daunlancip that still alive and get decreasing dry root
weight 47.7% compared to 60 dap or 0.7
g/polybag(Figure 4).
Dolatabadian (2011) result that the root dry
weight of soybean decreased with increasing NaCl
concentration. At level concentration of NaCl 25 mM,
50 mM and 100 mM, the weight of dry root decreased
45.1%; 76.8% and 90.2 % respectively from normal
condition. Queiroz et al. (2012) also reported that the
weight of root dry of soybean decreased with
increasing NaCl concentration. At level concentration
of NaCl 50 mM, 100 mM and 200 mM, the dry root
weight of soybean decreased 36.4% 42.4% and
45.5% respectively from normal condition.
Figure 4. The dry root weight of several genotypes at several
observation
3.5 Soil Salinity
Until the age of 24 dap, all genotypes still have the
same soil salinity which is 10 dS/m then get
decreasing at the age of subsequent observations. At
45 dap, the hardest decreased had occurred on Karat
0.0
1.0
2.0
3.0
4.0
5.0
6.0
24 dap 45 dap 60 dap 75 dap
Dry Stover weight (g)
Deja 2
Dering
Karat 13
Panderma
n
Gepakkuni
ng
Daunlanci
p
0
0.2
0.4
0.6
0.8
1
1.2
1.4
1.6
24 dap 45 dap 60 dap 75 dap
Dry root weight (g)
Deja 2
Dering
Karat
13
Pander
man
Gepak
kuning
Daunl
ancip
Dega1
The Growth of Several Soybean Genotypes in the Saline Soil
1639
13, Daunlancip and Dega 1 genotype. These three
genotypes have soil salinity content between 4.3
dS/m - 4.6 dS/m. While the other five genotypes have
soil salinity content ranging from 5.5 dS/m - 8.8
dS/m. The soil salinity content of Daunlancip and
Dega 1 more decreased at 60 dap, it about 3.2 to 3.7
dS/m. While Deja 2, karat 13, Panderman, has soil
salinity ranging from 4.7 dS/m - 7.23 dS/m. Dering,
GepakKuning and Tanggamus are dead from the age
of 45 dap, its caused the soil salinity does not change
from the age of 60 hst up to 75 dap.
Figure 5. The soil salinity at several observation
3.6 Discussion
Daunlancip was categorized as resistant plant to high
salinity and Karat 13 was categorized as rather
resistant. Dering, Tanggamus, GepakKuning, Deja 2,
Panderman and Dega 1 were not resistant. Plants that
can survive at saline condition were plants that can
absorb the salt content in soil and able to excrete it.
These plants relatively has low level of electrical
conductivity in the soil and get high dry biomass
weight. For these plants, K
+
and Na
+
content are
needed for efficiency of cell membrane osmosis
regulation and growth of leaf area (Shabala et al.,
2010). This plant willhave stability of K
+
and Na
+
content although the soil electrical conductivity
levels were added (Aini et al., 2014
a
).
Genotypes that are not resistant to salinesoil
will get thinning cortex, thickening of cuticle and
xylem. The decreasing of cortex thickness caused by
salinity stress. In otherside, salinity stress caused a
greater deposition of lignin in vascular tissues and/or
xylem development. So, its condition induced
acceleration of the development of xylem stems.
(Dolabadian, 2011). Furthermore, J. López-Portillo et
al (2005) report that conductivity will decreases if
stems are fullfilled with lignin of extreme salinities.
This condition may inhibited the the growth, where
water is the main element needed by plants to carry
out photosynthesis. Otherwise the genotypes that
tolerant on salin soil will get relatively lower ion
leakage through roots, larger vascular region area,
and wide metaxylem vessel in roots and stems. Its
also had greater phloem and pith cell area in stems
that increased midrib thickness, cortical cell area,
metaxylem, and vascular bundle area area in leaves
with increase in salinity level. Furthermore, the
vascular region area in roots, vascular region
thickness, leaf thickness, epidermal thickness, in
leaves were better in with an increase in salinity levels
(Younis et al., 2013).
Na
+
and Cl
-
content were generally increased
with an increasing salinity level. Its concentration in
shoot was higher than in roots. In the roots decreased
and in shoots increased under salt stress conditions.
In this salinesoil conditions, plant cells utilize K
+
as a
metabolite to maintain turgor to escape from osmotic
shock (El Sabagh et al., 2015). But for genotype that
tolerant in salinesoil, it could be low contents of Na
+
and Cl
-
in the tissues, and non-invasive micro-test
technique. Its revealed that the roots had higher
ability to extrude Na
+
and Cl
-
(Chen et al.2013).
The high K
+
and Na
+
content in plant also
reduced N and Mg uptake, where those are macro
element that needed on photosynthesis process
(Anitha and Usha, 2012, Subramanyam et al., 2012,
Aini et al. 2014
a
, Taufiq et al. 2015). Amirjani (2010)
report that salinity also decreased contents of Ca
2+
and Mg
2+
. Decreased on that contents were
significantly as salinity level increased. The contents
of Ca
2+
decreased by 36, 46 and 57% when applied
with 50, 100 and 200 mM NaCl, respectively of the
control. The content of Mg
2+
36, 38 and 33%when
applied with 50, 100 and 200 mM NaCl respectively
of the control.
Mannan et al. (2013) report that salinity
decrease in Relatif Water Conten (RWC) and
exudation on plant. Decrease of RWC was
pronounced especially at the later stages of plant
growth and at high concentrations of salinity. The
exudation rate of a plant becomes slower with
increase salinity. Decreasing exudation rate of plant
results in a lower water uptake by the plant. Water
required for plant cell turgidity and photosynthesis
process. If plant were not get enough water then the
cell turgor will be low and stomatal will close.
Stomatal closure caused the CO2 supply constrained,
then resulted photosynthetic prosess decreased (Aini
et al. 2014). The other side, a wide xylem diameter
will reduce cohesion speed that will affect the arrival
of water to the leaves then caused water uptake
0
2
4
6
8
10
12
24
dap
45
dap
60
dap
75
dap
Sioil salinity (dS/m)
Deja 2
Dering
Karat 13
Panderman
Gepakkuning
Daunlancip
Dega1
Tanggamus
ICRI 2018 - International Conference Recent Innovation
1640

decreased (Totoa and Yulismab, 2017; Hang and Mai,
2016; Khan et al., 2015). Furthermore, salinity
inhibited activation of rubisco enzyme due to the
decrease of rubisco activase content that became an
important limiting factor of photosynthesis (Chen et
al.2013) beside water. These phenomenon that caused
the weight of soybean biomass and its growth
decreased since 45 dap.
4 CONCLUSION
The soil salinity was decreased plant height, root
length, dry stover weight and dry root weight of
soybean. Decreasing of it variable were varied based
on potential defences of it genotype. Based on this
research could be said that all genotypes still live up
to 45 days, but at 60 dap, Dering,Tanggamus,
Gepakkuning was dead, and only DaunLancip can
survive up to 75 days.
REFERENCES
Abdelhamid, M., Sadak, M.SH., Schmidhalter U., El-
Saady, A.M. 2013. Interactive Effects Of Salinity Stress
And Nicotinamide On Physiological And Biochemical
Parameters Of Faba Bean Plant. Acta biologica.
Colombiana. Vol.18(3):499-510.
Agarwal, N., Kumar, A., Agarwal, S., Singh, A.. 2015.
Evaluation of Soybean (Glycine max L.) Cultivars
Under Salinity Stress During Early VegetativeGrowth.
nt.J.Curr.Microbiol.App.Sci Vol. 4(2):123-134.
Aini, N., Sumiya, W.D.Y., Syekhfani, Purwaningrahayu
R.D., Setiawan. A., 2014a. Study of Growth,
Chlorophyll Content and Results of Soybean (Glycine
max L.) Genotypes in Salinity Conditions".
Proceedings of the 2014 Suboptimal Land National
Seminar in Palembang September 26-27, 2014. ISBN:
979-587-529-9. (in Indonesia).
Aini, N., Sumiya, W.D.Y., Syekhfani, Purwaningrahayu
R.D., Setiawan. A., 2014b. Growth and physiological
characteristics of soybean genotypes (glycine max l.)
Toward salinity stress. Vol. 36, No. 3.
Ali Khan, M.S., Karim, M.A., Al-Mahmud, A., Parveen, S.,
Bazzaz, M.M., Hossain, M.A., 2015. Plant Water
Relations and Proline Accumulations in Soybean Under
Salt and Water Stress Environment. Journal of Plant
Sciences; 3(5): 272-278.
Amirjani, M.R. 2010. Effect of Salinity Stress on Growth,
Mineral Composition, Proline Content, Antioxidant
Enzymes of Soybean. American Journal of Plant
Physiology. Volume 5(6): 350-360.
Anitha, T., Usha, R., 2012. Effect of Salinity Stress On
Physiological Biochemical And Antioxidant Defense
Systems Of High Yielding Cultivars Of Soybean.
Internat. J. Pharma and Bio Sciences Vol. 4, No.
8,pp:851-864.
Bustingorri, C., Lavado, R., 2011. Soybean Growth Under
Stable Versus Peak Salinity. Sci. Agric. (Piracicaba,
Braz.), Vol.68, No.1, p:102-108.
Badan Pusat Statistik [BPS]. 2018. https://www.bps.go.id/
(Accessed Oktober 2018).
Chen, P., Yan, K., Shao, H., Zhao, S. 2013. Physiological
Mechanisms for High Salt Tolerance in Wild Soybean
(Glycine soja) from Yellow River Delta, China:
Photosynthesis, Osmotic Regulation, Ion Flux and
antioxidant Capacity. Journal Plos One. Vol. 8(12): 1-
12.
Dolatabadian A., Modarresanavy, S.A.M., Ghanati, F.,
2011. Effect of Salinity on Growth, Xylem Structure
and anatomical characteristic of soybean. Notulae
Scientia Biologicae No. 3, Vol. 1, pp. 41-45.
El Sabagh, A., Omar, A.E., Saneoka, H., Barutçular, C.,
2015. Physiological Performance Of Soybean
Germination And Seedling Growth Under Salinity
Stress. Dicle University Institute of Natural and
Applied Science Journal. 4(1): 6-15
Farhoudi, R., Tafti, M.M., 2011. Effect of Salt Stress On
Seedlings Growth & Ions Homeostasis Of Soybean
(Glycine max) Cultivars. Adv. Environ. Biol. 5: 2522-
2526.
Hang., H.T., Mai, L.Q., 2016. Effects of Salinity on
Soybean (Glycine max[L.] Merr.) DT26 Cultivar.
Natural Sciences and Technology Vol. 32, No. 15. p:
227-232.
HashiU.S.,Karim, A., Saikat, H.M.,Islam, R., Islam, M.A.,
2015. Effect of Salinity and Potassium Levels on
Different Morpho-Physiological Characters of two
Soybean (Glycine max L.) Genotypese. J Rice
Research. Vol.3 , No.3. P:1-5.
Hoseini, E.S., Delbari, M. 2015. Column leaching
experiments on saline soils of different textures in
Sistan plain. Journal Desert 20(2):207-215.
Kai Shu, Ying Qi, Chen, F., Meng, Y., Luo, X., Shuai,
H., Zhou, W., Ding, J., Du, J., Liu, J., Yang, F., Wang,
Q., Liu, W., Yong, T., Wang, X., Feng, Y., Yang, W.
2017. Salt Stress Represses Soybean Seed Germination
by Negatively Regulating GA Biosynthesis While
Positively Mediating ABA Biosynthesis. Front Plant
Sci.; 8: 1372.
Kuruseng, M.A., Farid, M., 2009. Analysis of Heritability
of Salinity-Resistant Corn and Drought Result of
Mutation Induction with Gamma Rays.
JurnalAgrisistem. Vol 5.No.1.(in Indonesia)
Kristiono, A., Purwaningrahayu, R.D., Taufiq, A., 2013.
Response of Soybeans, Peanuts, and Green Beans
Against Salinity Stresses. BuletinPalawija, Vol 26, pp.
45–60. (in Indonesia).
Kumar, A. 2017. Germination Behaviour of Soybean
Varieties under Different Salinity Stress. International
Journal of Applied Agricultural Research Vol 12(1):
69-76.
Mannan, M.A., Karim, M.A., Haque, M.M., Khaliq, Q.A.,
Higuchi, H., Nawata, E.. 2013. Response of Soybean to
The Growth of Several Soybean Genotypes in the Saline Soil
1641

Salinity: Water Status and Accumulation of Mineral
Ions.Tropical Agricultural Develop. 57(1)41
-
48.
Nasri, N., Saïdi, I., Kaddour, R., Lachaâl M. 2015. Effect
of Salinity on Germination,Seedling Growth and Acid
Phosphatase Activity in Lettuce. American Journal of
Plant Sciences , Vol (6): 57-63.
Purwaningrahayu, R.D., Taufiq, A., 2017. Morphological
Response of Four Soy Genotypes to Salinity Stresses,
JurnalBiologi Indonesia, No.13, Vol. 2, pp. 175-188.
(in Indonesia)
Putri, P.H., Susanto, G.W.A., Artari, R.. 2017. Response of
soybean genotypes to salinity in germination stage.
Nusantara Bioscience 9 (2): 133-137.
Queiroz, H.M., Sodek L., Haddad C.R.B. 2012. Effect of
salt on the growth and metabolism of Glycine max.
Brazilian Archives of Biology and Technology. Vol.
55(6): 809-817.
Rachman, A., Subiksa, I.G.M., Erfandi, D., Slavich P.,
2008.Dynamics of tsunami affected soil properties. P
51-64. In: F.Agus and G. Tinning (Eds.). Proc. Of Inter.
Workshop on Post Trunami Soil Management. 180 pp
Shabala, S., Shabala, S., Cuin, T.A., Pang, J., Percey, W.,
Chen, Z., Conn, S., Eing, C., Wegner, L.H., 2010.
Xylem ionic relations and salinity tolerance in barley ”,
J. Agro Complex, Vol. 61, pp. 839-853.
Subramanyam, K., Arun, M., Mariashibu, T., Theboral, J.,
Rajesh, M., Singh, N.K., Manickavasagam, M.,
Ganapathi, A., 2012. Overexpression of tobacco
osmotin (Tbosm) in soybean conferred resistance to
salinity stress and fungal infections. Planta Vol 236. No
6. pp:1909-1925.
Taufiq, A., Purwaningrahayu, R.D., 2014. Effect of saline
stress on the performance of mung bean varieties in the
germination phase. P: 465-477. In: N. Saleh et al. (Eds).
Proceedings of the 2013 National Conference ILETRI,
Malang, May 22, 2013.
Tsegay, B.A., Gebreslassie, B. 2014. The effect of salinity
(NaCl) on germination and early seedling growth of
Lathyrus sativus and Pisum sativum var. abyssinicum.
African Journal of Plant Science. Vol. 8(5): 225-231.
Younis, A., Riaz A., Ikram S., Nawaz T., Hameed M.,
Fatima S., Batool R., Ahmad F. 2013. Salinity-induced
structural and functional changes in 3 cultivars of
Alternanthera bettzickiana (Regel) G.Nicholson.
Turkish Journal of Agriculture and Forestry. 37: 674-
687.
Yuniati, R. 2004. Penapisan Galur Kedelai Glycine max (l.)
Merrill Toleran Terhadap Nacl Untuk Penanaman Di
Lahan Salin. MAKARA SAINS, Vol. 8(1): 21-24.
Yunita, S.R., Sutarno, Fuskhah, E., 2018. Response of
several varieties of Soybean (Glycine max L. Merr) to
the level of watering salinity, J. Agro Complex, No. 2,
Vol.01, pp: 43-51. (in Indonesia).
Totoa, Yulismab L., 2017. Analysis of the Application of
Style Concepts in Physics Related to the Field of
Biology". Jurnal Penelitian & Pengembangan dalam
Pendidikan Jasmani, No.1, Vol. 3, pp: 63-72. (in
Indonesia)
ICRI 2018 - International Conference Recent Innovation
1642
