
Effects of Phonolgical Input as Pre-listening Activity on L2 Listening
Comprehension Test: A Quasi-experimental Study at Students of
English Education Department at Faculty Tarbiyah and Educational
Sciences UIN Syarif Hidayatullah Jakarta
Neneng Sunengsih
1
1
UIN Syarif Hidayatullah Jakarta, Indonesia
Keywords: phonological input; pre listening activity; listening comprehension test
Abstract: Effects of Phonolgical Input as Pre-Listening Activity on L2 Listening Comprehension Test. The purpose of
this study is to find out the empirical evidence concerning whether phonological input as pre-listening
activity affects the English Listening comprehension test . The Pre-listening activity is used to make the
students easier in comprehending the spoken ideas. because it helps them to give a clear picture about the
ideas that related to the topic. The writer is interested in conducting this research by applying the
phonological input as pre-listening activity to facilitate them in understanding the idea, so it is easy for them
to do the English listening comprehension test. The method used in this research is a quantitative method
and the research design is a quasi-experiment. The sample of this research is the first semester of students of
Department of English Education of Faculty Tarbiyah and Educational Sciences UIN Syarif Hidayatullah
Jakarta 2016 . They are class I B as the experimental class, and I A as the controlled class. Each class
consisted of 20 students. For sampling technique, the writer uses purposive sampling. The instrument used
in this research was listening test from Cambridge Preleminary English Test and the PET table and rubric to
get the scores of the student’s listening comprehension test on the pre and post-test. The result of calculation
shows that in the significance degree of 5% and 1%, the value of t-test (t
o
) > t-table (t
t
), (2.02 < 2.92 >
2.71). Based on the result, it is concluded that there is a significant difference between students’
achievement in listening comprehension test which is taught with pre-listening activity and without it. It
means that phonological input as pre-listening activity is effective for the first semester students to
understand the spoken idea.
1 INTRODUCTION
The presence of pre-listening activities in the
classroom will be the subject of an increase in the
number of studies to help students do better on the
L2 listening comprehension test. so far researchers
have examined four types of pre-listening activities:
repeated input, question preview, topic preparation,
and vocabulary pre-teaching. Repeated input and
question previewing seems to be a very common
practice in class. However, in tests such as the
English Language Test for International
Communication (TOEIC), the Test of English as a
Foreign Language (TOEFL), and the International
English Language Testing System (IELTS), it is not
possible to listen to the text twice, so students must
be accustomed to listening to oral texts only once to
prepare for the testing situation. As for preview
questions, it is not always considered a pre-listening
activity. Topic preparation seems to be an effective
technique when listening to lectures whose content
is difficult to understand for those who have no
knowledge of the topic.
Knowledge of previous topics has helped
students understand the content of lectures (Chiang
& Dunkel, 1992). However, the approach is not very
significant in the case of TOEIC, because tests
measure communicative abilities in everyday life
and in the workplace and thus require little or no
knowledge of special academic background. Being
able to handle spoken language is still important for
success at TOEIC.
As students of English Education Department,
they must formally learn the subject Listenings since
1290
Sunengsih, N.
Effects of Phonolgical Input as Pre-listening Activity on L2 Listening Comprehension Test: A Quasi-experimental Study at Students of English Education Department at Faculty Tarbiyah and
Educational Sciences UIN Syarif Hidayatullah Jakarta.
DOI: 10.5220/0009926612901297
In Proceedings of the 1st International Conference on Recent Innovations (ICRI 2018), pages 1290-1297
ISBN: 978-989-758-458-9
Copyright
c
2020 by SCITEPRESS – Science and Technology Publications, Lda. All rights reserved

they are at the first year up to the second year which
is distributed on Listening I – IV. It is stated on the
syllabus that Listening I has an objective to make
the students understand the main TV programmes on
current affairs or topics of personal or professional
interest when the delivery is relatively slow and
clear. Considering the students come from different
background of senior high schools, Listening I starts
from the basic level. It still remains that not all of
them get understanding the basic spoken discourses.
In the classroom, some of the students still find
the difficulty in comprehending the spoken language
from the audio, either in getting the main idea or the
supporting details. To get the main idea, the students
are given some questions asking for the topic i.e.
predicting what the conversation will talk about, the
ending of the conversation, their opinions to the
topic and discussing or sharing with others in the
classroom. To get the details, they are given the
detail question by scanning the information starting
from the spelling, the unfamiliar words, identifying
the places/things/persons, and detail information
about the topic. They sometimes do not feel familiar
with the topic, so they find some unfamiliar
vocabularies. In this study we will study vocabulary
pre-teaching to find out if there are differences
between the two different types of vocabulary pre-
teaching: vocabulary activities with phonological
input and one without phonological input. In
particular, this study investigates whether
phonological input facilitates student vocabulary
learning and test results. Then examine how the two
different types of lexical support affect the second
language of the students (L2) listening to the
comprehension test performance. Post interviews
with several students were also conducted to obtain
additional information, and the results were
investigated in depth to reveal the implications of
the observed effects of pre-listening activities.
2 METHOD OF THE RESEARCH
This study used quantitative method with a
quasi-experimental study as the research design to
identify the effectiveness of phonological Input as
pre-listening on L2 listening comprehension test at
Department of English Education Faculty of
Tarbiyah and Educational Science UIN Syarif
Hidayatullah Jakarta. Pre-test and post-test are taken
in two classes; experimental and controlled class.
There was a different treatment between
experimental and controlled class. In experimental
class, the writer gave a treatment with phonological
input as pre-listening activity whereas the students in
controlled class were taught without the
phonological input as the pre-listening activity.
This study was conducted in the first year of the
first semester students of the Department of English
Education at UIN Syarif Hidayatullah Jakarta. This
research has been carried out for about three months
from September to October 2016. This research was
held in six meetings each class; pre-test, treatment in
four times, and post-test.
The population of the study consisted of the first
semester students of the first year in the Department
of English Eduction at Faculty Tarbiyah and
Educational science UIN Syarif Hidayatullah
Jakarta. There are three classes, IA, IB and IC. The
total of the first grade students was about 95
students. The samples of this research were; class IB
as the experimental class and IB as the controlled
class. In this study, the writer used Purposive
Sampling.
The instrument was Cambridge Preliminary
English Test 2 (PET); pre-test and post-test. The pre-
test was given before the treatment and the post-test
was given after the treatment. Here, the writer gave
the instruction of the tests based on the syllabus of
listening I which is taken from Common European
Framework of Reference (CEFR) assessment, level
B1.
Table 2: Common Reference Levels: self-assessment grid
UNDER
STANDI
NG
LISTE
NING
B1 LEVEL
I can understand the
main points of clear
standard speech on
familiar matters
regularly encountered in
work, school, leisure,
etc. I can understand the
main point of many
radio or TV programmes
on current affairs or
topics of personal or
professional interest
when the delivery is
relatively slow and clear
To collect the data, the wrier used a preliminary
English Test (PET) 2 as the primary instrument.
There are two types of tests; pretest and posttest.
The pre-test was given in experimental and control
class to know how far the students’ listening
comprehension before receiving treatment. The post-
Effects of Phonolgical Input as Pre-listening Activity on L2 Listening Comprehension Test: A Quasi-experimental Study at Students of
English Education Department at Faculty Tarbiyah and Educational Sciences UIN Syarif Hidayatullah Jakarta
1291

test was given to know their listening
comprehension after the treatment. The pre-test and
post-test included in these processes:
The study conducted on September 9th 2016.
The students were observed in the classroom to
know the circumstances of English learning and
teaching of Listening.
The pre-test was given in control class on August
15
th
and in experiment class on September 16
th
2016.
On September 22
nd
until October 7
th
2016, the certain
treatment was conducted in the experimental class
by giving the phonological pre-listening activity in
teaching listening.
The post-test was given to control class On
October 13rd,
2016, and in experimental class on
October 14
th
, 2016.
After getting the whole data, the result of the
students’ score in pre-test and post-test were
calculated by using the some formulations.
So, at the end of the study, it could be seen how
far the students’ ability and confidence were
increased in listening comprehension with the
phonological input as the pre-listening activity.
In analyzing the data, the t
test
formula was used
through SPSS (Special Package of the Social
Sciences) version 22 software. The t-test is one of a
number of hypothesis tests. The normality and
homogeneity tests were conducted before calculating
the t-test. The normality test is performed using
Kolmogrov Smirnov and Shapiro-Wilk.
Homogeneity test is performed to show whether the
data from the two groups, experimental and
controlled class, have the same variant in order that
the hypothesis can be tested by t-test or not.
After getting the data from pre-test and post-test
from experimental and control class, it needed to
find out the differences score after using the pre-
listening activity. Here, the two classes are
compared to the independent variable, the
experimental class is X variable and the controlled
class is Y variable. The writer used statistical
calculation of the t-test with significant degree 5%
and 1%. The formula of t
test
is expressed as follows
(Sudjono:2008):
3 DISCUSSION
Based on the result of pre-test in experimental
class, the highest score and the lowest score in the
experimental class those consist of 20 students. In
pre-test, the highest score was 73 obtained only by
one student and the lowest score in pre-test was 35
obtained by one student. The mean score of the
pretest was 49.75. From that data, it could be seen
that most of the experimental students’ listening
comprehension test was still very low.
In post-test, the mean score of post-test was
improved and it was 66. Moreover, the mean of
gained score was 16.25. The highest score of post-
test was 80 obtained by two students and the lowest
score in post-test was 43 obtained only by one
student.
Based on the result of pre-test in controlled
class, it can be showed that the highest score and the
lowest score in the controlled class which consisted
of 20 students. In pre-test score, the highest score
was 65 obtained by two students and the lowest
score was 38 obtained by three students. The mean
score of pre-test was 49.95. From that data, it could
be seen that most of the controlled students’ writing
ability in writing recount text was also still very low.
In post-test, the mean score of post-test was
improved and it was 58.35 and the mean of gained
score was 8.4. The highest score of post-test was 79
obtained only by one student and the lowest score in
post-test was 38 obtained by three students.
Moreover, there were two students whom the pre-
test score is higher than post-test score. From the
data description above, it could be concluded that
there was still positive effect towards the students’
achievement in listening comprehension test
although was not taught using the phonological input
as the pre-listening activity.
Table 3:
Table of Data Description of Pre-test Result
of Experimental Class
The table above shows that the total students of
experimental class, X.2, consisted of 20 students.
Mean score (49.75) of pretest in experimental class
was gained from the total or sum score (995) divided
with the number of the students (20). Median score
was 48.50. Mode score from the table was 40. The
ICRI 2018 - International Conference Recent Innovation
1292

mode is defined as the element that appears most
frequently in a given set of elements. Range score
was 38. The highest score of the pre-test in
experimental class was 73 and the lowest was 35.
The results of pre-test score in controlled class
of this research are presented in the table 4:
Table 4: Table of Data Description of Pre-test Result of
Controlled Class
The table above shows the pre-test data of class
IB as the controlled class was 20 with sum 999.
Mean score was 49.5. Median and mode scores from
the data were 51.00 and 38. The highest score was
65 and the lowest score was 38.
Table 5: Table of Data Description of Post-test
Result of Experimental Class
The table above shows that the data of class IA
as the experimental class was 20 students. The total
score of this class was 1320. The mean score of the
data was 66.00, and then the median data was 65.50.
After the treatment, the highest score in post-test of
experimental class was 80 and the lowest score was
43. The results of post-test score in controlled class
of this research are presented in the table 6:
Table 6: Table of Data Description of Post-test Result of
Controlled Class
From the table above, the data of class IB as the
controlled class was 20 students. The total score of
this class was 1167 where it was lower than the
experimental class. The mean score was 58.35 and
the median score was 41. The highest score in post-
test of controlled class was 79 and the lowest score
was 38.
The result of normality test on both
experimental and controlled class’ pre-test and post-
test was gained from Lilliefors test using SPSS 22.
The test is determined if the distribution of the data
from the sample is normal. If the normality is more
than the level of significance α(0.05), scores will be
normally distributed.
After doing the normality test, the homogeneity
test is used to test whether the data from the two
groups have the same variant in order the hypotheses
can be tested using t-test. The following tables
contained the result of homogeneity from pre-test
score between experimental and controlled class.
Table 7: Homogeneity Pre-test Results between
Experimental and Controlled Class
Test of Homogeneity of Variances
Pretest
Levene Statistic df1 df2 Sig.
.140 1 38 .711
Statistics
Control
N Valid
20
Missing
20
Mean
58.35
Median
62.00
Mode
38
Range
41
Minimum
38
Maximum
79
Sum
1167
Statistics
Experiment
N Valid 20
Missing
20
Mean 66.00
Median 65.50
Mode 78
a
Range 37
Minimum 43
Maximum 80
Sum 1320
a. Multiple modes exist. The
smallest value is shown
Effects of Phonolgical Input as Pre-listening Activity on L2 Listening Comprehension Test: A Quasi-experimental Study at Students of
English Education Department at Faculty Tarbiyah and Educational Sciences UIN Syarif Hidayatullah Jakarta
1293

Table 8: Homogeneity Post-test Results between
Experimental and Controlled class Test of Homogeneity
of variances
From the result of the Levene Statistic Test
above, it could be seen that the significance of the
data from experimental and control’s pre-test score
was 0.711 and the post-test was 0.579. It means the
significance of the data was higher than the
significance degree (α = 0.05). The result of
homogeneity test shows that pre-test and post-test
between experimental and controlled class had
homogeny distribution and can be tested using t-test.
Table 9: The Comparison Score between Students in
Experimental Class and Students in Controlled Class
After doing the normality and homogeneity test,
the researcher continued to do hypothesis testing.
Here, the researcher used comparative technique or
independent sample t-test to test the hypothesis. This
was the crucial calculation to answer the problem
formulation of this research. The independent t-test
was used to see the significant difference in the post-
test score of the experimental and the controlled
class after the given treatment.
After getting the data which are the result of
students’ listening comprehension score both of
two classes, the writer analyzes them by using
statistic calculation of the t-test formula on table 9.
Notes:
X = the difference of the experimental class’ post
and pre-test
Y = the difference of the controlled class’ post and
pre-test
X
2
= the degree of the difference of the experimental
class’ post and pre-test
Y
2
= the degree of the difference of the controlled
class’ post and pre-test
After that, the researcher calculated the
gained score by using t-test formula. The
formulation as followed:
1. Determining mean of Variable X:
2. Determining Mean of Variable Y:
3. Determining Standard of Deviation Score of
Variable X:
4. Determining Standard of Deviation Score of
Variable Y:
5. Determining Standard Error of Mean of
Variable X:
6. Determining Standard Error of Mean of
Variable Y:
Posttest
Levene
Statistic df1 df2 Sig.
.313 1 38 .579
ICRI 2018 - International Conference Recent Innovation
1294

7. Determining Standard Error of Difference of
Mean of Variable X and Y:
8. Determining
with the formula:
Based on the calculation above, it showed that
the result of the t-test from the experimental and
controlled class is 2.92.
After that, the writer should find the degree of
freedom. It is used to find out the value of the t-test
score in the t-table. To get the value of the t-test
from the t-table, the researcher used the value of the
significant of 5% and 1%. The procedure to get the
degree of freedom is as follow:
Based on the calculation above, the degree of
freedom (df) is 38 and the critical value of the df 38
by using the degree of significance 5% is 2.02.
Moreover, the critical value of the df38 by using the
degree of significance 1% is 2.71 and the t
o
is 2.92.
It can be said that the result of the comparison
between t
o
and t
table
were 2.02 < 2.92 > 2.71. It
means that there is a significant difference between
the score of pre-test and post-test.
The statistical hypothesis of this research could
be seen as follows:
H
o
: there is no significant difference between
students’ listening comprehension test using
the phonological input as the pre-listening
activity and without the pre-listening activity.
It means that the phonological input as the
pre-listening activity is not effective.
H
1
: there is significant difference between
students’ listening comprehension test using
the phonological input as the pre-listening
activity and without the pre-listening activity.
It means that the phonological input as the
pre-listening activity is effective.
The assumption of this hypothesis is as follows:
1. If t-test (t
o
) > t-table (t
t
) in significant degree of
0.05, H
o
(null hypothesis) is rejected, it means
that there is significant difference between
students’ achievement in listening
comprehension test after using the phonological
input as pre-listening activity and without using
the phonological input. The use of the
phonological input as pre-listening activity is
effective on students’ listening comprehension
test.
2. If t-test (t
o
) < t-table (t
t
) in significant degree of
0.05, H
o
(null hypothesis) is accepted. It means
that there is no significant difference between
students’ achievement in listening
comprehension test after using the phonological
input as pre-listening activity and without using
the phonological input. The use of the
phonological input as pre-listening activity is
not effective on students’ listening
comprehension test.
Based on the description of the calculation above, it
can be inferred that:
a) The value of t
table
in the significance 1% is 2.71
and 5% is 2.02
b) The value of t
o
is 2.92
c) So the result is 2.02 < 2.92 > 2.71. It means that
t
o
(t observation) is higher than t
t
(t table).
Thus, it can be summarized that t
o
t
t
(2.02 <
2.92 > 2.71) it means that the null hypothesis (H
0
) is
rejected and the alternative hypothesis is accepted.
The research found empirical evidence that using the
phonological input as pre listening activity is
effective for the students to learn listening
comprehension because there is a significant
difference students’ listening comprehension score
after implementing the pre-listening activity.
The discussion of this research is based on the
research question, which was to know the empirical
evidence on the effects of phonological input as pre-
listening activity on listening comprehension test on
the first year’ students of Department of English
Education at Faculty of Tarbiyah and educational
sciences UIN Syarif Hidayatullah Jakarta. Based on
the post-test result was known that the students’
Effects of Phonolgical Input as Pre-listening Activity on L2 Listening Comprehension Test: A Quasi-experimental Study at Students of
English Education Department at Faculty Tarbiyah and Educational Sciences UIN Syarif Hidayatullah Jakarta
1295

listening comprehension test showed the differences
in both experimental and controlled class. The mean
of pre-test score in experimental class is 49.75. The
mean of pre-test score in controlled class is 49.95.
Then, comparing with the mean of post-test in
experimental class is 66 and in controlled class is
58.35.
There were 20 students in each class
(experimental and controlled class). Therefore,
degree of freedom (df) is (20+20) – 2 = 38. The
critical value with df38 of significance 5% is 2.02
and significance 1% is 2.71.The t
o
is 2.92, it means
that t
o
= 2.92 is higher that the degree of significance
1% and 5%, 2.02 < 2.92 > 2.71. Therefore, t
o
is
higher that t
t
which the null hypothesis (H
o
) is
rejected and alternative hypothesis (H
1
) is accepted.
From those results, it can be interpreted that
post-test score of the experimental class and
controlled class increased better than the pre-test.
Although the mean of post-test score from both class
increased, the experimental class has more
increasing than controlled class. Thus, it can be
concluded that the phonological input as pre-
listening activity is an effective way to use in
learning listening comprehension for the first year
students of DEE Faculty Tarbiyah and Educational
sciences.
4 CONCLUSION
Based on the result of the data analysis, It can
be concluded that the result of t-test formula to test
the hypothesis of the research is supported the
effects of phonological input as pre – listening
activity on listening comprehension test. The writer
finds mean score at post-test in the experimental
class (66.00) is higher than post-test in controlled
class (58.35). Students’ post-test score in
experimental class is ∑X = 1320 higher than in
controlled class ∑X = 1167. After calculated the
whole formula, the researcher got the result that t
o
=
2.92 and t
table
from the significance 5% and 1% are
2.02 and 2.71. It means that is 2.02 < 2.92 > 2.71.
The researcher can concluded that Null Hypothesis
is rejected because t
o
>t
table
..It means that the answer
of research problem was proven. There was a
significant difference in students’ achievement in
listening comprehension test using the phonological
input as pre-listening activity.
From the previous description finally it is
concluded that using phonological input as pre-
listening activity is effective for the first year
students of Department of English Education at
Tarbiyah and Educational Sciences UIN Syarif
Hidayatullah Jakarta. It can be seen from the
research findings that Faculty the students show
their improvement significantly in listening
comprehension test.
REFERENCES
Berne, J. E. (1995). How does varying pre-listening
activities affect second language listening
comprehension? Hispania, 78(2), 316–329.
Boyle, J. P. (1984). Factors affecting listening
comprehension. ELT Journal, 38(1), 34–38.
Buck, G. (1991). The testing of listening comprehension:
An introspective study. Language
Testing, 8(1), 67–91.
Cervantes, R., & Gainer, G. (1992). The effects of
syntactic simplification and repetition on listening
comprehension. TESOL Quarterly, 26(4), 767–770.
Chang, A. C-S. (2005). Question preview in EFL listening
comprehension tests. New Zealand Studies in Applied
Linguistics, 11(2), 75–96. Chang, A. C-S. (2007). The
impact of vocabulary preparation on L2 listening
comprehension, confidence and strategy use. System,
35(4), 534–550.
Chang, A. C-S., & Read, J. (2008). Reducing listening test
anxiety through various forms of listening support.
TESL-EJ, 12(1), 1–25.
Chaudron, C. (1983). Simplification of input: Topic
reinstatements and their effects on L2 learners’
recognition and recall. TESOL Quarterly, 17(3), 437–
458.
Educational Testing Service. (2008). Official guide to the
new TOEIC test, Vol. 3. [TOEIC tesuto shin koshiki
mondaishu, Vol. 3] Tokyo: International Business
Communication.
Gu, Y., & Johnson, R. K. (1996). Vocabulary learning
strategies and language learning outcomes. Language
Learning, 46(4), 643–679.
Pickering, M. (1982). Context-free and context-dependent
vocabulary learning: An experiment. System, 10(1),
79–83.
Sherman, J. (1997). The effect of question preview in
listening comprehension tests. Language Testing,
14(2), 185–213.
Taglieber, L. K., Johnson, L. L., & Yarbrough, D. B.
(1988). Effects of prereading activities on EFL reading
by Brazilian college students. TESOL Quarterly,
22(3), 455–472.
ICRI 2018 - International Conference Recent Innovation
1296
APPENDIX 1
Table of the students’ scores in Experimental
class (X)
Students Posttest Pretest Gained
1 62 52 10
2 65 46 19
3 78 64 14
4 80 42 38
5 43 35 8
6 70 41 29
7 65 50 15
8 43 38 5
9 69 52 17
10 60 40 20
11 61 42 19
12 78 51 27
13 70 40 30
14 61 49 12
15 78 65 13
16 80 73 7
17 80 71 9
18 54 40 14
19 66 56 10
20 57 48 9
∑
1320 995 325
Mean
66 49.75 16.25
In pre-test, the highest score was 73 obtained
only by one student and the lowest score in pre-test
was 35 obtained by one student. The mean score of
the pretest was 49.75.
In post-test, the mean score of post-test was
improved and it was 66. Moreover, the mean gained
score was 16.25. The highest score of post-test was
80 obtained by two students and the lowest score in
post-test was 43 obtained only by one student.
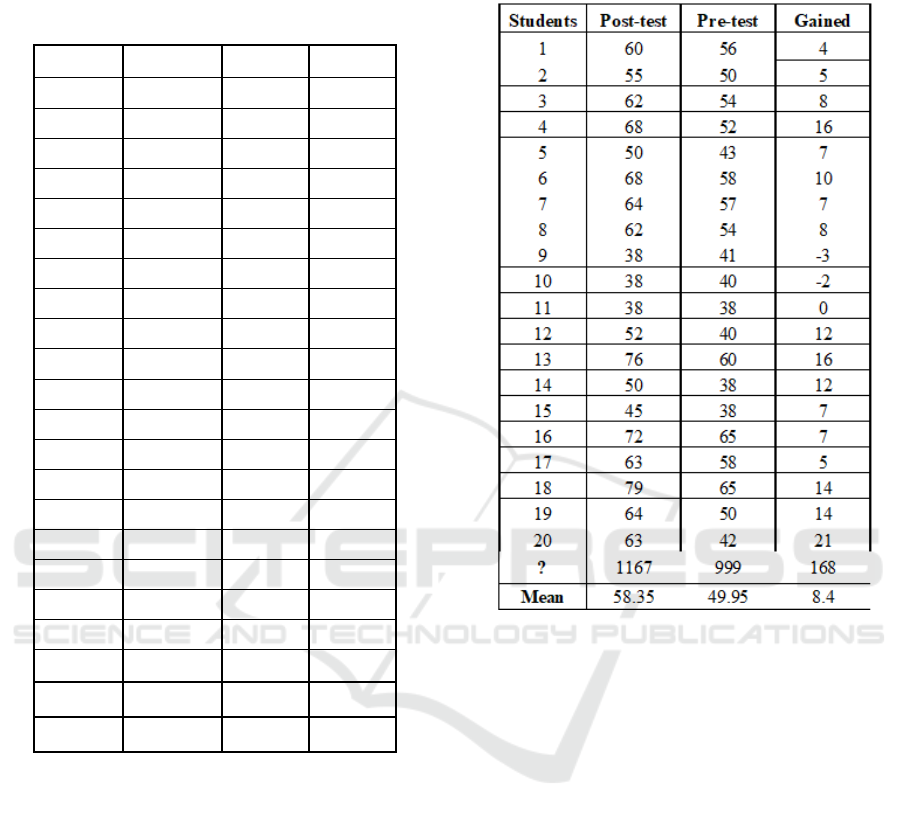
APPENDIX 2
Table of the students’ scores in controlled class
(Y)
In pre-test score, the highest score was 65
obtained by two students and the lowest score was
38 obtained by three students. The mean score of
pre-test was 49.95.
In post-test, the mean score of post-test was
improved and it was 58.35 and the mean gained
score was 8.4. The highest score of post-test was 79
obtained only by one student and the lowest score in
post-test was 38 obtained by three students.
Effects of Phonolgical Input as Pre-listening Activity on L2 Listening Comprehension Test: A Quasi-experimental Study at Students of
English Education Department at Faculty Tarbiyah and Educational Sciences UIN Syarif Hidayatullah Jakarta
1297
