
A One Year Performance Evaluation of an Amorphous Grid
Connected PV System Facade Mounted at Bou-Ismail, Algeria
S. Berkane
1,2
, A. Mahrane
1
, M. Chikh
1
and M. Haddadi
2
1
Unité de Développement des Equipements Solaires /UDES Centre de Développement des Energies Renouvelables
/CDER,42415.W.Tipaza,Algérie
2
Laboratoire des Dispositifs de Communication et de Conversion Photovoltaïque LDCCP / École Nationale Polytechnique
d’Alger, El-Harrach, W.Alger.Algeria
Keywords: PV system, BAPV, Amorphous Silicon PV module, Outdoor performance
Abstract: This paper treats one year monitoring of a 2.4 kWp amorphous grid connected PV system facade mounted at
UDES’ site located at BouIsmaïl (latitude 36.66, longitude 2.71), Algeria, in a coastal zone of Mediterranean
Sea. The operational and meteorological data are collected between January 2016 and November 2016.
During the monitoring period, the PV system has generated about 850kWh with a daily average energy of
3.25 kWh/d. The daily average of the final yield, the performance ratio and the capacity factor are 1.35h/d,
0.57 and 6.29% respectively. The capture and system losses are 0.87h/d and 0.15h/d respectively.
1 INTRODUCTION
To satisfy the growing demand of electricity and
reduce the greenhouse gas emissions that lead to
global warming, Renewable Energies seems to be one
of the relevant solutions to be adopted.
As the residential sector is the largest consumer of
energy, about 40% of the total energy consumed in
the world (
A. Khuram Pervez et al.,2017), and as the
most of the buildings and houses are located in the
cities it appears that the Building Integrated
Photovoltaic (BIPV) and Building Added
Photovoltaic (BAPV) may represent a powerful
solution to meet the ever increasing demand by zero
energy and zero emissions buildings.
As the available areas to install the PV plant on the
roofs in the cities are very limited, the facades could
be used to increase at the same time the size of the PV
array and the production of electricity.
In order to explore the potential of the BAPV system
a 12.5 kWp photovoltaic pilot plant composed of six
photovoltaic arrays of different technologies which
are connected to the grid and integrated on the
conference room of the UDES Unit is investigated.
The crystalline PV modules are installed on the roof
while the thin film PV modules are mounted on the
facades. This choice is dictated by the fact that the last
modules are cheaper than the crystalline, and less
sensitive to temperature even if there are installed on
the walls. However, their efficiency is lower than that
of crystalline module but more stable in diffuse solar
radiations.
This paper treats the case of one of the six subsystems
composing the on grid PV platform namely the
amorphous silicon (a-Si) photovoltaic subsystem. At
first, a description of the a-Si PV system is given, then
the experimental results obtained during the test
period ranging from January 2016 to December 2016
are presented.
Figure 1: View of the 2.4 kWp amorphous Silicon
facade mounted PV plant
Berkane, S., Mahrane, A., chikh, M. and Haddadi, M.
A One Year Performance Evaluation of an Amorphous Grid Connected PV System Facade Mounted at Bou-Ismail, Algeria.
DOI: 10.5220/0009775003970404
In Proceedings of the 1st International Conference of Computer Science and Renewable Energies (ICCSRE 2018), pages 397-404
ISBN: 978-989-758-431-2
Copyright
c
2020 by SCITEPRESS – Science and Technology Publications, Lda. All rights reserved
397
Finally, the evaluation and analysis of the
performance of the a-Si PV plant is conducted for the
monitoring period.
2 SYSTEMS DESCRIPTION
2.1 PV System Description
The 12.5 kWp Multi technology solar PV plant grid
connected is located at UDES BouIsmaïl (latitude of
36°38, longitude of 2°41), and altitude of 13 m above
sea level, Algeria. It consists of six independent sub
system, each of them using one type of solar cells
technology (mono Si, poly Si, or thin films). The aim
of the study is to follow up the 2.4kWp amorphous
Silicon (a-Si) thin film PV plant mounted on the
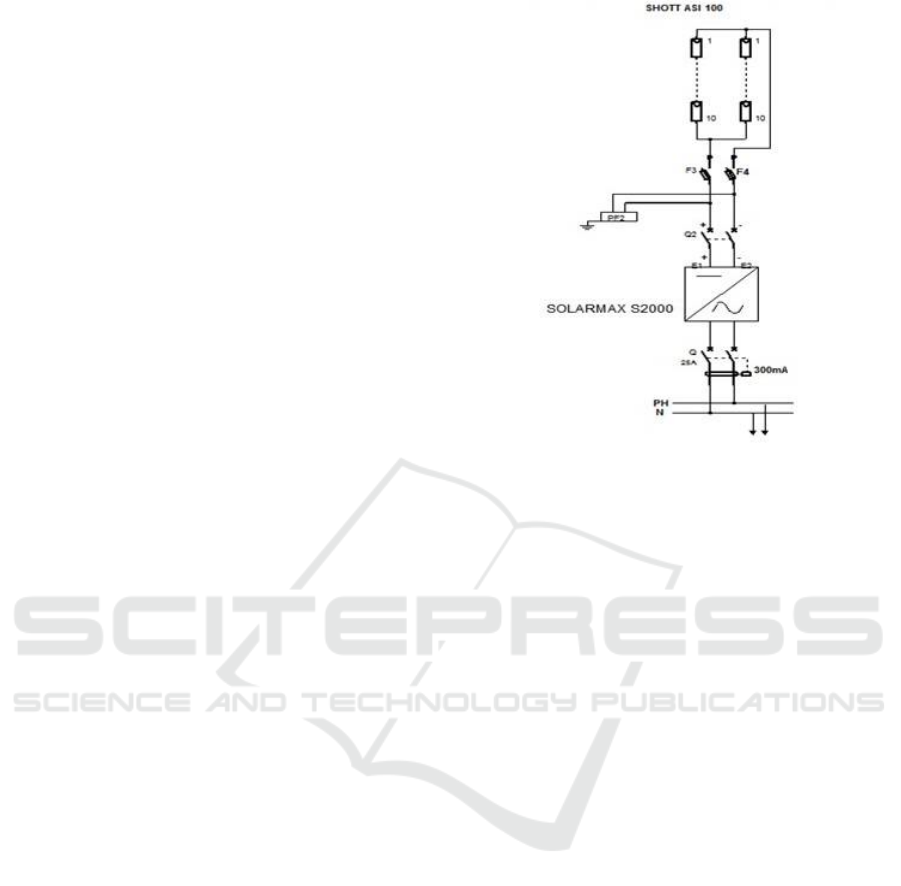
facade of the conference room, Fig1. Its electrical and
technical properties are summarized in Table 1. This
PV plant is composed by 20 a-Si Schott modules
configured in two strings, each string consists of 10
modules in serial. The overall surface area of PV
plant system is 30m².The a-Si PV generator is
connected to the grid through a SOLARMAX
S2000inverter as shown in Fig 2.
2.2 Monitoring System Description
The PV system is fully monitored with Solarlog
300data logger. It is linked to the inverter through
RS485 cable. The recorded data provided by the
inverter are: the DC current and voltage, the AC
current and voltage and the DC and AC power. The
radiometric and metrological data are measured and
collected by a meteorological station installed at
UDES site, BouIsmaïl. The irradiance on vertical
plane used in this study is measured by a-Si reference
cell located in the same plane as the a-Si PV modules.
The data are recorded and saved at a pace of 5mn. The
monitoring system was designed to meet the standard
IEC 61724(
Chikh M et al.,2015).
Figure 2: Diagram of the 2.4kWp a-Sigrid connected
PV plant.
3 PERFORMANCE
PARAMETERS
The evaluation of the PV system performance is done
according to the performance parameters defined in
the IEC 61724 standard (IEC 61724,1998), and given
in the following:
ICCSRE 2018 - International Conference of Computer Science and Renewable Energies
398

Table 1: SCHOTT a-Si PVmodule and SOLARMAXS2000
inverter characteristics.
Module Specifications
Manufacturer SCHOTT
model ASI-100
Cell type a-Si/a-Si tandem
Nominal power P
max
[W] 100
Open circuit voltage V
oc
[V] 40.9
Short circuit curant I
cc
[A] 3.93
Voltage at maximum powerV
mpp
[V] 30.4
Curant at maximum power I
mpp
[A] 3.29
Efficiency ᶯ
m
[%]
6.9
Number of cell 72
Module surface A
m
[m²] 1.45
Inverter Specifications
Manufacturer SOLARMAX
model S2000
DC nominal voltage Vin[V] 600
DC power Pdc[w] 2000
DC voltage range Vdc[V] 100-550
AC nominal power Pac[VA] 1980
Nominal AC voltage Vac[V] 230/184-300
Efficiency ᶯ
ond
[%]
97
3.1 System Energy Output
The total daily E
(AC,d)
and monthly E
(DC,m)
,E
(AC,m)
energy generated by the PV system is given by
(
Sharma V, et al.,2013):
,
E
,
1
,
E
,
2
,
E
,
3
Where Nis the number of days in the month, E
(AC,t)
is
the instantaneous measured energy.
3.2 Inverter and System Efficiency
The instantaneous inverter efficiency is calculated as
(
Chikh M et al.,2015):
4
Where the P
dc
and, P
ac
are respectively the DC and
AC power.
The monthly system efficiency is calculated by
(
Chikh M et al.,2015):
,
.
.100
5
Where G
t
is the total in plane radiation (Wh/m²), and
A
m
the PV array area (m²).
3.3 Reference Yield(Yr)
The reference yield is the total in-plane solar
insolation H
t
(kW h/m²) divided by the array
reference irradiance (1 kW/m
2
) (Kymakis E, et al). This
parameter represents the equal number of hours at the
reference irradiance and is given by:
1
6
3.4 Array Yield (Ya)
The array yield Ya is defined as the energy output
from a PV array over a defined period (day, month or
A One Year Performance Evaluation of an Amorphous Grid Connected PV System Facade Mounted at Bou-Ismail, Algeria
399

year) divided by its rated power (
Sharma V, et
al.,2013) and is given by:
,
7
3.5 Final Yield (Yf)
The final yield is defined as the annual, monthly or
daily net AC energy output of the system divided by
the rated power of the installed PV array at standard
test conditions (STC) of 1 kW/m2solar irradiance and
25°C cell temperature. This is a representative figure
that enables comparison of similar solar PV power
plant in a specific geographic region. It is independent
on the type of mounting, vertical on a facade or
inclined on a roof and also on the location (
Tripathi B,
et al.,2014)
and is given by:
,
7
8
3.6 Performance Ratio (PR)
The Performance Ratio (PR) is a measure of the
quality of a PV plant that is independent of location.
Therefore, it is often described as a quality factor. The
(PR) is stated as percent rate and describes the
relationship between the actual and theoretical energy
outputs of the PV plant. It shows the proportion of the
energy that is actually available for export to the grid
after deduction of the energy loss (e.g. due to thermal
losses and conduction losses) and of energy
consumption for operation.
In real life, a value of 100 % cannot be achieved,
because unavoidable losses always arise with the
operation of the PV plant (e.g. thermal loss due to
heating of the PV modules). High-performance PV
plant scan however reach a performance ratio of up to
80 % (
SMA Solar Technology AG )The PR is given by:
9
3.7 Capacity Factor
The capacity factor (CF) is a means to present the
energy delivered by an electric power generating
system. If the system delivers the full rated power
continuously, its CF would be unity. The capacity
factor (CF) is defined as the ratio of the actual annual
energy output to the amount of energy that the solar
PV power plant could generate if it is operated at full
rate power (P
pv,rated
)for 24 h per day for a year (Tripathi
B, et al.,2014) and is given by:
24∗365
,
∗8760
10
3.8 Array Capture Losses
The array capture losses (Lc) are due to the PV array
losses and are given by (Ayompe L M, et al.,2010):
11
3.9 System Losses
The system losses (Ls) are induced by the inverter and
are given by (
Ayompe L M, et al.,2010):
4 RESULTS AND DISCUSSION
4.1 Meteorological Data
The total irradiation received on the PV
generator during the monitoring period is
833.55kWh/m². Figure 3 shows the evolution of the
monthly solar energy received by the array which
varies between 2.16 kWh/m².d recorded in January
2016 and 3.18 kWh/m².din September 2016. This
variation is predictable considering the sun's
trajectory relative to the PV field located in a vertical
plane. The maximum irradiation was reached during
the month of September which coincides with the
beginning of the fall and which is favorable for the
vertical inclinations.
Figure 3: Monthly average daily irradiation respectively on
the vertical plan of the PV array and on the optimal angle
for the site (36°).
ICCSRE 2018 - International Conference of Computer Science and Renewable Energies
400
It could be noticed that the PV array on the vertical
plane receives less solar irradiation than it could have
received if it is installed on an inclined plane with an
optimal angle of 36 ° for the site. The irradiation
losses were the highest in June (53.71%) and the
lowest in November (21.62%).
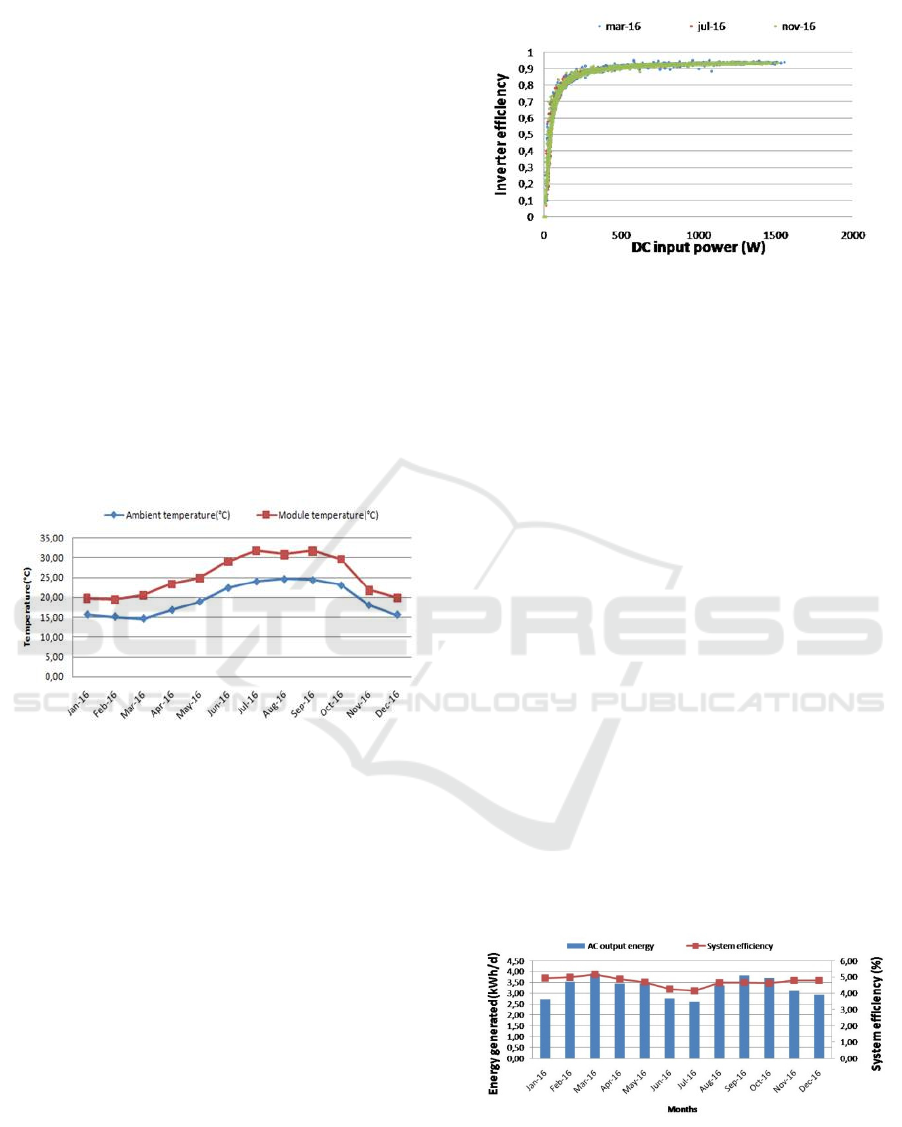
The ambient temperature of the site of BouIsmaïl
doesn’t exceed, the value 30 ° C all over the year and
this is due to the specific Mediterranean climate of the
location. The average monthly ambient temperature
and the back module temperature during the
monitoring period are shown in fig 4.
The average monthly ambient temperature varies
between 14.65 ° C in March and 24.63 ° C in August,
while the average monthly PV module temperature
varies between 19.5°C in February and 31°C in July.
Because of the fact that the temperature increase of
the amorphous modules is only 10°C, it can be
concluded that the influence of the temperature can
be considered negligible. This is due to the low value
of the temperature coefficient of the a-Si material.
Figure 4: Monthly average ambient temperature and
module temperature over the monitored period.
4.2 DC Power Input and Inverter
Efficiency
Figure 5 shows the variation of the inverter efficiency
with the DC power input for three months. It could be
noticed that the inverter operates with stability when
AC power input is greater than200W with an average
efficiency of 90.2%. When the DC power input is
under 200W, the efficiency decreases drastically due
to the fact that the DC voltage of the PV array is not
in the operating range of the inverter.
Figure 5: Inverter efficiency
4.3 Energy Output and PV System
Efficiency
The output energy and the efficiency of the PV
system are calculated using equations (2) and (3)
respectively. During 12 months the PV system has
produced about 850kWh, with an annual PV system
efficiency of 4.76% which is in the range efficiency
of the a-Si PV system. From the Figure 6, it could be
seen that the monthly output energy and the PV
system efficiency are mainly influenced by the solar
irradiation received on the vertical plane during each
month. Their values were comprised between
(2.60kWh/d and 4.68%) in July and (3.90kWh/d and
5.65%) in March respectively.
4.4 Reference Yield, Array Yield and
Final Yield
The reference yield (Yr), the array yield (Ya) and the
final yield (Yf) of the studied a-Si PV plant are given
in figure 7. It appears that the monthly values of
reference yield Yr ranged between1.9 kWh/kWp.d in
January and 2.82kWh/kWp.d in September.
Figure 6: Monthly average AC output energy and efficiency
of the a-Si PV system.
Ya varies between 1.28 kWh/kWp.d in July and 1.63
kWh/kWp.d in March and Yf varies between1.08
A One Year Performance Evaluation of an Amorphous Grid Connected PV System Facade Mounted at Bou-Ismail, Algeria
401
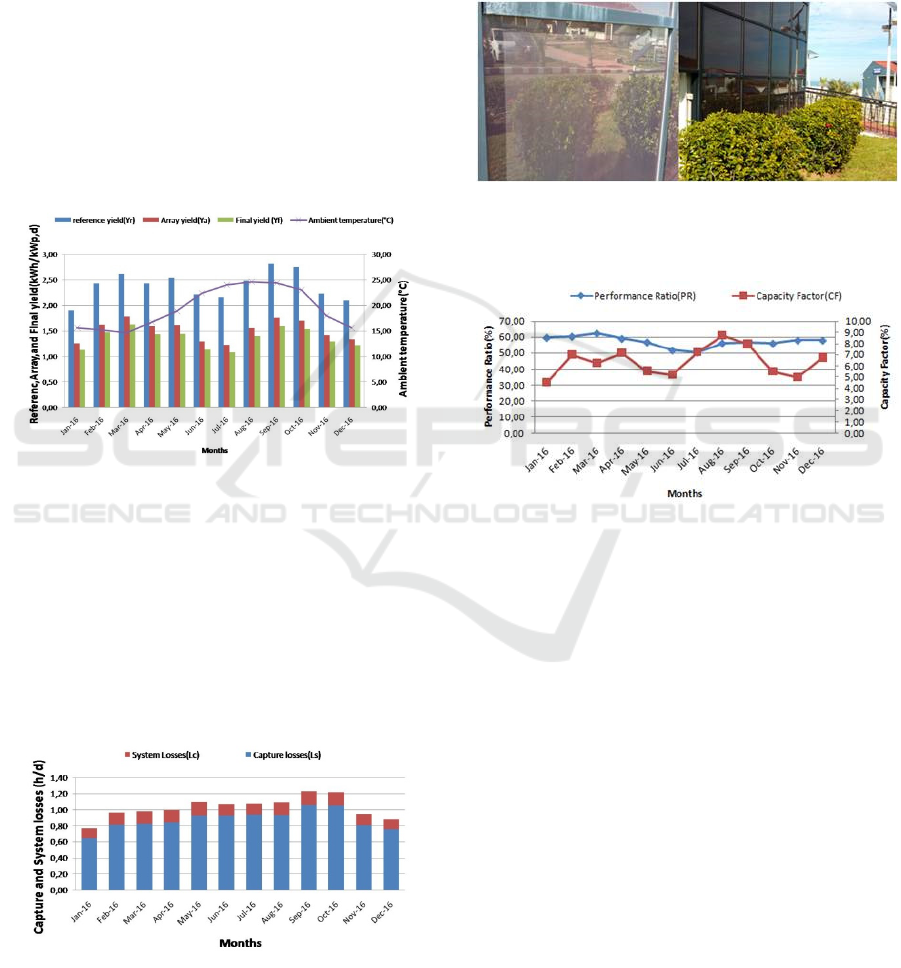
kWh/kWp.d in july and 1.59kWh/kWp.d in
September. As expected, it could be seen from Figure
7 that for the a-Si PV array the temperature variation
has less influence on the Yf than the irradiation.
4.5 Captures Losses and System Losses
Figure 8 shows the monthly average daily capture and
system losses through the monitoring period. The
capture losses (Lc) are very significant and vary
between 0.64 h/d in January and 1.06 h/d in
September. This is mainly due to two probable
reasons.
The first one, which is obvious, is related to the
vertical position of the PV plant which reduces hardly
the amount of solar irradiation received.
Figure 7: Monthly average daily system’s final yield
Yf,reference yield Yr and array yield Ya.
The second reason concerns the partial shading due to
the holder structure of the modules and the vegetation
(cf. Figure9).
However, the system losses are relatively low and
ranged from 0.12h/d in January to 0.17 h/d in May
and September, thanks to the good efficiency of the
inverter.
Figure 8: Monthly average capture and system losses
4.6 Performance Ratio and Capacity
Factor
Figure 10 shows the results of PR and CF. The results
showed that the PR varied between 0.51in July and
0.62 in March and it has an annual value of 0.57,
meanwhile the CF varies between 4.53 % in January
and 8.72 % in August with an annual value of 5.68%.
Figure 9: View of partial shading components around the
PV plant system
Figure 10: Performance Ratio and Capacity Factor of the a-
Si PV system.
The results of works published in the IEA report on
thin film systems show, that the performance of 14
thin PV systems installed on the facade have their PR
ranged between 0.61 and 0.84 with an average of 0.72
(
Lee H M, et al.,2016).
Compared to a-Si vertical PV installations appearing
in Table 2, the UDES a-Si PV system has a slightly
lower PR (0.57) compared to the (
Lee H M, et
al.,2016).and (Rustu E and Ali S,2013) facilities with a
PR of 0.69 and 0.74 respectively. This is due to the
reasons mentioned above namely the shading and the
orientation of the strings of the PV plant.
ICCSRE 2018 - International Conference of Computer Science and Renewable Energies
402

Table 2: Performance comparison of different amorphous grid-connected PV systems in different locations.
Location Installationtype Cell type Capacity
(kWp)
PR System
efficiency
(%)
réf
South Korea vertical BIPV
South facing
a-Si thin film
(10%Transmittanc)
10.6 0.69 - (Lee H M, et
al.,2016).
Morocco Rooftopinclined a-Si/a-Si tandem 1.86 0.73 7.21 Amine H, et
al.,2017)
Turkey On twers (vertically
installed)
a-Si Single junction
10.24 0.74 5.58
(
Rustu E
and Ali
S,2013)
Turkey Onfacade (60tilted) a-Si Triple junction 30.15 0.81 5.99
(
Rustu E
and Ali
S,2013)
Algeria FacadeVertical
South facing
a-Si/a-Si tandem 2.4 0.57 4.76 Present Study
5 CONCLUSIONS
The 2.4 kWp amorphous Silicon grid connected PV
system facade mounted at BouIsmaîl, was monitored
between January 2016 and December 2016, in the
context of providing information on this type of
facility in order to see their potential for the BAPV
application. Its performances were evaluated and
presented in this paper, the main conclusions are as
follows:
As the system is mounted on the facade, the
losses of solar radiation are considered in
comparison with the radiation received at an
optimum inclination. Their values are 53%
maximum in summer and 19% in winter.
During the monitoring period the system
supplied 850 kWh to the grid. This
production is strongly related to the amount
of radiation received, while the influence of
the temperature is not noticeable.
The average annual reference yield is 1.36
kWh/kWp.d and it reaches the maximum
2.82 kWh/kWp.din fall (September) and 1.9
kWh/kWp.din spring (May).
Due to the poor design of the holder
structure of the modules, the shadows
caused by the obstacles in front of the PV
field and the vertical position of the PV field,
the capture losses are high(0.88h/d). In
contrast,the system losses are
negligible(.0.139h/d).
During the monitoring period the system
contributed to the decrease of the CO2
emissions by 510 kg (Lee H M, et al.,2016).
REFERENCES
Khuram Pervez A, Muhammad Waqar A, Anzar M, Anila
K, Muhammad Y, Bilal A, Ghulam Qadar C, Syed
Kashif H, 2017. Energy Consumption Forecasting for
University Sector Buildings, Energies, vol. 10, no. 10,
p. 1579.
Chikh M, Mahrane A, and Berkane S, 2015. Performance
Analysis of a Grid Connected Micro-morphous Silicon
PV Pilot Plant After Eight Months Monitoring, 3rd
International Renewable and Sustainable Energy
Conference (IRSEC), IRSEC.2015.7455113.
International Standard IEC 61724, 1998. Photovoltaic
system performance monitoring - guidelines for
measurement, data exchange, and analysis.
Sharma V, Kumar A, Sastry O S, and Chandel S S, 2013.
Performance assessment of different solar photovoltaic
technologies under similar outdoor conditions, Energy
58(2013) 511e518, July.
Kymakis E, Kalykakis S, and Papazoglou T M, 2019.
Performance analysis of a grid connected photovoltaic
park on the island of Crete, Energy Conversion and
Management 50 (2009) 433–438.
Tripathi B, Yadav P, Rathod S, and Kumar M, 2014.
Performance analysis and comparison of two silicon
material based photovoltaic technologies under actual
climatic conditions in Western India, Energy
Conversion and Management 80 (2014) 97–102,
February 2014.
SMA Solar Technology AG, Performance ratio Quality
factor for the PV plant, Technical Information.
Ayompe L M, Duffy A, McCormack S J, and Conlon M,
2010. Measured performance of a 1.72 kW rooftop grid
connected photovoltaic system in Ireland, Energy
Conversion and Management 52 (2011) 816–825.
A One Year Performance Evaluation of an Amorphous Grid Connected PV System Facade Mounted at Bou-Ismail, Algeria
403

Lee H M, Yoon J H, Kim S C, U. Shin U C, 2016.
Operational power performance of south-facing vertical
BIPV window system applied in office building, Solar
Energy.
Rustu E and Ali S, 2013. Monitoring the performance of
single and triple junction amorphous silicon modules in
two building integrated photovoltaic
(BIPV)installations, Applied Energy 109 154–162.
Amine H, Bouchaib H, Abderrazzak E, Mehdi K and
Abderraouf R, 2017. Performance Indicators for Grid-
Connected PV Systems: A Case Study in Casablanca,
Morocco. IOSR Journal of Electrical and Electronics
Engineering (IOSR-JEEE).
ICCSRE 2018 - International Conference of Computer Science and Renewable Energies
404
