
Design and Control of an Autonomous Photovoltaic System with
Battery Charge Regulateur using the MPPT Control Followed by PI
Correctors
Essaid Ait El Maati
1
, Abdallah Boulal
1
, Ahmed Mouhsen
2
, Azeddine Mouhsen
1
1
Laboratory of radiation - matter & Instrumentation, University Hassan the first,
Faculty of Science and Technology, Settat, Morocco
2
Laboratory of Engineering, Industrial Management and Innovation, University Hassan the first,
Faculty of Science and Technology, Settat, Morocco
Keywords: Autonomous photovoltaic system, battery charger, SEPIC converter, BOOST converter, PI controller,
MPPT intelligent control.
Abstract: An Autonomous photovoltaic (PV) system requires a battery charger to store energy for consumption during
the night and during days with low irradiation. This paper presents the design of the PV charger system
modulator and controller implemented with the asymmetric primary inductance converter (SEPIC). The
designed SEPIC is controlled by the MPPT (Pando) command to extract the maximum power of the PV
generator. To the used MPPT control, a PI control regulator has been added to manage the charge loop of
the battery. Subsequently, a BOOST converter has been associated with the system to adapt the output
voltage of the battery to the load. The modeling of the state space is done to determine the transfer function
of the converters (SEPIC and BOOST). The values of the PI correctors (Kp and Ki) are obtained using the
method of Ziegler Nichols. Finally, we simulated and analyzed the performance of a 250W stand-alone
photovoltaic power system on MATLAB- Simulink.
1 INTRODUCTION
With the depletion of fossil fuel reserves, economic
crises due to soaring oil prices, accidents at nuclear
power plants such as Three Mile Island (USA, 1979)
and Chernobyl (USSR, 1986), aswell as Fukushima
(Japan 2011)public interest in renewable energies
continues to grow. Of the various sources of
renewable energy, photovoltaic occupies a
prominent place (S. Gueye, 2014). In stand-alone
photovoltaic systems, batteries are widely used to
power loads in the absence of sunshine or in the
event of a failure of the solar energy system. These
batteries are sensitive to overload, deep discharge
and temperature and current drift. It is then
necessary to associate them with a regulator to
ensure their protection. The importance of a charge
controller in an autonomous photovoltaic system is
obvious. However, it must be well designed to meet
the requirements of cost,simplicity, and reliability
(S. Gueye, 2014) (S. J. Chiang,2009).
The objective of this work is the study of an
autonomous photovoltaic system with a battery
charger for energy storage, controlled by an MPPT
command with two PI correctors, one intended for
the control of the state of charge battery discharge
and the other to adapt the output voltage of the
battery to the load. The article is structured as
follows: we start with the presentation of the
operation of the autonomous photovoltaic system,
then the modeling of the state space of the
converters (SEPIC and BOOST), after the method of
Ziegler and Nichols is presented to determine the
values of PI correctors, later we present the system
control algorithm and finally the results and the
discussion.
Ait El Maati, E., Boulal, A., Mouhsen, A. and Mouhsen, A.
Design and Control of an Autonomous Photovoltaic System with Battery Charge Regulateur using the MPPT Control Followed by PI Correctors.
DOI: 10.5220/0009773303490358
In Proceedings of the 1st International Conference of Computer Science and Renewable Energies (ICCSRE 2018), pages 349-358
ISBN: 978-989-758-431-2
Copyright
c
2020 by SCITEPRESS – Science and Technology Publications, Lda. All rights reserved
349
2 AUTONOMOUS
PHOTOVOLTAIC SYSTEM
An autonomous photovoltaic system is one that
produces electricity through the sun, but operates
independently of the electricity grid. In the majority
of cases, this system is used in isolated sites where it
would be much too expensive to connect the house
or the room that you want to supply with electricity.
The major difference with a standard photovoltaic
installation (connected to the grid) is the presence of
batteries. An autonomous photovoltaic system must
be able to provide energy, even when there is no
more sun (at night or in bad weather). It is therefore
necessary that a part of the daily production of the
photovoltaic modules is stored. Below is the
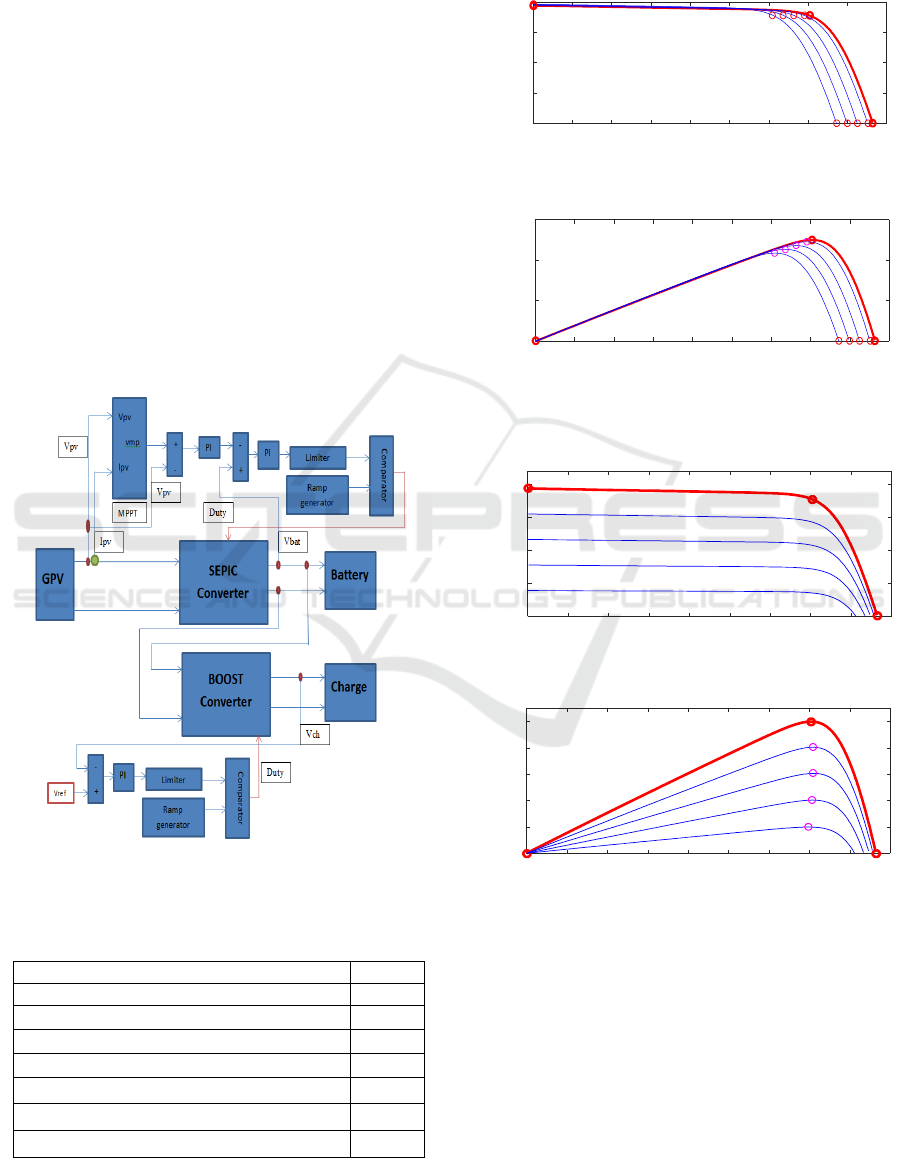
synoptic diagram of our autonomous photovoltaic
system that consists of a GPV with a SEPIC type
converter to charge the battery and a BOOST
converter to power our load (S. J. Chiang,2009)(D.
S. Karanjkar, S. Chatterji, S. L. Shimi, and A.
Kumar, 2014).
Figure 1: Synoptic diagram of the photovoltaic system
The PV module directly converts sunlight into direct
current. Here, the chosen PV module is of American
Solar Wholesale type ASW-250P of following
characteristics:
Table 1: Characteristic of the PV module.
Figure 3:Ppv=f(Vpv) for influence of
temperature
Figure 5:Ppv=f(Vpv) for influence of Illumination
3 MODELING THE CONVERTER
3.1 SEPIC Converter
A SEPIC is a type of DC-DC converter
allowing the electrical potential (voltage) at its
output to be lower, greater or equal to that at its
input.
American solar wholesale ASW-250P Value
Maximum power(W) 249.92
Open circuit volatgeVoc(V) 43,22
Short-ciruitcurantIsc (A) 7.76
Voltage at maximum power point Vmp(V) 35.2
Current at maximum power point Imp(A) 7.1
Shunt resistance Rsh(ohms) 111.87
Series resistance Rsh(ohms) 0.42
051015 20 25 30 35 40 45
Voltage (V)
Figure 4:Ipv=f(Vpv) for influence of Illumination
0
2
4
6
8
C
u
r
r
e
n
t
(
A
)
Array type: American Solar Wholesale ASW-250P
1000W/m
2
800W/m
2
600 kW/m
2
400 W/m
2
200W/m
2
051015 20 25 30 35 40 45
Voltage (V)
0
50
10
15
20
25
P
o
w
e
r
(
W
)
1000W/m
2
800W/m
2
600W/m
2
400W/m
2
200W/m
2
05 11223344
Voltage (v)
Figure 2:Ipv=f(Vpv) for influence of temperature
0
2
4
6
8
C
u
r
r
e
n
t
(
A
)
Array type: American Solar Wholesale ASW-250P
2
o
C
3
o
C
4
o
C
5
o
C
6
o
C
05 11223344
Voltage (V)
0
100
200
300
P
o
w
e
r
(
W
)
2
o
C
3
o
C
4
o
C
5
o
C
6
o
C
Array type: American Solar Wholesale ASW-250P
ICCSRE 2018 - International Conference of Computer Science and Renewable Energies
350
The use of the SEPIC converter (which can
play the role of a boost converter if > 0.5 or
step down if <0.5) is explained by the fact
that the voltage delivered by the panel is
greater than the voltage of the battery which is
24 V and has the advantage of having a non-
inverted output (S. J. Chiang, 2009).
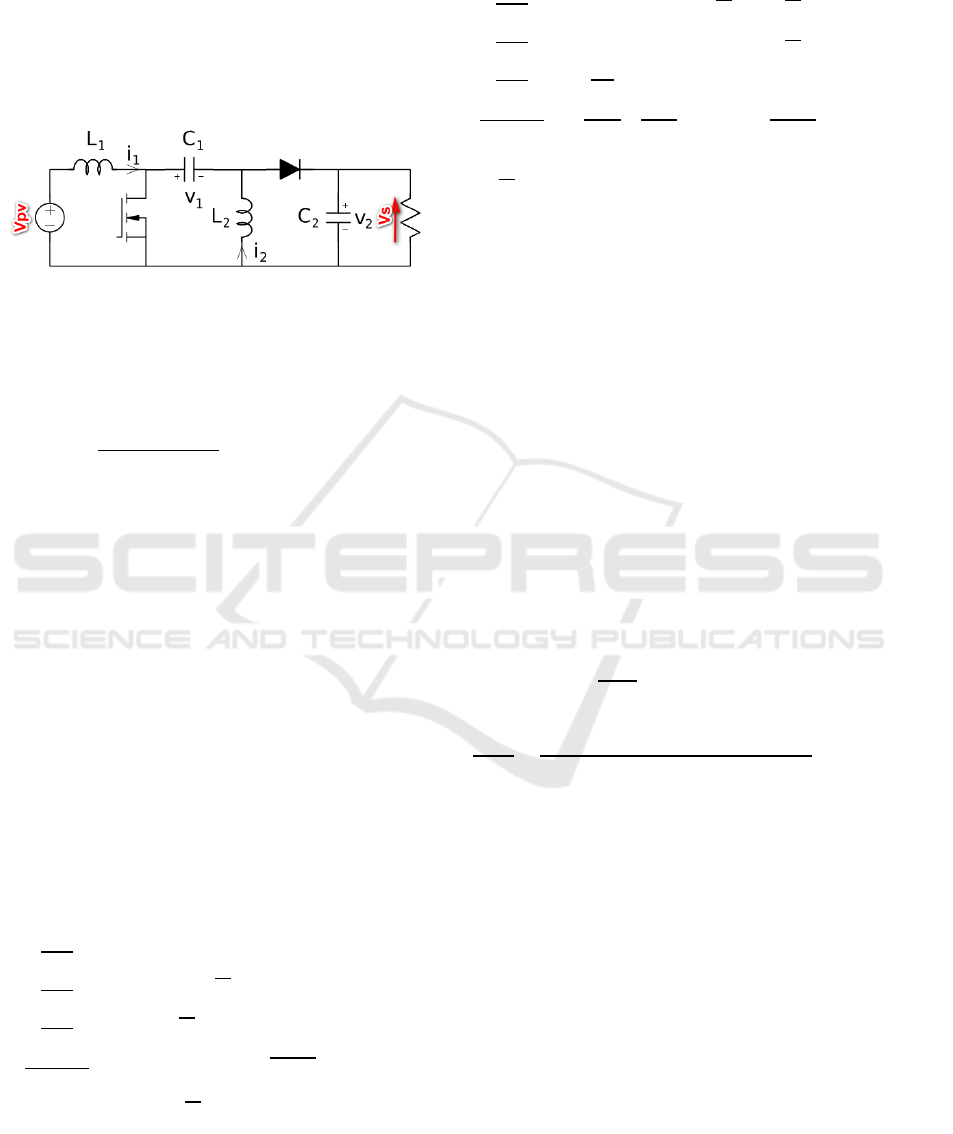
Figure 6: Circuit diagram of the SEPIC converter
For a SEPIC converter operating in continuous
conduction mode (CCM), the duty cycle is given by
(B. Paranthagan, 2015):
α
VsV
VsVpvV
wiht01
The PI regulator is used to monitor the state of
charge-discharge of the battery and to size these
parameters Ziegler and Nichols have proposed a
method that requires the recording of the index
response in open loop, just record the answer index
of the process alone (i.e. without the regulator), then
draw the tangent to the point of inflection of the
curve. To do this the determination of the transfer
function of the converter is mandatory.
The state space model (Chun T. Rim, Gyu B. Joung,
and Gyu H. Cho, 1991) is used to determine this
function. The ON state mode and the OFF state
mode are given in equations (2) and (3),
respectively, which can be obtained from the
differential equation model (B. Paranthagan, 2015).
So if the transistor is in ON state:
000 0
00
0
0
00
000
I
I
V
V
0
0
0
V
And if the transistor is in OFF state:
00
000
00 0
0
I
I
V
V
0
0
0
V
In the case of a linear system, the state
representation is in the form:
xAxBu
yCx
The variables:
x (t): State Vector
u (t): Vector of the entries
y (t): Vector of the outputs
A: state matrix
B: input matrix
C: output matrix
The transfer function can be written in this way
by applying the Laplace transform (Marie Chantal,
NiyomanziSebutimbiri, 2016):
Ys
Us
CSlA
B
V
V
A
S
A
S
A
SA
A
S
A
S
A
S
A
SA
Avec:
A
L
C
L
α
A
L
C
Rα²
A
α²L
A
α²R
A
1α²L
C
L
C
R
A
1α²L
C
L
A
1α
RL
C
1α
L
C
1α
C
L
1α
L
C
α²
A
1α
L
1α
L
α²
A
1α
R
For our study we apply the values of Table 2
obtained after sizing of our converter or I determine
the constants of the model (6).
(1)
(3)
(4)
(6)
(7)
(5)
(2)
Design and Control of an Autonomous Photovoltaic System with Battery Charge Regulateur using the MPPT Control Followed by PI
Correctors
351
The values of the inductances are calculated as
follows:
The values of the output and coupling capacitors are
calculated as follows:
Table 2: Dimensioning of the SEPIC converter.
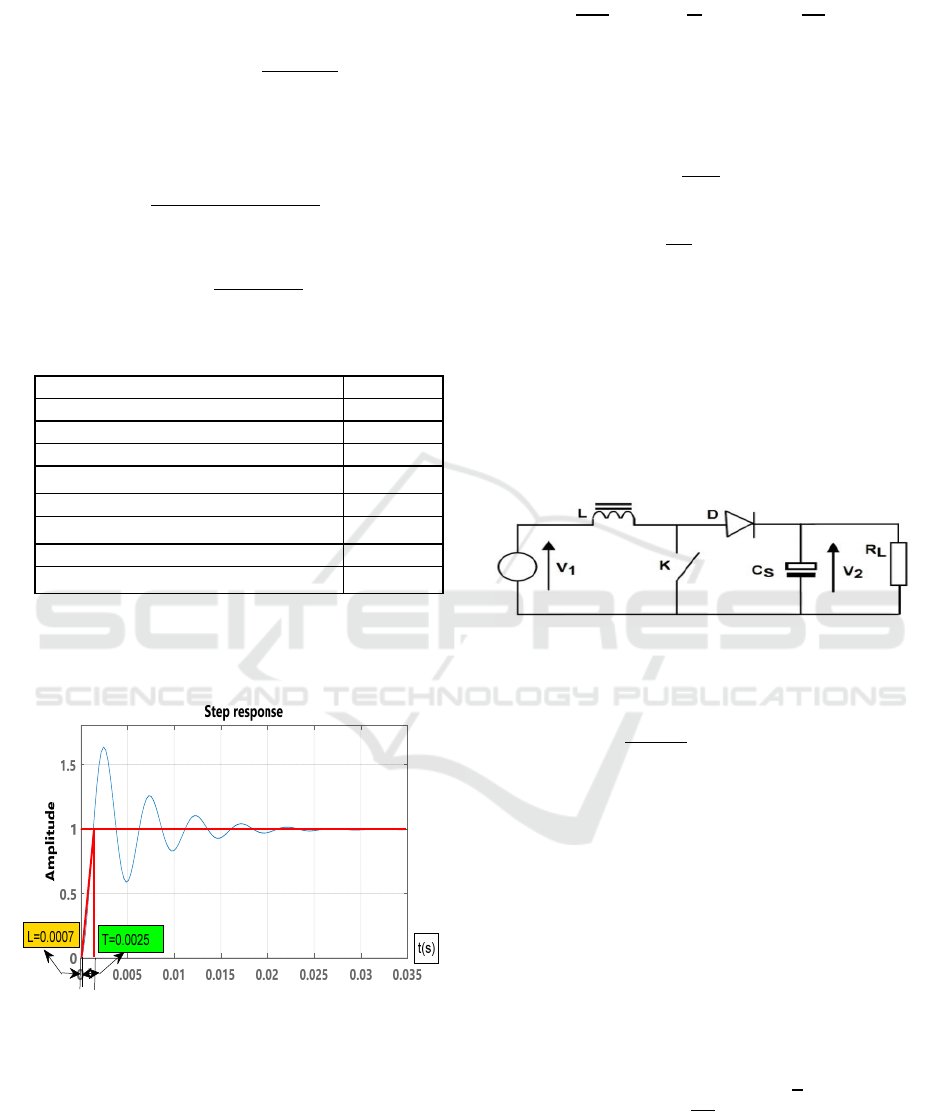
The following figure illustrates the open-loop step
response of the SEPIC converter.
Figure 7: Open loop index response of the SEPIC
converter
From the index response, the two constants namely
the delay time L = 0.0007s and the time constant T =
0.0025s are obtained.
The transfer function of the PI controller is written
in general form:
k
k
1
Using the Ziegler and Nichols settings, we obtain the
values of our PI controller (Smitha K, 2012)
(Mitulkumar R, 2012):
K
0.9T
L
3.21
T
L
0.3
0.0023s
3.2 Modellingof the BOOST Converter
With this type, the average output voltage V
2
is
greater than that of the input V
1
. The use of the
BOOST converter is for the sake of adapting the
output voltage of the battery to the load (S.S.Shinde,
2016).
Figure 8: Circuit diagram of the Boost converter
The duty cycle in CCM mode is given by:
α
V
V
V
avec01
To adapt the output voltage of the battery to the load
the PI regulator is used, these parameters are
obtained by the use of Ziegler and Nichols method.
To make this study the determination of the
transfer function of the converter is mandatory.
Following the same procedure of the SEPIC
converter we have (Smitha K, 2012):
If the transistor is in the ON state:
x
x
00
0
1
RC
x
x
1
L
0
V
If the transistor is in the OFF state:
SEPIC converter parameters Value
Cyclic duty α
0,41
Cutting frequency 100KHz
Value of inductance (L1 et L2)
200μH
Output capacitor
1000μF
Coupling capacitor
47μF
Input voltage Vpv 35.2V
Output voltage Vout 24V
Power Ppv 250W
(11)
(12)
(13)
(14)
(15)
L
L
V
∆I
f
(8)
C
I
V
0.5
f
α
C
i
α
∆u
f
(9)
(10)
ICCSRE 2018 - International Conference of Computer Science and Renewable Energies
352
x
x
0
x
x
0
V
By application of the Laplace transform (Marie
Chantal, Niyomanzi Sebutimbiri, 2016), the transfer
function is written as:
Vs
Vpv
α
RC
1α
S
S
The values of Table 3 are obtained after sizing of our
converter where I determine the constants of the
model (17).
The value of the inductance is calculated as follows:
The value of the output capacitor is calculated as
follows:
Table 3: Dimensioning of the BOOST converter.
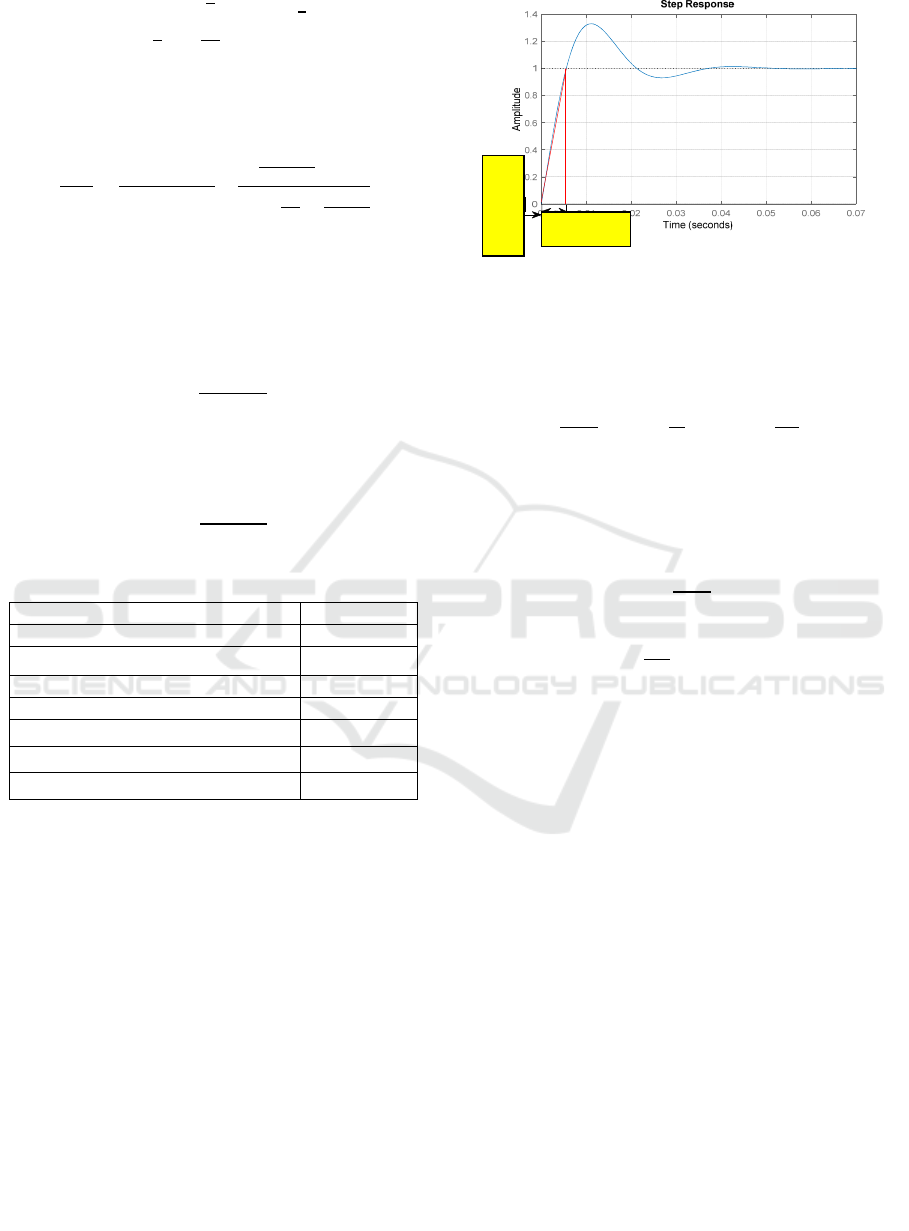
From the step response, the two constants namely
the delay time L = 0.0005s and the time constant T =
0.005s are obtained.
The following figure illustrates the open-loop
step response of the BOOST converter.
Figure 9: Open loop step response of the BOOST
converter
The transfer function of the PI controller is written in
general form:
Us
Es
k
k
s
k
1
1
T
s
Using the Ziegler and Nichols settings, we obtain the
values of our PI controller (Smitha K, 2012)
(Mitulkumar R, 2012):
K
0.9T
L
9
T
L
0.3
0.0016s
4 DIMENSIONING BATTERY
VOLTAGE
We recall that a battery consists of several
electrochemical conversion elements. Each element
is considered as a voltage generator of 2V. By
stacking these elements, one obtains batteries of 6V,
12V, 24V or 48V.
In order to determine the appropriate voltage of the
battery, it is appropriate to be placed in the most
unfavorable configuration, that is to say when the
batteries completely power the electrical equipment
(without any contribution of the photovoltaic field)
(S.S.Shinde,2016) (C. de Manuel, J. Cubas, and S.
Pindado,2014).
The mathematical formula for determining the
battery voltage is shown below:
BOOST converterparameters Value
Cyclic duty α
0,5
Cutting frequency 100KHz
Value of inductance L1
200μH
Output capacitor
47μF
Input voltage Vbat 24V
Output voltage Vs 48V
Charge R 10
(16)
(17)
(20)
(21)
(22)
(23)
L
αV
∆I
(18)
C
s
I
s
α
∆V
Cs
(19)
T=0.005s
L=0.0005s
Design and Control of an Autonomous Photovoltaic System with Battery Charge Regulateur using the MPPT Control Followed by PI
Correctors
353
V
ρ2LP
Sε
Avec:
ρ: resistivity of the conductive material
(copper or aluminum) under operating
temperature conditions, expressed in .mm²
/ m. We can consider that = 1.25 × 0
where 0 is the resistivity of the conductor
at 20 ° C.
L: Length of the cables connecting the
battery to the distribution board, expressed
in m. The factor 2 makes it possible to take
into account the distances to and from the
cable.
P: is the electrical power, expressed in W.
S: Cable cross-section between the battery
and thedistribution board, in mm².
ε: Voltage drop tolerated between the
battery and the distribution board.
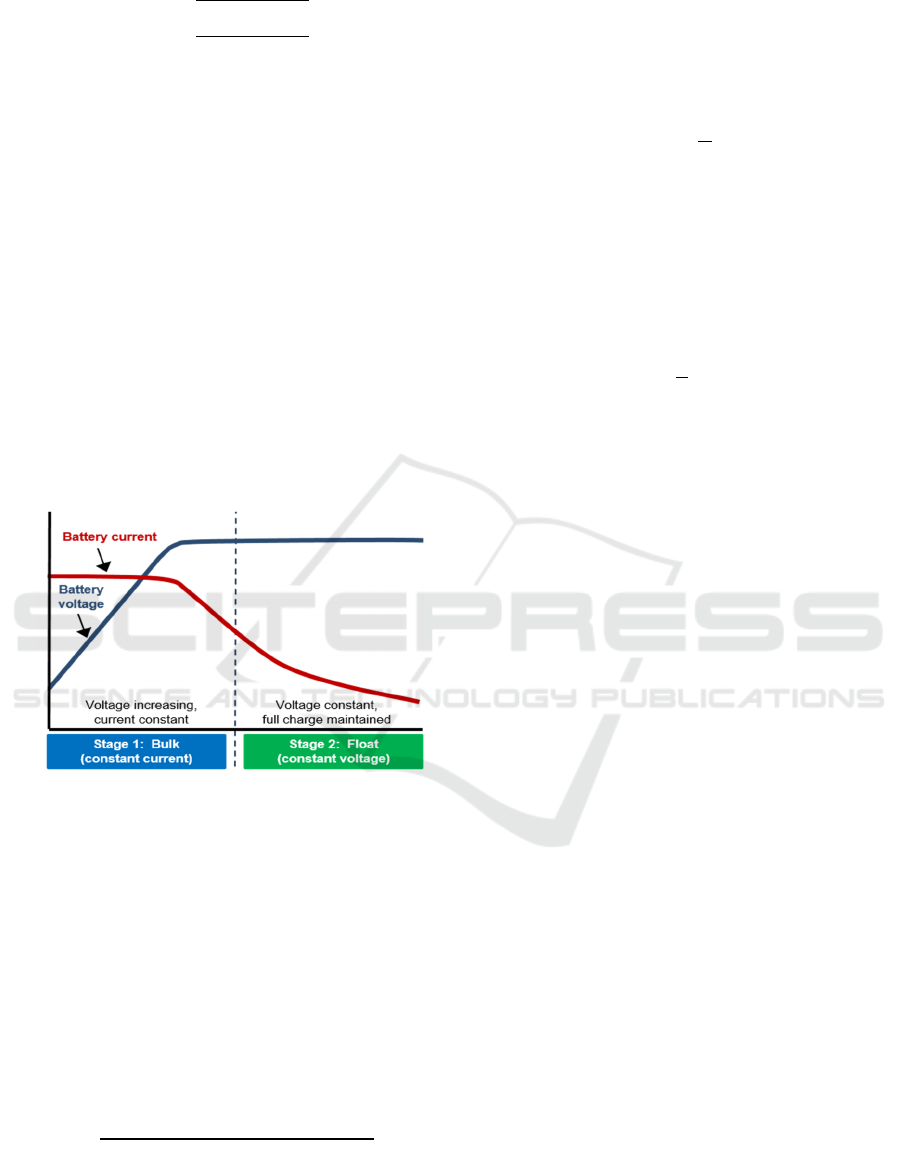
Figure 10: Battery charge profile
In our case we used a voltage battery:
V
24V
4.1 Calculation of the Nominal Capacity
of the Battery
The nominal capacity of the battery, noted CN (C10),
makes it possible to quantify the autonomy of the
battery vis-à-vis the electrical consumption of the
equipment.
C
AutonomieEnergiejournaliére
1α
With:
α
: Desired end state of charge
4.2 Determination of Charging Time
The charging time T is the time required for
recharging a battery can be estimated by calculation
T
Q
I
Q: the maximum electric charge of a battery
announced in amperes-hours (Ah)
I: The rated load current I
For our case we use a battery with an energy capacity
of 7 Ah with a nominal load of 1A so:
T
7
1
7h
5 MAXIMUM POWER
POINTTRACKING (MPPT)
The MPPT command, "Maximum Power Point
Tracking", is an essential control for optimal
operation of the photovoltaic system. The principle
of this control is based on the automatic variation of
the duty cycle by bringing it to the optimum value in
order to maximize the power delivered by the PV
panel. For this reason, we will present and study the
PandO algorithm (M.R. Sourov, U.T. Ahmed and
M.G. Rabbani, 2012) ( M. Azab, 2009).
5.1 Algorithm of the PandOCommand
The perturb and observecontrol (PandO) is used to
extract the maximum power of the PV generator
whatever the variation of the irradiation and the
temperature (D. S. Karanjkar, S. Chatterji, S. L.
Shimi, and A. Kumar, 2014).
(24)
(25)
(26)
(27)
ICCSRE 2018 - International Conference of Computer Science and Renewable Energies
354
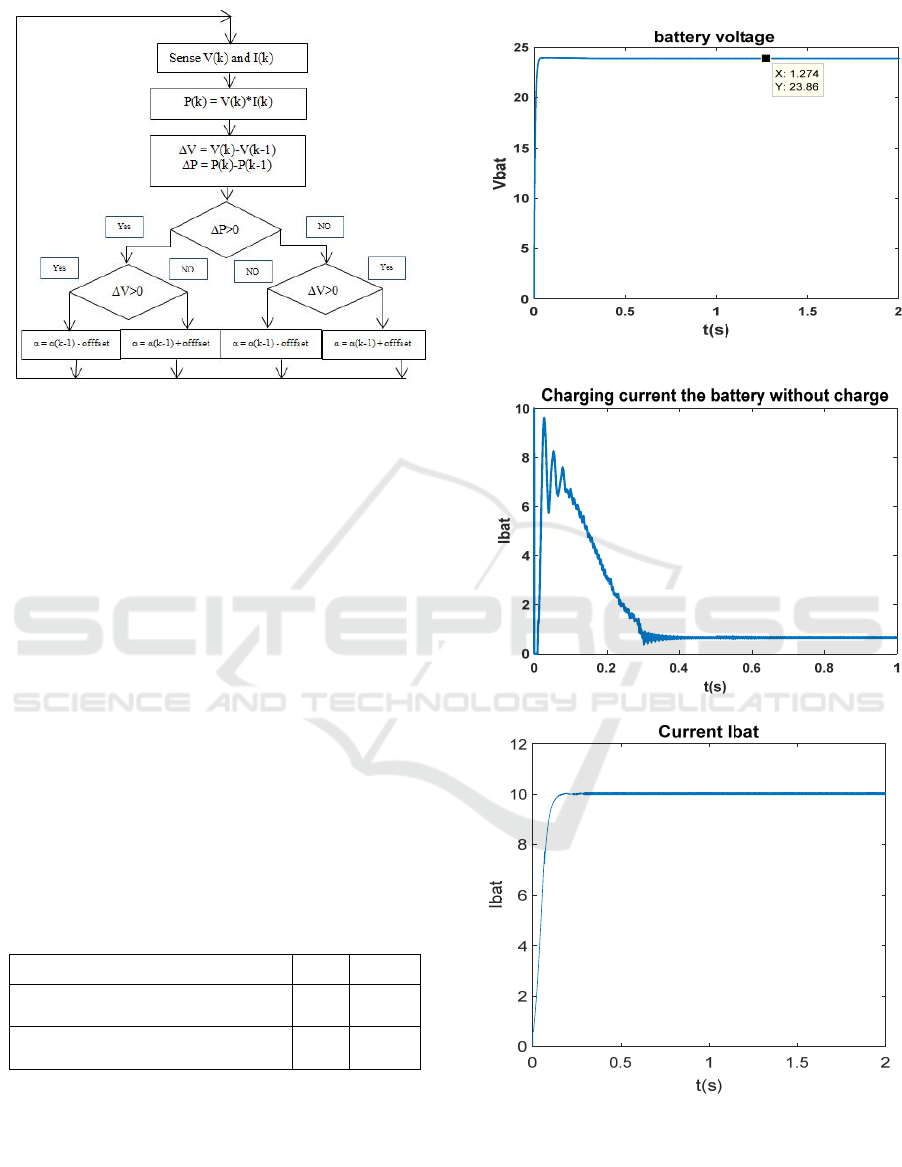
Figure 11:PandO algorithm
5.2 PI Controller
In this way the systems are intended to ensure
equality (or at least the smallest error) between the
set point and the output.
The controller P will reduce the rise time and reduce
the static error, without eliminating it completely. An
I controller will eliminate the static error, but can
make the transient response worse. The D controller
will increase the stability of a system,reduce
overshoot and can improve the transient response
(Mitulkumar R, 2012).
The goal of using the PI controllers is to monitor the
state of charge and discharge of the battery and to
adapt the output voltage of the battery to the load
(Smitha K, 2012).
And the parameters of the PI controllers used are
grouped in the table below:
Table 4: Table Ziegler and Nichols tuning.
Parameters of PI controller Kp Ti
Parameters of PI controller for
SEPIC converter
3.21 0.0023
Parameters of PI controller for
BOOST converter
9 0.0016
6 SIMULATION RESULTS
The simulation results presented in this section are
developed using Matlab/SIMULINK.The battery
voltage used has a nominal voltage of 24V. A
resistive load of 10 is used for the simulation.
Figure 12: The battery voltage
Figure 13: Charging current of the battery
Figure 14:Ibat current of the battery with charge
Design and Control of an Autonomous Photovoltaic System with Battery Charge Regulateur using the MPPT Control Followed by PI
Correctors
355
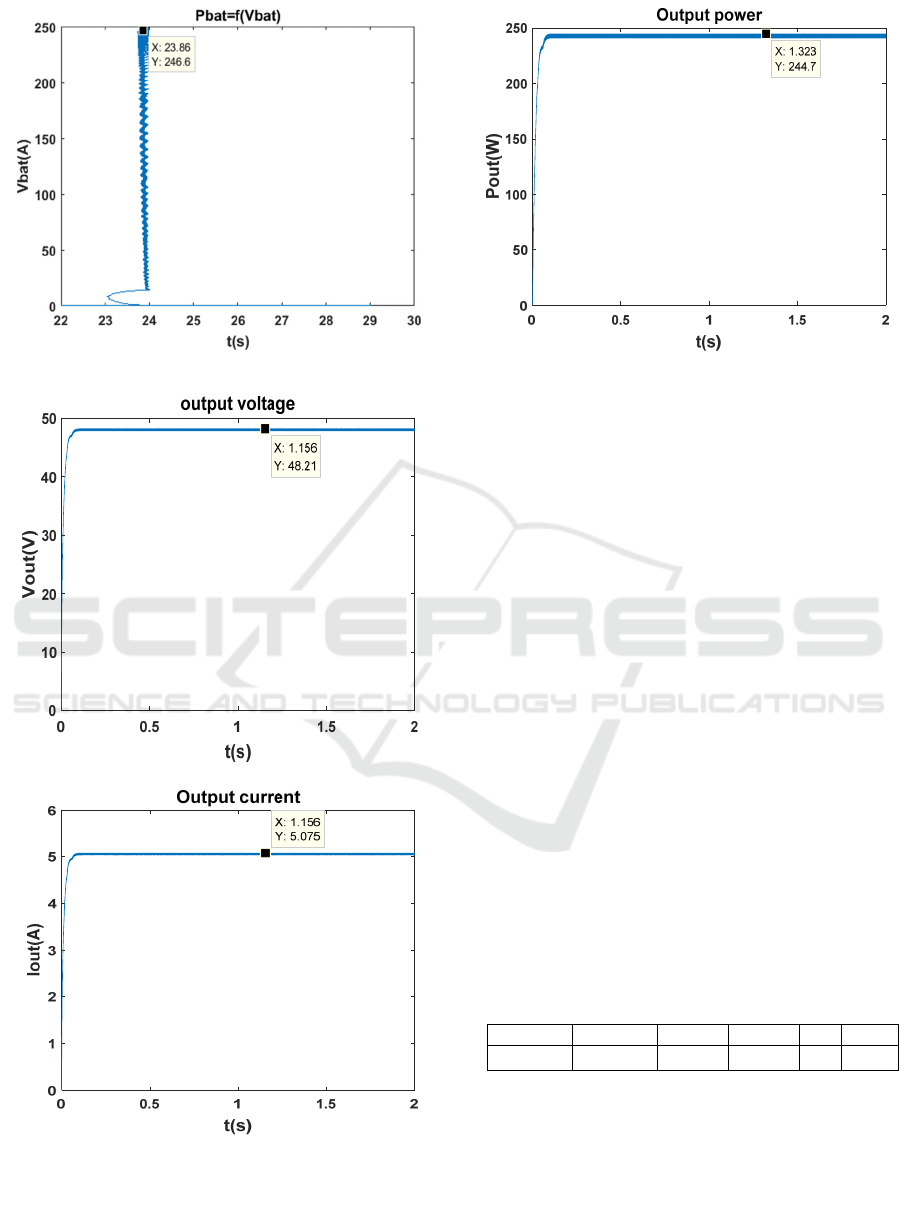
Figure 15: The power Pbat according to Vbat
Figure16: The output voltage of the PV system
Figure 17: Output current of the PV system
Figure 18: Output power of the PV system
7 DISCUSSION
The simulation results have shown that the charge-
discharge regulator of the battery has good regulating
capacity by the use of the SEPIC converter, the
voltage Vbat is of the order of 23.86 V with a
response time of 0.08 s and a ripple rate of 1%. The
current Ibat with charge is stabilized at 10, 34A that
is to say with a power of 246.7124 and a yield of
98.6%.
For the boost converter model “Figure 16” shows
the output voltage response of the BOOST converter
for an input voltage of 24 V with an output load of 10
. The controller PI stabilizes the output voltage Vs
compared with the reference voltage 48V. According
to the simulation, after 0.1s, the output voltage is
restored to its reference value with a ripple rate of
1% in the steady state. The efficiency of the
converter is of the order of 98%, that is to say an
output power of
244,7W for a load of 10.
The following table summarizes the main
specifications of the PV and previously studied
MPPT algorithms.
Table 5: PV performance based on luminal radiation
.
PV Ppvmax Icc Vco Ns Np
1kW/m² 250W 7.76A 43.2V 10 6
ICCSRE 2018 - International Conference of Computer Science and Renewable Energies
356

Table 6: Analysis the performance of PV system.
Parameters PV System Value
Maximum power extracted 244.7W
Voltage at the battery terminal Vbat(V) 24V
Output voltage Vout(V) 48,21V
Response time Vbat 0.1s
Response time Vs 0.1s
% of Overshoot Vs 1%
% of Overshoot Vbat 0%
Efficiency% 98%
Observation GOOD in
response and
power
transmitted
8 CONCLUSION
In this article we have described the main elements
of the autonomous PV system. Then, we
dimensioned the parameters of the PI correctors by
the use of the state space method to define the
transfer function of the following converters: SEPIC
and BOOST and after the use of the Ziegler and
Nichols method to define the values of Kp and Ki.
Finally, we finished with a simulation of the
autonomous PV system. The results of the
simulations show that the system has an efficiency
of 97% with a ripple rate of 1% and a response time
of 0.1s. The use of the SEPIC converter with the
MPPT command followed by the PI controllers
shows that the system has good regulation capacity,
the voltage Vbat is of the order of 23.86 V with a
response time of 0.08 s and a ripple rate of 1%. The
current Ibat is stabilized at 10, 34A that is to say the
power is of the order of 246.7124 and the efficiency
is equal to 98.6% .The BOOST converter is used to
adapt the output voltage of converter SEPIC At the
voltage demand by the load, the result shows that the
converter has good performance: an efficiency of the
order of 97% that is to say an output power of 242W
for a load of 10
REFERENCES
S. Gueye, 2014. ‘‘Conception d’un régulateur solaire avec
commande MPPT’’ Laboratoire d’Energies
Renouvelables, Ecole supérieure Polytechnique,
Université Cheikh AntaDiop de Dakar - BP 5085
(Dakar, Senegal) Vol. 1(2) ISSN 2312-8712.
B. Paranthagan, 2015. “Comparative Analysis of
Performance of the SEPIC Converter Using PID and
Fuzzy Logic Controllers for LED Lighting
Applications” International Journal of Emerging
Technology in Computer Science & Electronics
(IJETCSE) ISSN: 0976-1353 Volume 12 Issue 2.
S. J. Chiang,2009. “Modeling and Control of PV Charger
System With SEPIC Converter” ieee transactions on
industrial electronics, vol. 56, no. 11.
S.S.Shinde,2016. “Performance Analysis of Boost
Converter Using Fuzzy Logic and PID Controller”
IOSR Journal of Electrical and Electronics
Engineering (IOSR-JEEE) e-ISSN: 2278-1676,p-
ISSN: 2320-3331, Volume 11, Issue 3 Ver. I.
Smitha K, 2012. “Steady State Analysis of PID Controlled
Boost Converter using State Space Averaging
Technique” National Conference-NCPE-2k15,
organized by KLE Society's Dr. M. S. Sheshgiri
College of Engineering & Technology, Belagavi,
Special issue published by Multidisciplinary Journal of
Research in Engineering and Technology, Pg.100-110.
Mitulkumar R, 2012. “Analysis of Boost Converter Using
PI Control Algorithms” International Journal of
Engineering Trends and Technology- Volume 3 Issue
2.
M.R. Sourov, U.T. Ahmed and M.G. Rabbani,2012. ‘A
High Performance Maximum Power Point Tracker
for Photovoltaic Power System Using DC-DC
Boost Converter, IOSR Journal of Engineering, Vol.
2, N°12, pp. 12 – 20.
M. Azab,2009. ‘A New Maximum Power Point tracking
for Photovoltaic Systems’, International Journal of
Electrical and Electronics engineering, vol. 3, N°11.
D. S. Karanjkar, S. Chatterji, S. L. Shimi, and A. Kumar,
2014. “Real time simulation and analysis of maximum
power point tracking (MPPT) techniques for solar
photo-voltaic system,” in Proceed-ings of the Recent
Advances in Engineering and Computational Sciences
(RAECS ’14), pp. 1–6.
D. Zhou and C. Chen,2015. “Maximum power point
tracking strategy based on modified variable step-size
incremental conductance algorithm,” Power System
Technology, vol. 39, no. 6, pp. 1492–1498.
Marie Chantal, NiyomanziSebutimbiri, 2016. “Sur
Quelques Applications de la Transformation de
Laplace” International Journal of Innovation and
ScientificResearch ISSN 2351-8014 Vol. 21 No. 2, pp.
342-350.
C. de Manuel, J. Cubas, and S. Pindado,2014. “On the
simulation of the UPMSat-2 microsatellite power,” in
Proceedings of the European Space Power
Conference, pp. 1–7.
M.R. Sourov, U.T. Ahmed and M.G. Rabbani,2012. ‘A
High Performance Maximum Power Point Tracker
for Photovoltaic Power System Using DC-DC
Boost Converter, IOSR Journal of Engineering, Vol.
2, N°12, pp. 12 – 20.
Kureve,2017. “A Sepic Type Switched Mode Power
Supply System For Battery Charging In An Electric
Tricycle (Auto Rickshaw)” international journal of
scientific & technology research volume 6, issue 08.
Design and Control of an Autonomous Photovoltaic System with Battery Charge Regulateur using the MPPT Control Followed by PI
Correctors
357

Chun T. Rim, Gyu B. Joung, and Gyu H. Cho,1991."
Practical Switch Based State Space Modeling of DC
DC Converters with All Parasitics", IEEE Trans. on
power electronics, vol. 6 No. 4.
ICCSRE 2018 - International Conference of Computer Science and Renewable Energies
358
