
Ferranti Effects in Algerian Network Adrar, Simulation Model using
Matlab
Nassim Guernoudj
Department of Science and Technology, University of Batna2, Batna, Algeria
Keywords: Voltage setting, transmission line, mobile self, MATLAB, Ferranti effect, capacitive effect, Algerian
network.
Abstract: The work presented in this paper is conducted over the Ferranti effect (line capacitive effect). Ferranti
effects are well known in the field of power transmission over long distances at relatively low frequencies
(Ibrahim A et.al, 005). The voltage at the receiving end can become the twice of voltage at sending end
(usually in the case of very long transmission lines) (Walling J). It is potentially very destructive for
network equipment and especially for Insulators of lines and electric cables, so it is very necessary to seek a
solution to eliminate this effect in our network. To validate this study, we conducted several tests of
MATLAB simulations on the Algerian network _ADRAR and specifically electrical transmission lines (line
ADRAR_TIMIMOUNE 192Km and line ADRAR_IN SALAH 409Km) with and without mobile self,
knowing that This network is powered by a Gas Turbine plants of Adrar and In Salah, interconnected
through a 220Kv network spreading from In Salah to Timimoun via Aoulef and Adrar. Finally, this
simulation study refines the voltage setting in the grid. It highlights the advantage of using the mobile self
220Kv for stabilizing the voltage at the end of high voltage lines.
1 INTRODUCTION
There are many factors affecting temporary over
voltages that may be considered in insulation. The
ferranti effect is an phenomenon where the steady
voltage at the open end of an uncompensated
transmission line is always higher than the voltage at
the sending end. It occours as a result of the
capacitive charging current flowing through the
inductance of the line and resulting over voltage
increases according to the increase in line length
(
Hung Sok P et.al, 2006).
The Ferranti effect describes the strong
phenomenon that certain conditions on length of line
and frequency, a rise in voltage is found at an open
ended transmission line as source voltage is
relatively sinusoidal in nature. This effect of
phenomenon was discovered at the end of 19
th
century in the Great Britain during the ac based
distribution system. In the UK it was Sebastian
Sinai de Ferranti, who as an ardent defender of an ac
system which installed an ac system along with
intermediate levels of different voltage and remote
step-down transformers. Ferranti observed on one ac
transmission system an altered by his installers that
by increasing length of line i.e. by adding an extra
section of distribution line, the rise in voltage
various remote ends (
Walling J).
The objective of this work is to give a simple
idea on the Ferranti effect, which may cause rises in
voltages in the transmission lines especially in the
Algerian network (Adrar_network).
2 FERRANTI EFFECT
2.1 Definition
Ferranti effect is a phenomenon where the voltage at
the open end of a transmission line without
compensation is always greater than the voltage
delivered by the power plant, or the resulting voltage
increases with the increase of the length of line
(
Hung Sok P et.al, 2006).
2.2 Details
Ferranti effect is caused by the capacitive effect of
the line; power lines have a certain capacitance
relative to earth. A line capacitance can be
represented by a capacitor between the phase
Guernoudj, N.
Ferranti Effects in Algerian Network Adrar, Simulation Model using Matlab.
DOI: 10.5220/0009770602310237
In Proceedings of the 1st International Conference of Computer Science and Renewable Energies (ICCSRE 2018), pages 231-237
ISBN: 978-989-758-431-2
Copyright
c
2020 by SCITEPRESS – Science and Technology Publications, Lda. All rights reserved
231
conductor and earth, if the phase conductor is
connected to an alternating current source grounded,
the capacitive effect would result by the flow of a
reactive current in the line.
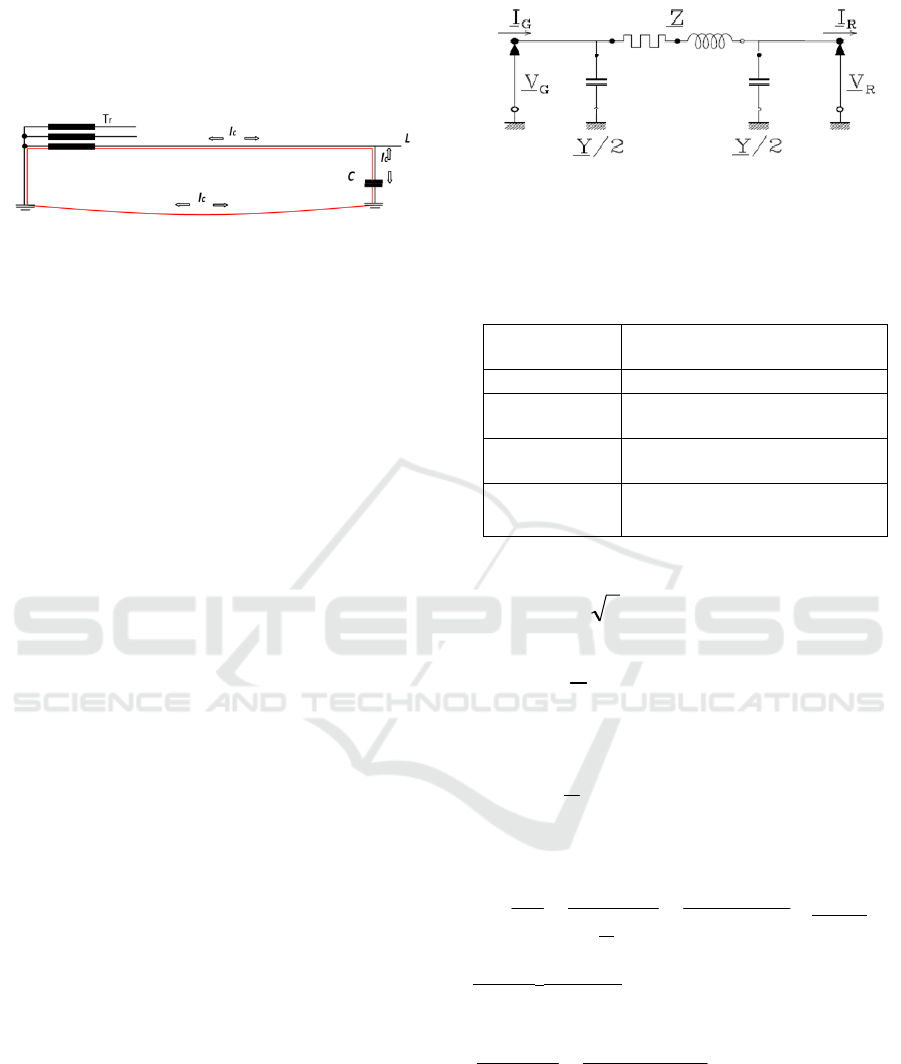
Figure 1: Cause of ferranti effect.
The value of the current Ic generated by the
capacitive effect is a function of the voltage with
respect to earth, that is to say the phase voltage
Uphof the line capacitance C and the frequency f of
the current source.
The formula to calculate the capacitive current is:
I
U
. 2. π. f. C(1)
C
π. ε. L
log
2D d
⁄
⁄
(2)
D: distance Phase / ground [m].
L: length of the line [m].
ε: Air permittivity [F / m].
d: diameter of the line in [mm].
C: capacity [Farad].
2.3 Really Exists a Ferranti Effect at
Algerian Network_ adrar?
Working with a model π, assuming that the voltage
at the _Fin end of the line is set to a value equal to
220Kv, So here we look for the voltage value at the
end of the Beginning line: If it is less than 220Kv
implies that there is an overvoltage caused by the
ferranti effect, else the network is perfect, or by
calculating the value directly at the final end of the
line: If it exceeds 220Kv implies that there is an
overvoltage caused by ferranti effect, Else the
network is perfect.
Take as an example the electrical transmission
line Adrar_Timimoune which has a length of 192
Kmand powered by V
G
= 220 Kv with a 50Hz
frequency.
Figiure 2: Quadrupole π of the electrical line.
Table 1: Calculation of quadrupole parameters π: (ABB S,
2009)
Line
parameters
QuadrupoleParameters
r=0.06[Ω/Km] R=r*L=0.06*192=11.52[Ω]
ℓ=0.60[mH/Km
]
X=X
L
*L=(2*pi*50*0.60e3)*192=j
36.17[Ω]
c=0.14[μF/Km] Y=Y
C
*L=(2*pi*50*0.14e‐6)*192=
j84.40e‐4[Ω]
L=192[Km] Z=R+jX=11.52+j36.17=37.96[Ω]
72.33°
The equations of quadrupole π are given by:
V
G
= A.V
R
+
3
.B.I
R
(Phase_Phase).
I
G
= C.V
R
+ D.I
R
(Neutral _Phase).
A = D = 1+
2
1
. Y.Z = 0.8474 + j0.0486 =
28.385.0
B = Z = 11.52+j36.17 Ω
C = Y.( 1+
4
1
.Y.Z) = -0.0002 + j0.0078 =
53.882e78.0
no load I
R
=0, V
G
= A.V
R
, I
G
= C.V
R
:
V
R
=
28.385.0
10220
Z.Y.
2
1
1
V
A
V
3
GG
= 258.82
Kv> (V
G
=220 Kv), So there is really a ferranti
effect in this network.
%voltage setting =
%99.14100*
82.258
82.258220
V
VV
R
RG
2.4 Simulation of Network Pole_ adrar
This part of the paper presents a study of the Ferranti
effect in the electric transmission line. MATLAB
gives rise to see the voltage at the end of the high
ICCSRE 2018 - International Conference of Computer Science and Renewable Energies
232
voltage line which is very long, which shows that
the voltage receiving end is greater than the voltage
sent by the power plant (
Ashfaq H, 2000). To show
the behavior of this network using the model in π as
shown in the figure below:
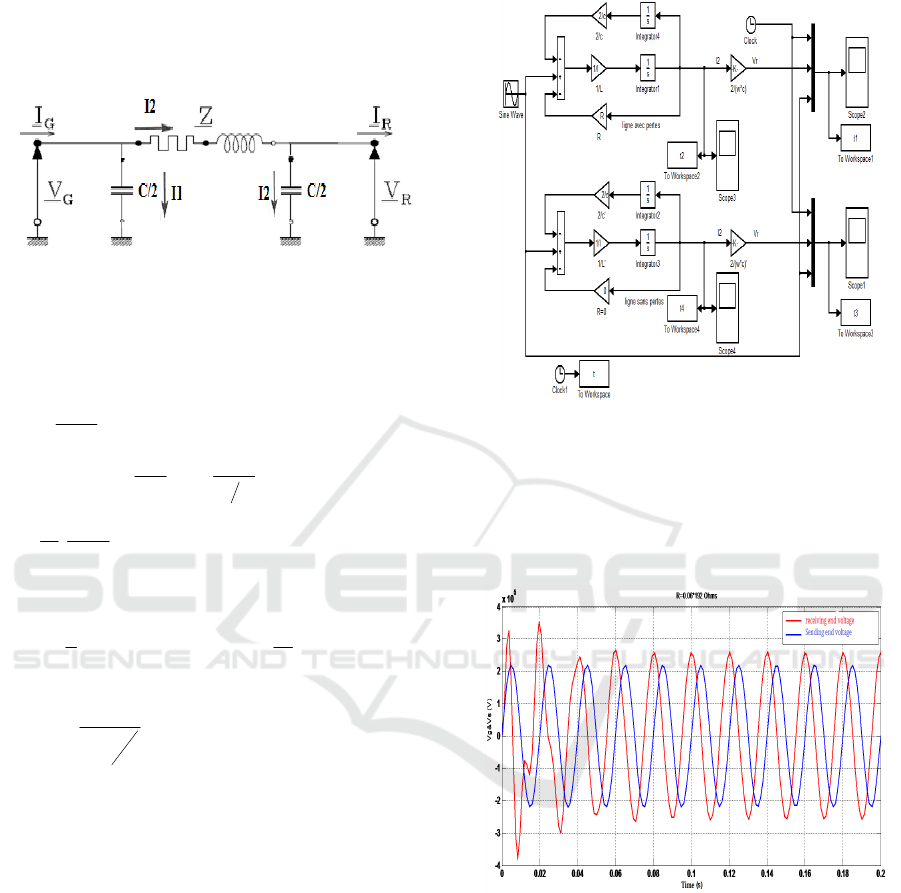
Figure 3: π model for the transmission line.
2.4.1 Electrical Equations
dti
2/C
1
V 1G
(3)
dti.
2C
1
dt
di
.li.RU
2
2
2
1
(4)
d
t
dV
.
2
C
i
G
1
(5)
We can also calculate the current valueI
2
using the
equation (4)as follows:
)dti
C
2
dtiRdtV.(
l
1
I 22G2
(6)
The voltage value at the end is:
2
C
1
.iV
2R
(7)
2.4.2 Calculation of Parameters
ω=2*π*f=2*π*50=314(rad/s).
R=6e-2*L. Resistance of the power line(Ω).
l=0.60e-3*L. Inductance of the power line(H).
C=0.14e-6*L. Capacity of the power line(F).
L=192 & 409 Km. Length of the power line(Km).
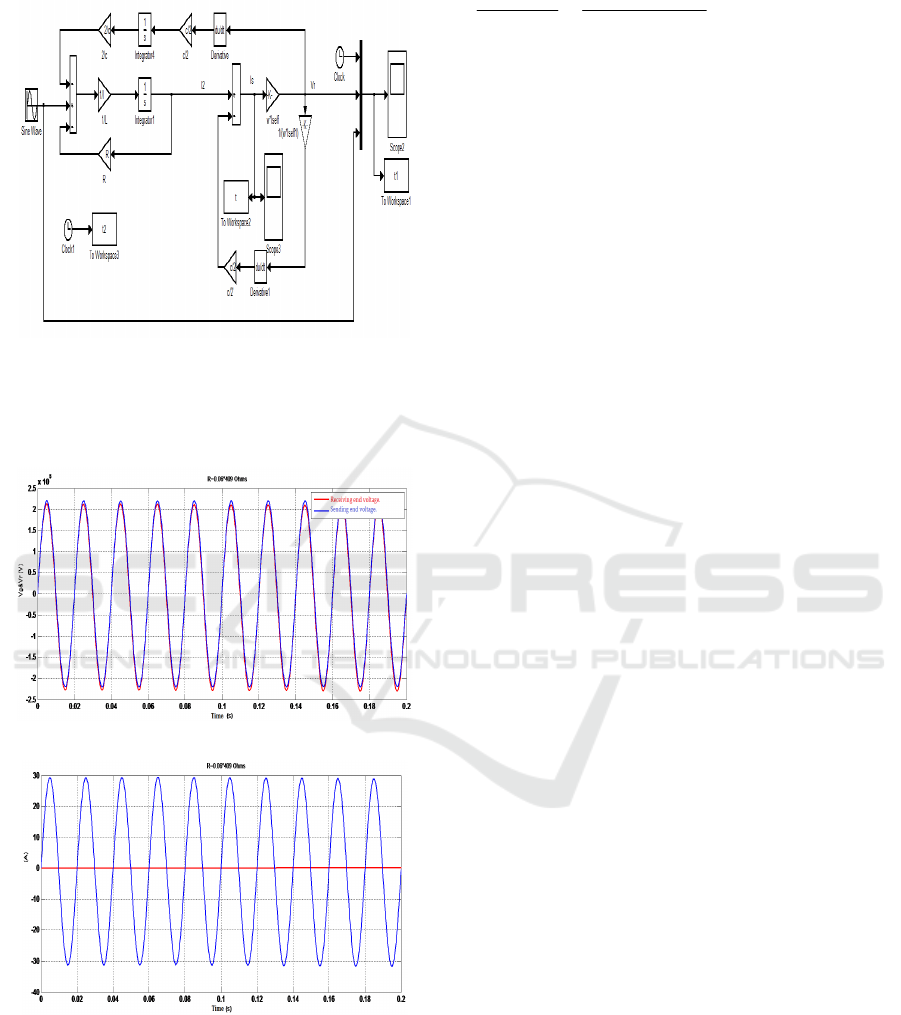
2.4.3 Construction of the Simulation Block
Figure 4: Simulation block with MATLAB, using
electrical equations.
2.4.4 Line ADRAR Timimoune 192 km
Figure 5_1: Sending end and receiving end voltage.
Ferranti Effects in Algerian Network Adrar, Simulation Model using Matlab
233
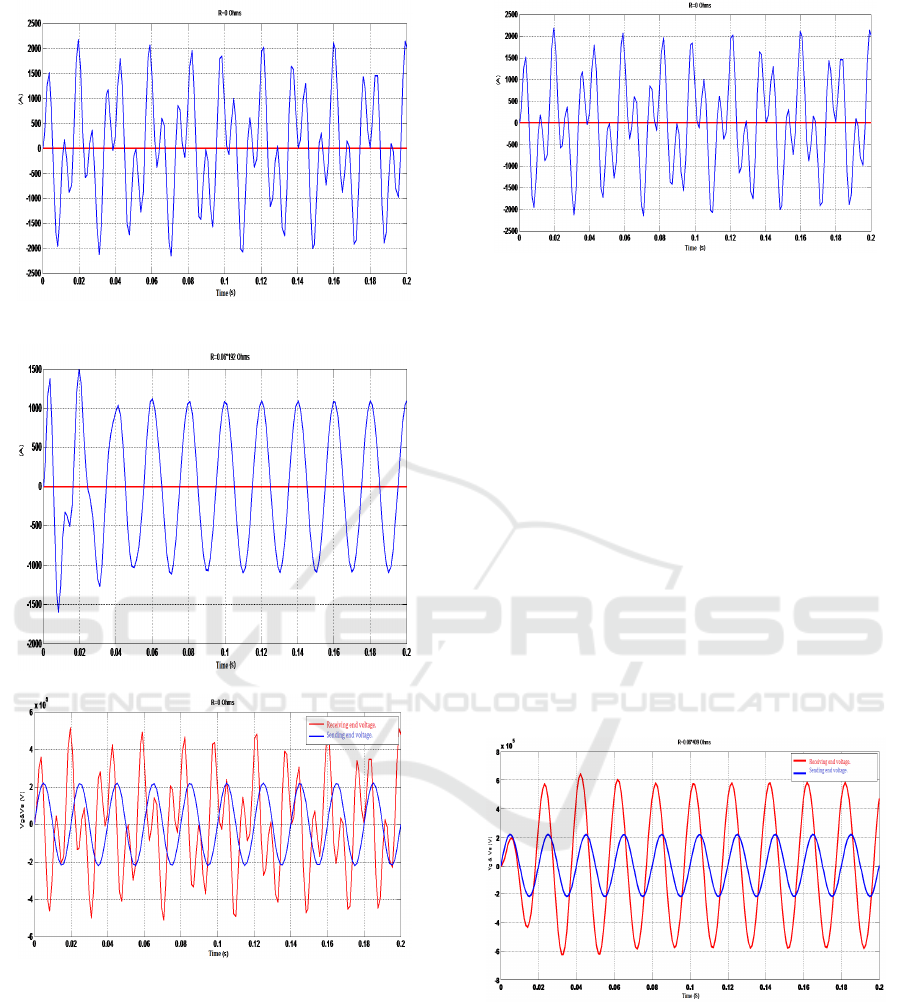
Figure 5_2: Receiving end current.
Figure 5_3: Receiving end current.
Figure 5_4: Sending end and receiving end voltage.
Figure 5_5: Receiving end current.
When a transmission line is unloaded, ferranti effect
causes an increase in voltage from sending end to
end of line (V
R
=258.8*10
3
for our network) as
indicated at (Fig.5_4).
Some disturbances are on the voltage and current
signals at the end of the line which can be up at
352.6*10
3
Volts and 1489 Ampsfor current, these
disturbances caused by the closing of the different
switches of the electrical network, both signals start
taking perfect forms after t=0.0312 Seconds.
The Ferranti effect is maximal at the end of the
transmission lines who have no losses Joule (R=0
Ohms) that is means no active power transported on
the line (Fig.5_4) et (Fig.5_5).
2.4.5 Line ADRAR Ain SALAH 409 km
Figure 6_1: Sending end and receiving end voltage of line.
ICCSRE 2018 - International Conference of Computer Science and Renewable Energies
234
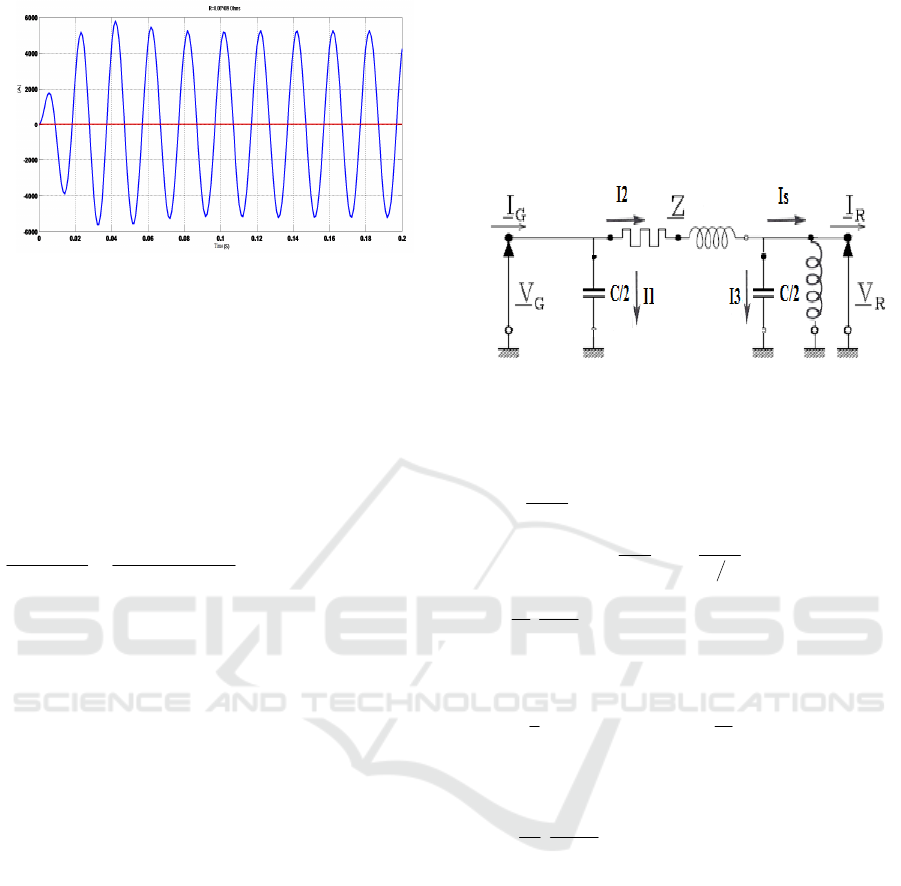
Figure 6_2: Sending end current.
The capacitive effect increases proportionally to the
length of the line. For this transmission line,
receiving voltage (V
R
=580.73*10
3
Volts) as
indicated (Fig.6.1) So the voltage rise value caused
by Ferranti effect ∆V=V
R
-V
G
=580.73*10
3
-
220.00*10
3
Volts=350.73*10
3
Volts, that is means
here we have a very dangerous surge, and the
voltage setting value:
%voltage setting=
%12.62100*
580.73
580.73220
V
VV
R
RG
When the network is not loaded, that is to say,
the impedance of the load is very high, the voltage
on the line tends to rise considerably, this voltage
increase is all the more important than the network
that is operated at high voltage and the lines are
long. To reduce voltage in the end of the line, we
must increase artificially the characteristic
impedance of the line or decreasing the effect of the
shunt capacity by installing self-span at the end of it.
2.5 Using the Mobile Self-span 20mvar
By specification using the shunt reactor for
compensating the effects of the capacity of the line,
in particular is to limit the rise in voltage at the
opening circuit or at light load. It is generally
necessary for airlines over than 200Km. Shorter
airlines may also require shunt reactors if the line is
powered from a low (short-circuit poor capacity)
(ABB S, 2009). When the extreme _End of the line
is open, the current flowing through the line will
cause a rise in voltage (V
G
) in sending end of line
thus the effect "Ferranti" will cause further tension
rising in receiving end (V
R
).
The shunt reactor of sufficient size must be
permanently connected to the line in order to limit
the fundamental frequency temporary overvoltage
approximately 1.5pu duration less than 1second.
These reactors also serve to limit the excitement of
the surge (transient switching) (ABB S, 2009).
Figure 7: π model of the transmission line connected to the
Self.
2.5.1 Electrical Equations
dti.
2/C
1
V 1G
(8)
dti.
2C
1
dt
di
.Li.RV
3
2
2G
(9)
d
t
dV
.
2
C
i
g
1
(10)
We can also calculate the current valueI
2
using the
equation(9) as follows:
)dti
C
2
dtiRdtV.(
l
1
I
32G2
(11)
With :
d
t
dV
.
2
C
i
R
3
(12)
The voltage value at the end is:
)l..(iV SELFSR
(13)
With :
32s iii
(14)
Ferranti Effects in Algerian Network Adrar, Simulation Model using Matlab
235
2.5.2 Construction of the Simulation Block
Figure 8: Simulation block with MATLAB, transmission
line connected to the Self. using electrical equations.
2.5.3 Application on the Line
ADRAR_INSALAH 409 km
Figure 9_1: Sending end and receiving end voltage of line.
Figure 9_2: Current of mobile Self span.
The capacitive effect is almost completely
eliminated on the transmission line (Fig.9.1). Or
receiving voltage (V
R
= 212.97 * 103 Volts) So the
voltage setting value this time will be very suitable:
%voltage-setting=
%30.3100*
212.97
212.97220
V
VV
R
RG
For a length of the line, more charge is more
important the voltage ultimately decreases (Some
capacitive loads or the voltage level rises with the
active power). For loads with a rear power factor
(inductive loads) which constitutes the vast majority
of loads the level of voltage decreases rapidly with
the call to active power. This is even true that the
power factor is low.
This study shows very well that the voltage control
at the end of line is very bad on uncompensated
lines. We also note that:
if the line is long, the control voltage at the
end of this line is bad.
if the load is not important on a network
with long transmission lines, it is necessary
to compensate to maintain the voltage at the
end of line to a value close to the rated
voltage.
3 CONCLUSION
The Ferranti effect is potentially very destructive to
the network equipment; it is more dangerous with
the introduction of 400Kv lines in particular in the
night hollow, especially as the insulation level of
equipment 400Kv is not far from the operating
voltage.
In the long transmission lines, the most important
factors affecting the increase in voltage during a
fault are the length of the line and the degree of
compensation parameters they have an indirect
influence on transients connected to the opening or
defect compensation, and the normal operations of
switching.
REFERENCES
Ibrahim A, Dommel (2005). A Knowledge Base for
Switching Surge Transients. Canada I. Conf. Pow.
Sys., IPSY05: 19-23-2005.
Walling J, The ferranti Effect in Data Grade Cables and
Channels. Canada. 56
th
I. Wire & Cable Symp., pp:
274-283.
Hung Sok P, Bong Hee L, Young Seon C, Sang Ok H
(2006). Calculation of Shunt Reactor Capacity in
400 Kv Power System Using EMTP. Korea I. Conf.
Elec. Eng., ICEE2006: 9-13-2006.
ICCSRE 2018 - International Conference of Computer Science and Renewable Energies
236

ABB S (2009). Basic on reactive compensation, Shielded
Heads line 220Kv., GRTE-PAT: 001-2009.
Ashfaq H (2000). Electrical Power Systems CBS
Publishers & Distributors. 4
th
Revised.,pp: 226-22.
ABB S (2009). Concept of reactive compensation and
principles techniques of operating self span 220Kv.,
GRTE-PAT: 001-2009.
ABB S (2009). Technicals and functionals characteristics
of the self span 220Kv., GRTE-PAT: 001-2009.
Ferranti Effects in Algerian Network Adrar, Simulation Model using Matlab
237
