
The Determinant Variables of Stock Prices in Jakarta Islamic Index
(JII) Stock Group
Suryo Budi Santoso and Herni Justiana Astuti
Magister Management, Universitas Muhammadiyah Purwokerto, Central Java, Indonesia
Keywords: Earnings per Share, Price Earnings Ratio, Dividend Pay-out Ratio, Interest Rate, Net Profit Margin, Stock
Prices
Abstract: The purpose of this study was to determine the effect of earnings per share (EPS), price earnings ratio
(PER), dividend pay-out ratio (DPR), interest rate (IR), and net profit margin on stock prices in the Jakarta
Islamic Index (JII) stock group. This study uses multiple regression analysis. The research data passed the
classic assumption test. The research model fulfills the Goodness of Fit criteria, with the variability of the
independent variable to the stock price of 76.3 percent. Based on multiple regression tests it was found that
EPS and DPR significantly influence on stock prices in the JII stock group, while the other factors have no
effect. Theory and previous research state that interest rates have a negative effect on stock prices. However,
this study found the opposite and not significant.
1 INTRODUCTION
Many factors influence stock prices on the stock
exchange. These factors can occur from internal
companies and external companies. External factors
are bank interest rates, inflation and oil prices.
Company performance, earnings per share, and
dividends are examples of causes from internal
companies (Kumar, 2017).
Up and down stock prices can indicate company
performance. If the stock price rises indicate good
company performance. Investors expect to be able to
get dividends, so they scramble to buy shares of
companies that are performing well. Conversely,
stock prices that tend to fall continuously indicate
that the company's performance is not good, such as
the example of BUMI's shares in Indonesia Stock
Exchange (Ariyanti and Sulasmiyati, 2016).
Smart investors analyse stocks before investing.
Fundamental analysis is an analysis of the
company's financial performance (Schlichting,
2013). Some of the company's financial performance
analysed in this study are earnings per share (EPS),
price earnings ratio (PER), dividend pay-out ratio
(DPR), and net profit margin (NPM).
Some previous researchers found that EPS has a
positive and significant effect on stock prices
(Ariyanti and Sulasmiyati, 2016); (Margareta and
Firzitya, 2015); (Kumar, 2017); (Bhattarai, 2014)
and (Viandita and Husaini, 2013). Previous
researchers on PER found that PER has a positive
and significant effect on stock prices (Suselo et al.,
2015); (Zuliarni, 2012) and (Viandita and Husaini,
2013). On the other hand, the negative influence of
the DPR on stock prices was found by several
researchers such as (Zuliarni, 2012) and (Hunjra et
al., 2014). The dividend pay-out ratio was tested in
mediating the relationship of debt to equity, total
asset turns over, and total assets to the stock price
not proven (Wijaya, 2017). Based on previous
research, inconsistencies in results between
researchers occurred. Therefore, this research is
important to do.
2 THEORICAL FRAMEWORK
2.1 The Previous Theory
The selection of stocks that are potentially profitable
for investors needs to use fundamental analysis.
Fundamental analysis based on company
Santoso, S. and Astuti, H.
The Determinant Variables of Stock Prices in Jakarta Islamic Index (JII) Stock Group.
DOI: 10.5220/0009511613011306
In Proceedings of the 1st Unimed International Conference on Economics Education and Social Science (UNICEES 2018), pages 1301-1306
ISBN: 978-989-758-432-9
Copyright
c
2020 by SCITEPRESS – Science and Technology Publications, Lda. All rights reserved
1301

performance. Source of fundamental analysis data
come from financial statements. A good company
will certainly be reflected in good financial
statements. Good financial reports show good
corporate performance. Good performance will
generate company profits that can also distribute
dividends to investors. The choice of a company that
performs well like this has the potential to produce
an attractive level of profit for investors (Budiman,
2018).
The Signalling Theory discovered by Spence in
1973 found that the equilibrium of several
companies to the market was different. Companies
can provide positive signals through good
performance from their financial statements, so the
market will respond well too. Conversely, poor
company performance will be responded to poorly
by the market (Spence, 1978). The good
performance of the company is usually called good
news by investors. This is because it will have a
positive effect on the company's stock price, and the
profits will usually be shared with shareholders in
the form of dividend distribution. Managers must
work well to produce optimal performance.
Managers, owners, and investors who have
"Contracting Relationships" examined by Jensen and
Mekling (1976) find a pattern of relations between
agents (managers) and principals (owners) known as
the Theory of the firm (Jensen and Meckling, 1976).
2.2 Measurement and Analysis of Financial
Performance
The company is successful if the company has
achieved a certain predetermined performance.
Financial performance measurement is carried out
simultaneously with the analysis process of financial
performance assessment critically, which includes a
review of financial data, calculation, measurement,
interpretation, and providing solutions to the
company's financial problems in a certain period
(Hery, 2016). One of the financial performance
analysis techniques is financial ratio analysis.
According to Hery, financial ratio analysis is an
analytical technique used to determine the
relationship between certain posts in the balance
sheet and profit loss.
The company conducts financial ratio analysis every
year, it can be studied the composition of changes
and can determine whether there is an increase or
decrease in the financial condition and performance
of the company during that time. Broadly speaking
there are five types of financial ratios (Hery, 2016).
namely liquidity ratios, solvability ratios, activity
ratios, profitability ratios, and valuation ratios or
market size ratios. One type of profitability ratio is
the ratio of operating performance. This ratio is used
to evaluate profit margins from sales operations
activities. This study uses a net profit margin ratio in
measuring operating performance. Whereas the
valuation ratio uses earnings per share, price
earnings ratio, and dividend payout ratio.
2.3 Stock Prices
Stock prices can be influenced by the strength of
demand and supply on the stock market. Stock
prices can be influenced by the strength of demand
and supply on the stock market. In addition, stock
prices are also influenced by many factors. Some
previous researchers have found many antecedents
that influence stock prices. When viewed outline,
these factors are divided into internal and external
factors of the company. Internal factors are much
influenced by the company's financial performance,
while external factors are influenced by the macro
conditions of a country.
2.4 Earnings per Share (EPS)
EPS is a ratio to measure the success of a company's
management in providing benefits to ordinary
shareholders. This ratio shows the relationship
between the amount of net income and the share
ownership in the investee company (Hery, 2016).
Previous research has found that earnings per share
had an effect on the closing price of the price of
stock companies (Margaretha, 2015). The higher
EPS will attract investors' attention in investing,
because high EPS is one indicator of the success of
a company, so that more investors who are
interested in buying shares will have an impact on
rising stock prices (Fahmi, 2012).
Based on forgoing, the following hypothesis was
proposed:
H1: Earning per Share and Stock Prices are
significantly positively influenced.
2.5 Price Earnings Ratio (PER)
PER is a ratio that shows the results of a comparison
between market prices per share with earnings per
share. In other words, the stock price of an issuer is
compared to the net profit generated by the issuer in
one year (Hery, 2016). Information on the amount of
PER, this tells whether the stock price of a company
is quite valued, undervalued, or too high and this can
have an impact on stock prices (Kumar, 2017).
Based on forgoing, the following hypothesis was
proposed:
H2: Price Earnings Ratio and Stock Prices are
significantly negatively influenced.
UNICEES 2018 - Unimed International Conference on Economics Education and Social Science
1302

2.6 Dividend Payout Ratio (DPR)
DPR is a ratio that shows the results of a
comparison between cash dividends per share with
earnings per share. This ratio describes the amount
of profit from each share allocated in the form of
dividends (Hery, 2016). Memon et al found that
DPR had significant impact on stock prices (Memon
et al., 2017).
Based on forgoing, the following hypothesis was
proposed:
H3:
Dividend Payout Ratio and Stock Prices are
significantly positively influenced
2.7 Interst Rate
Rakhimsyah and Gunawan found that interest rates
did not affect stock prices (Rakhimsyah and
Gunawan, 2011). (Subing and Kusumah, 2018);
(Purnamawati and Werastuti, 2013) found that
interest rate did not impact the stock price of the
company.
Based on forgoing, the following hypothesis was
proposed:
H4:
Interst Rate and Stock Prices are not influenced
2.8 Net Profit Margin (NPM)
(Roesminiyati et al., 2018) found that NPM have a
positive significant effect on stock price in
automotive sector in Indonesia Stock Exchange.
(Dita and Saifi, 2017) also found that NPM have a
positive significant effect on stock price in
companies at Utility, Infrastructure, and
Transportation sector.
Based on forgoing, the following hypothesis was
proposed:
H5:
Dividend Payout Ratio and Stock Prices are
significantly positively influenced
3 RESEARCH METHOD
3.1 Population and Sample
Population is the whole element that you want to
predict its characteristics. Not all elements or
subjects to be examined can be observed properly,
this is because of limitations, therefore a study needs
to be taken from the population sampling. While the
sample is part of the population to be tested for its
characteristics (Suliyanto, 2018). The population
used in this study is as many as 30 companies whose
shares have been included in the Jakarta Islamic
Index for the 2014-2017 period. Samples taken from
the population using a non-probability sampling
technique with a purposive sampling approach. This
approach is a method of selecting samples based on
certain criteria (Suliyanto, 2018). The criteria that
form the basis of sample selection are:
1. Companies listed in the Jakarta Islamic Index
on the Indonesia Stock Exchange,
2. Shares traded during the 2014-2017
observation period for the most active
companies.
3. Data needed is available on the website
www.idx.co.id.
Based on the criteria specified above, a sample
of 17 companies was obtained for the 2014-2017
observation period, then 10 (ten) large capitalized
companies were taken.
3.2 The Data Analysis Method
3.2.1 Regression Analysis
This study uses a multiple regression analysis
method. The regression equation used in this study
is:
Y = α +
β
1
x
1
+
β
2
x
2
+
β
3
x
3
+ β
4
x
4
+
β
5
x
5
+ ε
Remaks:
Y = Stock Price
α
= intercept/Constanta
β
1,
β
2,
β
3,
β
4,
β
5
= partial regression coefficients of
the dependent variable
x
1
= Earnings per Share (EPS)
x
2
= Price Earnings Ratio (PER)
x
3
= Dividend Payout Ratio (DER)
x
4
= Interst Rate
x
5
= Net Profit Margin (NPM)
ε = error for the i-observation
3.2.2 Classic Assumption Test
Multiple linear regression models can be called a
good model if the model meets the classical
assumptions (Sujarweni, 2016). The classic
assumption test used are (Ghozali, 2016):
1. Normality test aims to test whether in the
regression model of the confounding or residual
variables have a normal distribution.
2. Multicollinearity test aims to test whether in the
regression model used there is a correlation
between independent variables.
3. Heteroscedasticity test aims to test whether in
the regression model variance from residual
inequality occurs one observation to another
observation.
4. Autocorrelation test aims to test whether in the
linear regression model there is a correlation
between the confounding errors in period t with
the interfering error in period t-1 (before).
The Determinant Variables of Stock Prices in Jakarta Islamic Index (JII) Stock Group
1303
3.2.3 Goodness of Fit
1) Coefficient of Determination
This test aims to measure how far the model's
ability to explain the variation of the
dependent variable. The small value of R
2
means that the ability of independent
variables to explain the dependent variable is
very limited. Conversely, if the value of R
2
is
close to one, it means that the independent
variables provide almost all the information
needed to predict the dependent variable
.
2) Simultaneous Significance Test (F Test)
The F statistical test basically shows whether all
the independent or free variables included in the
model have a joint effect on the dependent
variable.
H0: b1 = b2 = ... = bk = 0, meaning whether all
independent variables are not significant
explanations of the dependent variable.
HA: b1 ≠ b2 ≠ ... ≠ bk ≠ 0, meaning that all
independent variables simultaneously are
significant explanations of the dependent
variable.
d. Significant Individual Parameter Test (t Test)
The t statistical test basically shows how far the
influence of one independent variable /
explanatory individually in explaining the
variation of the dependent variable.
H0: bi = 0, meaning whether an independent
variable is not a significant explanation of the
dependent variable.
HA: bi ≠ 0, meaning that the variable is a
significant explanation of the dependent
variable.
4 ANALYSIS AND RESULTS
Based on the results of the classic assumption test,
the following results are obtained:
1. One-Sample Kolmogorov-Smirnov Test
Normality Test obtained the Sig. (2-tailed) of
0.200 > 0.05. This means that standardized
residual values are declared to spread normally.
2. The results of the calculation of Tolerance value
indicate that there is no independent variable
that has a Tolerance value of less than 0.10 and
the value of Variance Inflation Factor (VIF) has
a VIF value of more than 10. So, it can be
concluded that there is no multicollinearity
between independent variables in the regression
model.
3. Based on the Heteroscedasticity test with the
Glejser method it is known that the regression
model does not occur symptoms of
heteroscedasticity. This is because of the Sig.
independent variables on residual absolute >
0.05.
4. Autocorrelation test results using the Durbin
Watson method, obtained a DW value of 2.073
Because the DW value is 2.073 located between
dU and 4-dU, it can be concluded that the
regression equation model does not contain
autocorrelation problems.
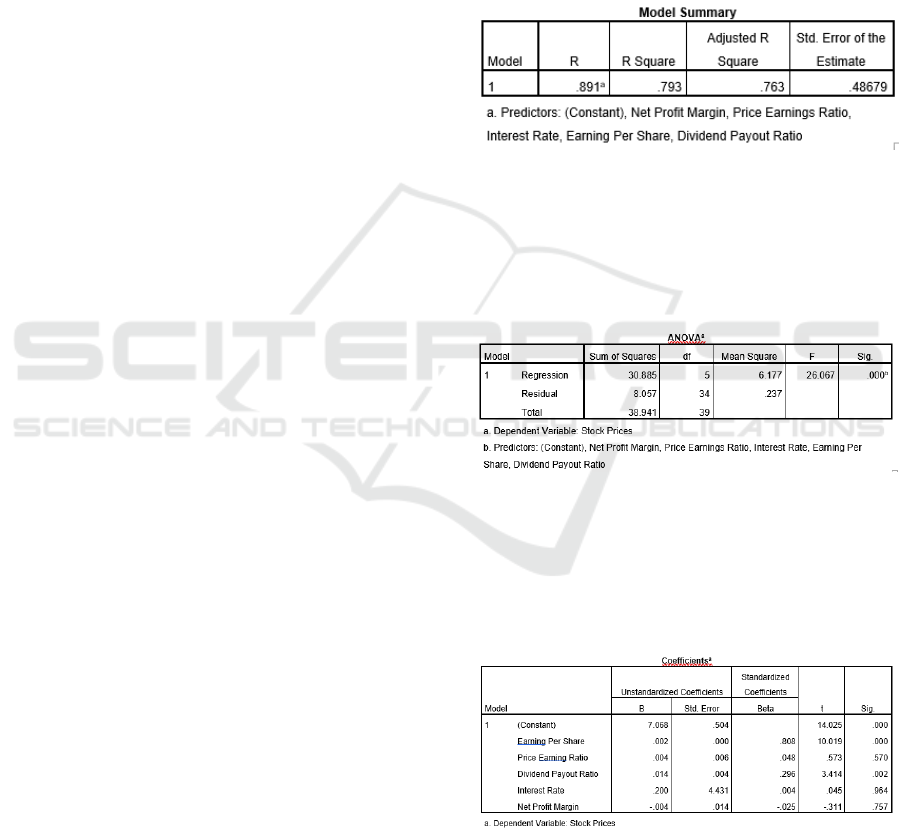
Table 1: Determination Coefficient Results
Based on Table 1 we see the Adjusted R-Squere
value is 0.763. This means that 76.3% of the stock
price variable can be explained by variations in the
five independent variables, namely EPS, PER, DPR,
interest rates and NPM. While the remaining 23.7%
is explained by other reasons outside the model.
Table 2: F Test Results
Based on the ANOVA test results in Table 2, the
calculated F value is 26.067 with a significance
value of <0.05, then the regression model can be
used to predict that EPS, PER, DPR, interest rates
and NPM. together influence stock prices.
Table 3: The Results of t Test
In Table 3, it can be seen that of the five
independent variables, the EPS and DPR variables
show a sig value of < 0.05, it can be concluded that
EPS and DPR variables have a significant effect on
stock prices. While the significantly of PER, Interest
Rate, and NPM variables are > 0.05, it can be
UNICEES 2018 - Unimed International Conference on Economics Education and Social Science
1304

concluded that the effect of the PER, Interest Rate,
and NPM variables on the Stock Price is not
significant.
Based on the table above the multiple linear
regression equation is made as follows
Y= 7.068 + 0.002X
1
+ 0,004X
2
+ 0.014X
3
+ 0.200X
4
– 0.004X
5
+ ε
5 DISCUSSION
1. The results of this study are specifically about
EPS and DPR variables. This study found that
the two variables had a significant positive
effect on stock prices. This is in line with the
findings from (Ariyanti and Sulasmiyati, 2016);
(Margareta and Firzitya, 2015); (Bhattarai,
2014); (Wijaya, 2017); and (Viandita and
Husaini, 2013). This is also support with the
previous theory about signalling theory. If EPS
and DPR is a good performance than previous
year (good news) the investor will buy this
stock. This activity makes the demand of buyer
increase and the consequence is the price of
stock will also increase. This increase in stock
prices is due to a signal of good corporate
performance (good news).
2. PER, Interest Rate, and NPM theoretically
influence stock prices. In this study it was found
instead. PER, Interest Rate and NPM have no
effect. PER is the price ratio compared to
earnings. This means that the greater the PER of
a stock means the share price is getting more
expensive. This is useful to compare the price
level of the stock is expensive or cheap.
3. Interest Rate has a negative effect on stock
prices. The findings in this study are just the
opposite that Interest Rate has no effect. The
rising Interest Rate will have an impact on the
increase in operating costs for the company.
The company's operating costs rise, it will
reduce the company's profits. Then the effect of
the IR increase on the stock price will turn
around or reduce the stock price. This can be
attributed to the research area are stocks in
sharia groups, especially in the JII group
(Jakarta Islamic Index). The criteria for stocks
that are categorized as sharia include not
developing their business with interest, because
interest declared by the Indonesian Ulema
Council is prohibited.
4. NPM affects stock prices. The higher the NPM
value, the stock price will also increase. This is
related to the company's performance as seen
from the numbers at NPM. The company's
profit rises high, so investors will scramble to
hunt for shares because of the high performance
and profit potential that can be obtained through
dividends or price changes due to the very high
demand from investors for this stock. This
research shows the opposite direction. The
negative NPM relationship with stock prices,
although not significant. This finding needs to
be reviewed for the next study considering the
relationship opposite to stock prices.
CONCLUSIONS
The test results with multiple linear regression
analysis can be concluded as follows:
1. EPS and DPR variables had a significant
positive effect on stock prices.
2. PER, Interest Rate and NPM have no effect on
stock prices.
Limitation of this research
This research used five variables such as EPS, DRP,
PER, Interest Rate and NPM. The other variables
are potential to do the research for examples Return
on Asset (ROA), Return on Equity, and inflation.
REFERENCES
Ariyanti, S. & Sulasmiyati, S. (2016). The Effect Of
Profitability and Leverage On Stock Prices (Study of
Construction and Building Companies Listed on the
Indonesia Stock Exchange Period 2011-2014). Jurnal
Administrasi Bisnis, 35, 181-188.
Bhattarai, Y. R. (2014). Determinants of share price of
Nepalese commercial banks. Economic Journal of
Development Issues, 17, 187-198.
Budiman, R. (2018). Rahasia Analisis Fundamental
Saham, Elex media komputindo.
Dita, N. C. & Saifi, M. (2017). Pengaruh Economic Value
Added (Eva), Net Profit Margin (Npm), Return on
Equity (Roe), Dan Return on Investment (Roi)
Terhadap Harga Saham (Studi Pada Perusahaan Jasa
Sektor Infrastruktur, Utilitas, Dan Transportasi Yang
Terdaftar Di Bei Tahun 2013-2015). Jurnal
Administrasi Bisnis, 46, 140-146.
Fahmi, I. (2012). Teori Portofolio dan Analisis Investasi,
Bandung, Alfabeta.
Ghozali, I. (2016). Aplikasi Analisis Multivariete dengan
Program IBM SPSS 23, Semarang, Badan Penerbit
Universitas Diponegoro.
Hery (2016). Finacial Ratio for Business: Analisis
Keuangan untuk Menilai Kondisi Finansial dan
Kinerja Perusahaan, Jakarta, Grasindo.
The Determinant Variables of Stock Prices in Jakarta Islamic Index (JII) Stock Group
1305

Hunjra, A. I., Ijaz, M. S., Chani, M. I. & Mustafa, U.(
2014). Impact of Dividend Policy, Earning per Share,
Return on Equity, Profit after Tax on Stock Prices.
Jensen, M. C. & Meckling, W. H. (1976). Theory of the
firm: Managerial behavior, agency costs and
ownership structure. Journal of financial economics,
3, 305-360.
Kumar, P. (2017). Impact of Earning Per Share and Price
Earnings Ratio on Market Price of Share: A Study on
Auto Sector in India. International Journal of
Research - GRANTHAALAYAH 5, 113-118.
Margareta, F. & Firzitya (2015). The Effect of Cash
Dividend, Retained Earnings, and Stock Price of
Manufacturing Company Listed In Indonesia Stock
Exchange. . Journal The Winner 16, 36-43.
Margaretha, F. (2015). The Effect of Cash Dividend,
Retained Earnings, and Stock Price of Manufacturing
Company Listed In Indonesia Stock Exchange. The
Winners, 16, 36-43.
Memon, N. A., Channa, N. & Khoso, I. (2017). Impact of
Dividend Policy on Market Prices of Shares: Evidence
from Pakistan. Journal of Business Strategies, 11, 57-
72.
Purnamawati, I. G. A. & Werastuti, D. N. S. (2013).
Faktor Fundamental Ekonomi Makro Terhadap Harga
Saham LQ45. Jurnal Keuangan dan Perbankan, 17,
211? 219.
Rakhimsyah, L. A. & Gunawan, B. (2011). Pengaruh
Keputusan Investasi, Keputusan Pendanaan, Kebijakan
Dividen dan Tingkat Suku Bunga Terhadap Nilai
Perusahaan. InFestasi, 7, 31-45.
Roesminiyati, R., Salim, A. & Paramita, R. W. D. (2018).
Pengaruh Earning Per Share (EPS), Return On Equity
(ROE), dan Net Profit Margin (NPM) Terhadap Harga
Saham Pada Perusahaan Otomotif yangTerdaftar Di
Bursa Efek Indonesia. Proceedings Progress
Conference, 2018. 861-869.
Schlichting, T.( 2013). Fundamental Analysis, Behavioral
Finance and Technical Analysis on the Stock Market. .
GRIN Verlag.
Spence, M. (1978). Job market signaling. Uncertainty in
Economics. Elsevier.
Subing, H. J. T. & Kusumah, R. W. R. (2018). An
Empirical Analysis of Internal and External Factors of
Stock Pricing: Evidence from Indonesia. Management
(open-access), 15, 178-187.
Sujarweni, V. W. (2016). Kupas Tuntas Penelitian
Akuntansi dengan SPSS, Yogyakarta, Pustaka Baru
Press.
Suliyanto (2018). Metode Penelitian Bisnis, Yogyakarta,
Andi Offset.
Suselo, D., Djazuli, A. & Indrawati, N. K. (2015).
Pengaruh Variabel Fundamental dan Makro Ekonomi
terhadap Harga Saham (Studi pada Perusahaan yang
Masuk dalam Indeks LQ45). Jurnal Aplikasi
Manajemen, 13, 104-116.
Viandita, T. O. & Husaini, A. (2013). Pengaruh Debt
Ratio (Dr), Price to Earning Ratio (Per), Earning Per
Share (Eps), Dan Size Terhadap Harga Saham (Studi
Pada Perusahaan Industri Yang Terdaftar Di Bursa
Efek Indonesia). Jurnal Administrasi Bisnis, 1, 113-
121.
Wijaya, R. (2017). Kinerja keuangan dan ukuran
perusahaan terhadap harga saham dengan kebijakan
dividen sebagai variabel intervening. Jurnal Keuangan
dan Perbankan, 21.
Zuliarni, S. (2012). Pengaruh Kinerja Keuangan Terhadap
Harga Saham Pada Perusahaan Mining and Mining
Service yang Terdaftar di Bursa Efek Indonesia
Periode 2008-2010. Jurnal Aplikasi Bisnis, 3.
UNICEES 2018 - Unimed International Conference on Economics Education and Social Science
1306
