
The Effect of Regional Government Expenditure on Economic
Growth: Case Study of Sumatera Island - Dynamic Panel Approach
Agus Tri Basuki
1
, Yunastiti Purwaningsih
2
, A. M. Soesilo
2
and Mulyanto
2
1
Economy Faculty and Business Universitas Muhammadiyah Yogyakarta
2
Economy Faculty and Business Universitas Sebelas Maret Surakarta-Indonesia.
Keywords: Government Expenditure, Economic Growth, General Allocation Funds, Fiscal Policy
Abstract: The purpose of this study is to see the effect of fiscal variables that affect the economic growth of several
provinces in Sumatra. The model used in seeing the effect of government spending on GRDP growth is the
dynamic panel model. Based on data from 7 provinces of 10 provinces on the island of Sumatra and using
data from 2008 to 2017, in the short term BPK's opinion on regional financial statements has a negative
relationship, meaning that if opinion is good or there are no findings of poor performance on regional
financial statements it will reduce economic growth. In the long run, few case findings in financial reporting
will encourage economic growth. Local government spending on education both in the long term and in the
short term affects economic growth. While spending on health, maritime and agriculture in the short term
has not been able to encourage economic growth. Whereas in the long run, health and marine expenditures
encourage economic growth. While general allocation funds in the short term affect economic growth, but
in the long run it does not affect economic growth.
1 INTRODUCTION
Economic growth is one indicator in looking at a
country's economic development. Although
economic growth has limitations, until now
economic growth is still very important because: (1)
growth does not always reduce poverty, but without
economic growth it is very difficult to make
meaningful and sustainable reductions in poverty,
especially in developing the economy; (2) economic
growth is always measured by increasing output,
with increasing output expected to increase
employment, so that with the growth of the economy
of an area it is expected to reduce unemployment;
(3) the economic recession that occurs in many
countries has caused a significant increase in the
budget deficit, so that economic growth is one of the
important alternatives to overcome the government
budget deficit; (4) economic growth enables
increased resources for public services such as
education and health, so that economic growth
enables increased social spending without increasing
tax rates (Todaro, 1999).
Figure 1: Sumatra Island by Province
Sumatra Island is one of the islands in Indonesia
which is located in the west, Sumatra Island has 10
provinces out of 34 provinces in Indonesia. The
figure 1 describes the location of 10 provinces on the
island of Sumatra. Of the 10 provinces in Indonesia
7 provinces were used as samples of research from
650
Basuki, A., Purwaningsih, Y., Soesilo, A. and Mulyanto, .
The Effect of Regional Government Expenditure on Economic Growth: Case Study of Sumatera Island - Dynamic Panel Approach.
DOI: 10.5220/0009511106500657
In Proceedings of the 1st Unimed International Conference on Economics Education and Social Science (UNICEES 2018), pages 650-657
ISBN: 978-989-758-432-9
Copyright
c
2020 by SCITEPRESS – Science and Technology Publications, Lda. All rights reserved
2008 to 2017. The reasons for using 7 provinces in
Sumatra Island were because they had complete
data.
Source : Central Bureau of Statistics (Province in
Figures 2008-2018)
Figure 2: Gross Regional Domestic Product in Some
Province in Sumatra Island
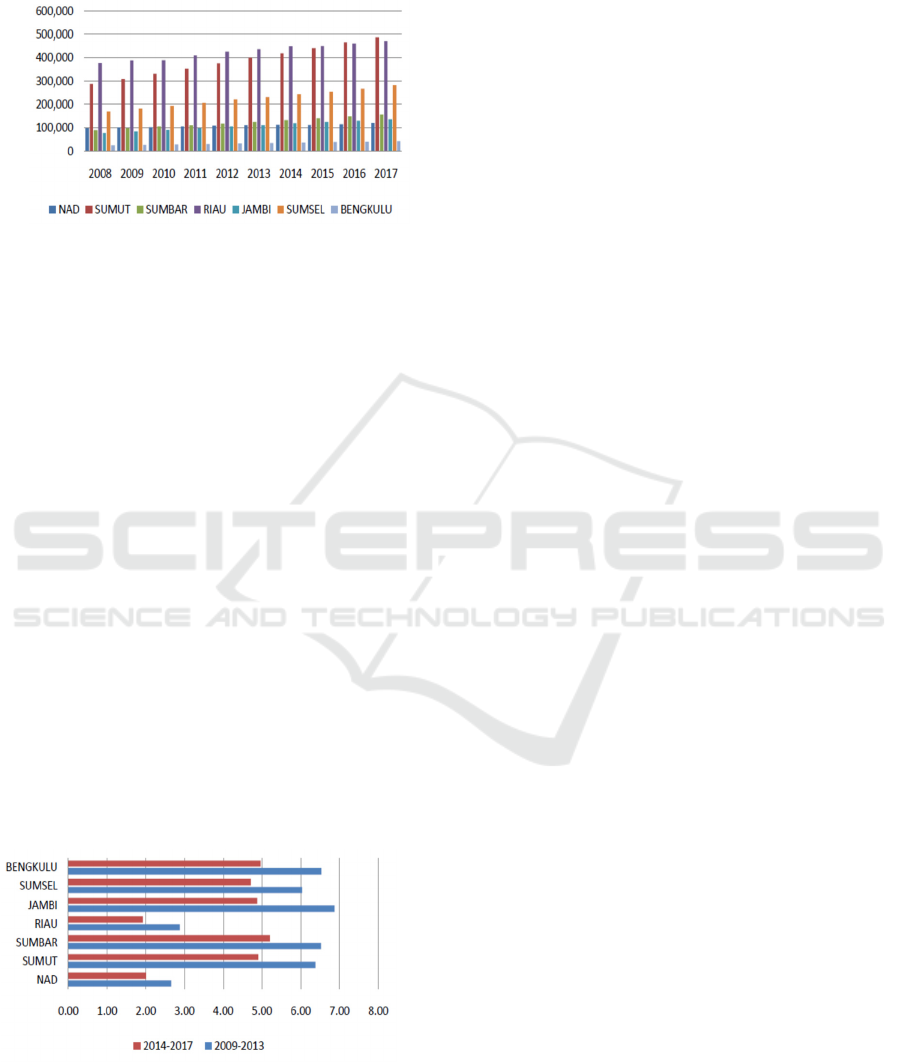
Figure 2 shows the highest Gross Regional
Domestic Product (GRDP) on Sumatra Island in
2008-2015, which was occupied by Riau Province,
followed by North Sumatra and South Sumatra
Provinces, and in 2016-2017 the highest GRDP was
occupied by North Sumatra Province, Riau Province
and South Sumatra Province . While the lowest
GRDP is occupied by Bengkulu Province, Jambi
Province and West Sumatra Province.
Figure 3 shows that the highest economic growth
in 2009-2013 was occupied by Jambi Province,
Bengkulu Province and West Sumatra Province and
the lowest was NAD Province, Riau Province and
South Sumatra Province. While the economic
growth in 2013-2017 the highest economic growth
was occupied by West Sumatra, Bengkulu Province
and Jambi Province and the lowest was occupied by
Riau Province, NAD Province and South Sumatra
Province. Based on figures 2 and 3, the highest
GRDP can be predicted, not necessarily the
economic growth achieved will be high too, whereas
the low GRDP is not necessarily the economic
growth achieved will be low.
Source : Central Bureau of Statistics (Province in
Figures 2008-2018)
Figure 3: Economic Growth in several Province in
Sumatra Island period 2009-2013 until 2014-2017
Factors that can influence economic growth are
fiscal policy. Fiscal policy is an economic policy
carried out by the government in the management of
state finances (through government expenditures
such as government spending on education, health,
agriculture and maritime affairs) with the aim of
directing economic conditions for the better. The
fiscal policy commonly used by regional
governments is the preparation of the Regional
Budget (APBD). APBD is the annual financial plan
of the regional government approved by the
Regional People's Representative Concil (Law No.
17, 2003). The Regional Revenue and Expenditure
Budget (APBD) is prepared in accordance with the
needs of government administration and regional
income capabilities. The preparation of this Regional
Budget is guided by the Regional Government Work
Plan (RKPD) in order to realize services to the
community to achieve the goal of the state. APBD
has the function of authorization, planning,
supervision, allocation, distribution, and stabilization
(Bastian, 2006). The authorization function means
that the regional budget becomes the basis for
implementing income and expenditure in the year
concerned. The planning function means that the
regional budget becomes a guideline for regional
management in planning activities in the year
concerned. The supervisory function means that the
regional budget is a guideline to assess whether the
activities of the local government organizers are in
accordance with the provisions of the applicable
law. The allocation function means that regional
budgets must be directed at creating employment
and waste of resources, as well as increasing
efficiency, and the effectiveness of the economy.
The distribution function means that the regional
budget functions in order to improve income
distribution, so that it will avoid gaps. The
stabilization function means that the regional
government budget is a tool to maintain and strive to
balance the fundamentals of the regional economy.
Fiscal policy occupies a strategic position in
macroeconomic policy. fiscal policy through
government expenditure can influence the rate of
economic growth (Basri, 1995). The purpose of this
study is to look at the role of local governments in
playing the role of fiscal policy in influencing
economic growth in several provinces of Sumatra.
2 LITERATURE REVIEW
Research conducted by Dada (2013), Idrees and
Siddiqi (2013) concluded that government spending
The Effect of Regional Government Expenditure on Economic Growth: Case Study of Sumatera Island - Dynamic Panel Approach
651

on education has a positive influence on economic
growth. Grabova's (2014) study concluded that
government spending on education had a negative
influence on economic growth, while Gisore,
Kiprop, Kalio, Ochieng and Kibet (2014) and Al-
Shatti's (2014) study concluded that government
spending on education had no influence on
economic growth.
Research on the relationship between
government spending on health and economic
growth is carried out by Al-Shatti (2014) and Dada
(2013). The study concluded that government
spending on health had a positive influence on
economic growth in several countries.
Research on the relationship between
government spending on agriculture on economic
growth was carried out by Oyinbo, Zakari and
Rekwot (2013). The results of the study concluded
that spending on agriculture had no effect on
economic growth. Furthermore, the results of the
research by Shuaib, Igbinosun and Ahmed (2015)
and Mursidah, Effendi and Zaini (2017) concluded
that government spending on agriculture promoted
economic growth.
Research on the relationship between
government spending on fisheries and maritime
affairs on economic growth was carried out by
Huda, Purnamadewi and Firdaus (2015), Novianti,
Rifin, Panjaitan and Sri (2014), and Agustine
(2014). The results of the study concluded that
government expenditures for fisheries and maritime
affairs could encourage economic growth.
Research on the relationship between the General
Allocation Fund (DAU) on economic growth was
carried out by Manik and Hidayat (2010), Ahmad
(2011), Tajuddin, Hasanuddin and Rahmatia
(2014).The results of the study concluded that the
General Allocation Fund can encourage economic
growth. Furthermore, the research of Muti'ah (2017)
concluded that balancing funds in the form of
General Allocation Funds had no influence on
economic growth.
Mauro's (1995) study concluded that the practice
of corruption (measured through an index of
corruption), in the form of giving money to speed up
matters that allow economic actors to avoid delays
in their affairs, can support growth if the country's
bureaucratic rules are very bad. The results of the
study of Nawatmi (2014), Gyimah-Brempong
(2002), and Mo (2001) concluded that the corruption
index slows or decreases economic growth, while
also causing inequality and disparity in people's
income.
3 RESEARCH METHODOLOGY
3.1 Data
The data used for the study are secondary data taken
from the Regional Statistics Agency, Ministry of
Finance of the Republic of Indonesia and the
Supreme Audit Agency's Opinion on Regional
Government Financial Reports of various
publications from 2008 to 2017.
Government expenditures for the allocation of
education, health, agriculture and maritime affairs
are obtained from the APBD based on the
government expenditure function for the education
sector allocation, expressed in rupiah and taken from
the Data on Regional Expenditures published by the
Ministry of Finance.
General allocation funds are funds whose amount
is determined based on a presidential decree,
expressed in rupiah and taken from a Presidential
Decree concerning the Provincial General Allocation
Fund.
The Supreme Audit Board's opinion on the
Regional Financial Accountability Report is an
opinion on the fairness of the financial information
presented in the financial statements, expressed in
scale and taken from an overview of the results of
the first semester of the Supreme Audit Board. Fair
Without Exception (WTP) (5), Fair Without
Exception With Explanatory Paragraphs (WTP-
DPP) (4), Fair With Exceptions (WDP) (3),
Unqualified (TW) (2), and Not Giving Opinion
(TMP ) (1).
3.2 Estimation Procedure
The model used is the Dynamic Panel Method
(Panel Error Correction Model). Before estimating
the ECM Panel, it is necessary to take steps such as
data stationary test, cointegration degree test and
then use ECM for short-term analysis. The steps in
formulating the ECM model are as follows:
Conduct expected relationship specifications in the
model under study.
PDRB
t
=
0
+
1
Educ
t
+
2
Health
t
+
3
Agric
t
+
4
Marine
t
+
5
DAU
t
+ u
t
………........ (1)
Information:
PDRBt: Gross Regional Domestic Product per year
in period t
Educt : Expenditures for education period t
Healtht : Expenditures for health period t
Agrict : Expenditures for agriculture period t
Marinet: Expenditures for maritime period t
DAUt : Funds for general allocation period t
UNICEES 2018 - Unimed International Conference on Economics Education and Social Science
652

α : Long-term coefficient
t : Time
I : Province
While short-term relationships are expressed as
follows:
DLnPDRBit = α
0
+
1
DlnEducit +
2
LnHealthit +
3
DLnAgricit +
4
DLnMarinei
t
+
5
DLnMarinei
t +
6
(LnPDRB
t-1
– b
1
LnEduc
t-1
+ b
2
LnHealth
t-1
+
b
3
LnAgric
t-1
+ b
4
LnMarine
t-1
+ b
5
LnDAU
t-1
)
+ u
t
........................................................ (2)
From the results of parameterization of short-term
equations can produce new equations, the equation
is developed from the previous equation to measure
long-term parameters using econometric regression
using the ECM model (Domowitz and Elbadawi,
1987) :
DLnPDRB
it
= β
0
+ β
1
DlnEduc
it
+β
2
LnHealth
it
+ β
3
DLnAgricit + β
4
DLnMarine
it
+ β
5
DLnMarine
it +
ECT(-1) +
t
………………………………………… (3)
ECT(-1) = LnPDRB
t-1
– b
1
LnEduc
t-1
+ b
2
LnHealth
t-1
+ b
3
LnAgric
t-1
+ b
4
LnMarine
t-1
+ b
5
LnDAU
t-1
……………........................................... (4)
Information:
DLnPDRBt is a period t Gross Regional Domestic
Product, DLnEduct is government expenditure for
education period t, DLnHealtht is government
expenditure for health period t, DLnAgrict is
Government Expenditures for Agriculture period t,
DLnMarinet is Government Expenditures for Marine
period t, DLnDAU is General Alignment Fund , µt
is Residual, D is Change, t is Time period, i is
Province and ECT is Error Correction Term.
4 FINDINGS AND DISCUSSION
4.1 Data Stationarity Test Results
Before conducting a regression with the ECM test, it
is first tested whether the variable used is stationary
or not. If the data is not stationary then a spurious
regression will be obtained, an autocorrelation
phenomenon arises and also cannot generalize the
regression results for different times. In addition, if
the data to be used is stationary, OLS regression can
be used, but if it is not stationary, the data needs to
be seen as stationary through the degree of
integration test. And furthermore, data that is not
stationary at the level level has the possibility of
being cointegrated so that cointegration tests are
needed. Then if the data has been cointegrated, ECM
testing can be done.
Table 1: Unit Root Test Result
Source: Data processed
The results of the unit root test all the variables
passed in the 1st Difference test, this can be seen
from the probability of Levin, Lin & Chu * which is
less than 0.01 and the probability of ADF being less
than 0.05 (except DAU).
4.2 Cointegration Test
After knowing that the data is stationary at 1st
Difference, then the next step is to identify whether
the data is cointegrated. For that we need a
cointegration test. Cointegration test is used to give
an initial indication that the model used has a
cointegration relation.
The cointegration test results obtained by forming
residuals are obtained by expressing the independent
variable on the dependent variable in OLS. The
residual must be stationary at the level to be said to
have cointegration.
Table 2: Result of Long Run Coefficient
Dependent Variable
:LOG(PDRB)
Model 1 Model 2
LOG(EDUC) 0.0328**
(0.0130)
0.0333***
(0.0124
)
LOG(HEALTH)
0.0687*
(0.0385)
0.0733*
(0.0366)
LOG(MARINE)
0.1377**
*
(0.0281)
0.1410***
(0.0273)
LOG(AGRIC)
0.0064
(0.0300)
0.0073
(0.0300)
LOG(DAU)
0.0142
(0.0316)
OPINI
0.0272**
(0.0130)
0.0283**
0.0127
R-square
d
0.9952 0.9952
Source: Data processed
The Effect of Regional Government Expenditure on Economic Growth: Case Study of Sumatera Island - Dynamic Panel Approach
653

(***), (**) and (*) indicate significant at 1%, 5%
and 10% significance level respectively. Numbers in
parentheses are standart errors
Table 3: Cointegration Test Results
Method
Model 1 Model 2
Statistic Prob. Statistic Prob.
Levin, Lin &
Chu t* -5.026*** 0.000 -5.064*** 0.00
Im, Pesaran
and Shin W-
sta
t
-2.428*** 0.007 -1.639* 0.05
ADF - Fishe
r
Chi-square 28.85** 0.010 26.81** 0.02
PP - Fishe
r
Chi-square 32.18*** 0.003 22.57* 0.06
Source: Data processed
(***), (**) and (*) indicate significant at 1%, 5%
and 10% significance level respectively. Numbers in
parentheses are standart errors
After testing Levin, Lin & Chu *, Im, Pesaran and
Shin W-stat, ADF and PP to test the resulting
residuals, it was found that the stationary residuals in
the data level were seen from the t-statistic value
which was significant at the critical value of 5% .
Thus it can be said that the data is cointegrated
(Engle & Granger, 1987).
4.3 Short -Term Test
The regression produced through the ECM Panel
equation is a short-term regression result. The results
of the short-term regression equation can be seen in
table 4.
Table 4:Result of Short Run Panel ECM Model
Dependent
Variable :
D(LOG(PDRB))
Model 1 Model 2
D(LOG(EDUC))
0.0041**
(0.0015)
0.0031**
(0.0015)
D(LOG(HEALT
H))
-0.0016
(0.0035)
-0.0011
(0.0038)
D(LOG(MARIN
E))
-0.0008
(0.0041)
0.0050
(0.0036)
D(LOG(AGRIC)
)
0.0036
(0.0033)
0.0011
(0.0042)
D(LOG(DAU))
0.0183***
(0.0034)
OPINI
-0.0081***
(0.0012)
-0.0058***
(0.0013)
ECT(-1)
-0.0645***
(0.0170)
-0.0750***
(0.0186)
R-square
d
0.860118 0.768501
Source: Data processed
(***), (**) and (*) indicate significant at 1%, 5%
and 10% significance level respectively. Numbers in
parentheses are standart errors
Results Table 4 shows that the ECT coefficient
value in the model is significant and is negative for
estimating economic growth (LOG (GRDP)). The
ECM panel estimation results above show that in the
short and long term the variables used in this study
significantly influence economic growth. R2 Model
1 value is around 0.86 or 86%. It can be said that the
types of independent variables included in the model
are very good, because only about 14% of the
diversity of dependent variables is influenced by
independent variables outside the model. While the
value of R2 Model 2 is around 0.768 or 76.8% it can
be said that the types of independent variables
included in the model are very good, because only
about 23.2% of the diversity of the dependent
variable is influenced by the independent variables
outside the model
The estimation results of Model 1 illustrate that
in the short term changes in the education budget
and the General Allocation Fund have a positive
influence on economic growth, ceteris paribus.
While the opinion of the Supreme Audit Board on
the Local Government Financial Statements has a
significant and negative influence on economic
growth. And Model 2 estimates illustrate that in the
short term changes in the education budget have a
positive influence on economic growth, ceteris
paribus. While the opinion of the Supreme Audit
Board on the Local Government Financial
Statements has a significant and negative influence
on economic growth.
Based on these short-term equations using the
ECM panel method produces the ECT coefficient.
This coefficient measures the response rate of each
period which deviates from balance. According to
Widarjono (2007) the ECT imbalance correction
coefficient model 1 in the form of absolute values
explains how fast time is needed to get a balance
value. The ECT coefficient value of 0.0645 means
that the difference between economic growth and its
equilibrium value is 6.45 percent which will be
adjusted within 1 year. While the ECT coefficient
value of 0.075 means that the difference between
economic growth with a balance of 7.5 percent will
be adjusted within 1 year. ECT shows how quickly
equilibrium is reached back into long-term balance.
which shows a long-term and short-term adjustment
to return to the equilibrium position has a slow rate
of speed because the ECT coefficient is negative.
UNICEES 2018 - Unimed International Conference on Economics Education and Social Science
654

The ECM Panel model for model 1 and model 2
needs to be tested for classical assumptions, namely:
normality test, heteroscedasticity test and
multicollinearity test.
This normality test is used to determine whether
the residual is normally distributed or not. To test
whether the data distribution is normal or not can be
done by using the Jarque-Berra test (J-B test).
Table 5: Normality Test Results
Model 1 Model 2
Jarque-Bera 1.715439 2.4854
Prob. 0.424125 0.2886
Source: Data processed
(***), (**) and (*) indicate significant at 1%, 5%
and 10% significance level respectively.
Based on the normality test it can be seen that the
ρ-value Model 1 is 0.424> α = 5% and the Model 2-
value Model 1 is 0.2886> α = 5%. So, it can be
concluded that the data used in the ECM panel
model 1 and model 2 are normally distributed.
Heteroscedasticity is a regression problem in
which the interference factor does not have the same
variance or the variance is not constant. This will
give rise to various problems, namely OLS
estimators that are biased, variants of OLS
coefficients will be wrong. In this study we will use
the method with the Breusch-Pagan test to detect the
presence or absence of heteroscedasticity in the
regression model.
Table 6: Heteroscedasticity Test Results
Variable
LOG(Residual
2
)
Model 1 Model 2
LOG(EDUC)
0.000144
(0.000757)
-0.002263
(0.001695)
LOG(HEALTH)
0.002456
(0.001787)
0.001571
(0.003357)
LOG(MARINE)
0.000715
(0.001910)
-0.003321
(0.002653)
LOG(AGRIC)
-0.003072
(0.001675)
-0.004008
(0.003415)
LOG(DAU)
0.001377
(0.002146)
OPINI
7.45E-05
(0.000615)
-0.000192
(0.000952)
Source: Data processed
(***), (**) and (*) indicate significant at 1%, 5%
and 10% significance level respectively. Numbers in
parentheses are standart errors
Multicollinearity is the existence of a linear
relationship between the independent variables in
the regression model. To test the presence or
absence of multicollinearity in the model,
researchers used a partial method between
independent variables. The rule of thumb of this
method is if the correlation coefficient is high
enough above 0.85 then there is multicollinearity in
the model. Conversely, if the correlation coefficient
is relatively low, the model does not contain
elements of multicollinearity (Gujarati, 2003).
Based on testing with the partial correlation
method between independent variables, it was found
that there was no multicollinearity problem in the
model. That is because the correlation matrix value
is less than 0.85.
Table 7: Serial Correlation Results
Source: Data processed
5 CONCLUSIONS
Local government spending on education both in the
long term and in the short term affects economic
growth. Education occupies an important role in
increasing GRDP. Improving education both in the
short term and in the long term will encourage
increased productivity and competitiveness of
regions in Sumatra. Local governments must
implement the National Education System Law No.
20 of 2003 in a democratic and non-discriminatory
manner by developing students creatively and
encouraging a culture of reading and writing.
Expenditures for health, marine and agriculture
in the short term have not been able to encourage
economic growth. Whereas in the long run, health
and marine expenditures encourage economic
growth. Health is an indirect investment, and
increased expenditure on marine infrastructure is
direct investment (Todaro and Smith, 2012; 151) so
that health requires a very large investment and can
be achieved in the long term. Increased government
spending on health will increase the health of the
people and increase worker productivity. While the
potential of the waters around the island of Sumatra
requires a very large budget and will only be
achieved in the long term.
Agricultural expenditure does not encourage
economic growth on the island of Sumatra in the
long term, this is due to agricultural programs
The Effect of Regional Government Expenditure on Economic Growth: Case Study of Sumatera Island - Dynamic Panel Approach
655

financed by regional government spending not yet
effective and not on target, especially assistance
with agricultural production tools (Alsintan), so that
local governments need to reevaluate programs that
are needed by farmers in the area.
General allocation funds in the short term affect
economic growth, but in the long run do not affect
economic growth. General allocation funds from the
central government, it is mandatory for local
governments to manage them properly, because it
will be beneficial to the development and progress
of the region. In the short term, the lack of funding
for regional development can be covered by the
transfer of general allocation funds from the central
government so as to encourage economic growth,
but for most regions in the long run the lack of
personnel expenditure due to increases in salaries
and employee welfare costs is funded by general
allocation funds has an impact on reducing regional
development programs, and ultimately inhibits
regional economic development.
BPK's opinion on short-term regional financial
reports has a negative relationship with economic
growth. Local governments in any way will do so
that financial statements are categorized as
unqualified, in the short term these financial
statements will burden development targets because
indicators that are not yet commonly done by the
behavior of local government employees. In the long
term, all activities that use the government budget
must be transparent and accountable and the targets
set can be achieved. So that the BPK's opinion in the
long run will encourage economic growth in the
Sumatra region.
This study has limitations, especially not all
provinces can be used as studies because of limited
data, and secondly there are still many
macroeconomic variables that can be used as a
determinant variable in economic growth in the
provinces in Sumatra.
REFERENCES
Agustine, A.D., (2014). Pengembangan Sektor Kelautan
dan Perikanan Untuk Meningkatkan Pendapatan Asli
Daerah (Studi di Dinas Kelautan dan Perikanan
Kabupaten Banyuwangi). Jurnal Administrasi
Publik, 2(2), pp.276-280.
Ahmad, I., (2011). Regional Fiscal Independence In East
Java Province Post Regional Autonomy. Economic
Journal of Emerging Markets, 3(2), pp.189-198.
Al-Shatti, A.S., (2014). The Impact of Public Expenditures
on Economic Growth in Jordan. International
Journal of economics and Finance, 6(10), p.157
Basri, F (1995). Perekonomian Indonesia Menjelang Abad
XXI, Penerbit Erlangga.
Bastian, I., (2006). Sistem Perencanaan dan Penganggaran
Pemerintahan Daerah di Indonesia, Salemba Empat,
Jakarta.
Dada, MA. (2013). Composition Effect of Government
Expenditure on Private Consumption and Output
Growth in Nigeria: a Single Equation Error
correction Modelling, Rumanian Journal of fiscal
polic. Vol. 4. issue 2(7). July-Des 2013.
Domowitz, I. and Elbadawi, I., (1987). An error-correction
approach to money demand: the case of Sudan.
Journal of Development Economics, 26(2), pp.257-
275.
Engle, R.F. and Granger, C.W., (1987). Co-integration and
error correction: representation, estimation, and
testing. Econometrica: journal of the Econometric
Society, pp.251-276.
Gisore, N., Kiprop, S., Kalio, A., Ochieng, J. and Kibet,
L., (2014). Effect of government expenditure on
economic growth in East Africa: A disaggregated
model. European Journal of Business and Social
Sciences, 3(8), pp.289-304.
Grabova, P., (2014). Corruption impact on Economic
Growth: An empirical analysis. Journal of Economic
Development, Management, IT, Finance, and
Marketing, 6(2), p.57.
Gujarati, D.N. (2003), Basic Econometrics. New York:
Mc.Graw-Hill.
Gyimah-Brempong, K., (2002). Corruption, economic
growth, and income inequality in Africa. Economics
of Governance, 3(3), pp.183-209
Huda, H.M., Purnamadewi, Y.L. and Firdaus, M.,( 2015).
Industrialisasi Perikanan Dalam Pengembangan
Wilayah di Jawa Timur. Tataloka, 17(2), pp.99-112.
Idrees, A.S. and Siddiqi, M.W., (2013). Does public
education expenditure cause economic growth?
Comparison of developed and developing countries.
Pakistan Journal of Commerce and Social Sciences,
7(1), p.174.
Manik, R.E. and Hidayat, P., (2010). Analisis kausalitas
antara pengeluaran pemerintah dan pertumbuhan
ekonomi Sumatera utara (Metode Cointegration Test
dan Granger causality Test). Jurnal Keuangan &
Bisnis Program Studi Magister Manajemen Sekolah
Tinggi Ilmu Ekonomi Harapan, 2(1), pp.46-56.
Mauro, P., (1995). Corruption and growth. The quarterly
journal of economics, 110(3), pp.681-712.
Mo, P.H., (2001). Corruption and economic growth.
Journal of comparative economics, 29(1), pp.66-79.
UNICEES 2018 - Unimed International Conference on Economics Education and Social Science
656

Mursidah, M., Effendi, M. and Zaini, A., (2017). Analisis
Dampak Penggunaan Anggaran Sektor Pertanian
Terhadap Pertumbuhan Ekonomi Sektor Pertanian di
Provinsi Kalimantan Timur. Jurnal Pertanian
Terpadu, pp.58-69.
Muti’ah, (2017), The Effect of Regional Revenue,
Revenue Sharing Fund, General Allocation Fund
and Special Allocation Fund on Regional Economic
Growth (Empirical Study In the 33 provinces in
Indonesia Year 2011-2014), Research Journal of
Finance and Accounting, vol. 8, no. 8, pp.102-111.
Nawatmi, S., (2014). Korupsi Dan Pertumbuhan Ekonomi
Negara-Negara Asia Pasifik. Jurnal Bisnis dan
Ekonomi, 21(1). hh. 73-82.
Novianti, T, Rifin, A, Panjaitan, DV & Sri, R WN.,
(2014), The Infrastructure’s Influence on the Asean
Countries Economic Growth, Journal of Economics
and Development Studies, vol. 2, no. 4, pp. 243-254.
Oyinbo, O., Zakari, A. and Rekwot, G.Z., (2013).
Agricultural budgetary allocation and economic
growth in Nigeria: implications for agricultural
transformation in Nigeria. Journal of Sustainable
Development, 10(1), pp.16-27.
Shuaib, I.M., Igbinosun, F.E. and Ahmed, A.E., (2015).
Impact of Government agricultural expenditure on
the growth of the Nigerian economy. Asian Journal
of Agricultural Extension, Economics and
Sociology, 6(1), pp.23-33.
Tajuddin, I., Hasanuddin, B. and Rahmatia, P.U., (2014).
The Effects Of General Allocation Funds, Special
Allocation Funds And Revenue-Sharing Funds On
Investment, Economic Growth, Economic Structure,
And Employment. Journal of Research in Business
and Management vol. 2, Issue 10 pp. 54-61.
Todaro, MP., (1999). Economics Development in the
Third World, The Longman Inc, New York.
Todaro, MP., and Smith, SC., (2012), Economic
development, Boston, Mass, Addison-Wesley.
Widarjono, A., (2007). Ekonometrika Teori dan Aplikas,.
Yogyakarta, Ekonisia FE. UII.
The Effect of Regional Government Expenditure on Economic Growth: Case Study of Sumatera Island - Dynamic Panel Approach
657
