
Analysis the Interdependence of Foreign Debt and Economic Growth
in Indonesia
Mayani Pratiwi Pasaribu
1
, Muhammad Fitri Rahmadana
2
and Fitrawaty
2
1
Graduate Faculty State University Of Medan, Medan – Indonesia
2
Faculty of Economic, State University Of Medan, Medan - Indonesia
Keywords: Foreign Debt, Economic Growth
Abstract: This research is aimed to analyze interdependence of foreign debt on economic growth in Indonesia.
Methods used in this research with Vector Autoregression (VAR), by using time series yearly data from
1991 to 2016. Model analysis tools obtained is estimation results obtained, the relationship between the two
variables, namely external debt and economic growth have a 2-way relationship or feedback, meaning that
both variables affect each other. And based on the results of the unit root test (Unit Roots Test), the
relationship between the two variables external debt and economic growth have a relationship stationary at
first differences which means that there is a long-term relationship between external debt and economic
growth in Indonesia.
1 INTRODUCTION
Sustainable development is needed to improve the
economy of a country. Indonesia, as the country is
developing, it has obstacles in realizing development
programs for national prosperity. The government
faces the problem of limited capital to finance
development. This is due to the gap in income and
expenditure or the existence of a development
budget deficit. The Indonesian government carries
out various policies including implementing foreign
debt policies.
According to the Big Indonesian Dictionary, debt
is money that borrowed from other people. While
etymologically, debt or debt (English) comes from
the French term dette or Latin term debit which
means "the one who owes”. The term debtor is said
to have been first used in English in the early 13th
century.
The Big Indonesian Dictionary also defines loans
as debts borrowed from other parties with the
obligation to repay. Whereas Foreign Loans are a
number of funds obtained from other countries
(bilateral) or (multilateral) which are reflected in the
balance of payments for investment activities, close
the saving-investment gap and foreign exchange gap
that is carried out by both the government and the
private sector.
According SKB Menteri Keuangan and Kepala
Bappenas (No. 185/KMK.03/1995 dan Nomor
KEP.031/ KET/5/1995) Foreign Loans are state
revenues in the form of foreign exchange, or foreign
exchange that is ratified or in the form of goods and
services obtained from the provision of foreign loans
that must be repaid with certain conditions.
People, companies and countries institutionally
are never separated from the practice of debts. Not
only for business purposes, but also for meeting
consumer needs. In business, debt is considered a
common thing to increase business capital.
Something similar happened in the governance of a
country. Almost all countries, have even continued
to owe to add funds or national development capital.
Indonesia, as a developing country, has a long
history of debt or loans to external parties, both
bilaterally and multilaterally through international
and regional financial institutions.
Lincolin Arsyad (2010) said foreign debt is a
source of funding for government budgets and
economic development. External debt is used to
finance state expenditure so that it can support
economic activities, especially productive activities
so that in turn it will encourage economic growth.
Debt is usually used to finance budget deficits.
Foreign debt can be a variable that can drive the
economy while hampering economic growth.
Encourage the economy to mean, if the debts are
used to open employment and investment in the
Pasaribu, M., Rahmadana, M. and Fitrawaty, .
Analysis the Interdependence of Foreign Debt and Economic Growth in Indonesia.
DOI: 10.5220/0009510406430649
In Proceedings of the 1st Unimed International Conference on Economics Education and Social Science (UNICEES 2018), pages 643-649
ISBN: 978-989-758-432-9
Copyright
c
2020 by SCITEPRESS – Science and Technology Publications, Lda. All rights reserved
643
0
2E+11
4E+11
6E+11
8E+11
1E+12
1.2E+12
1991
1994
1997
2000
2003
2006
2009
2012
2015
stokULNtotal
(miliardollarAS)
GDP(constant
2010US$)
development sector which can ultimately drive an
economy, while inhibiting growth if the debts are
not used optimally because there is still a lack of
oversight function of the person in charge of the
debts themselves.
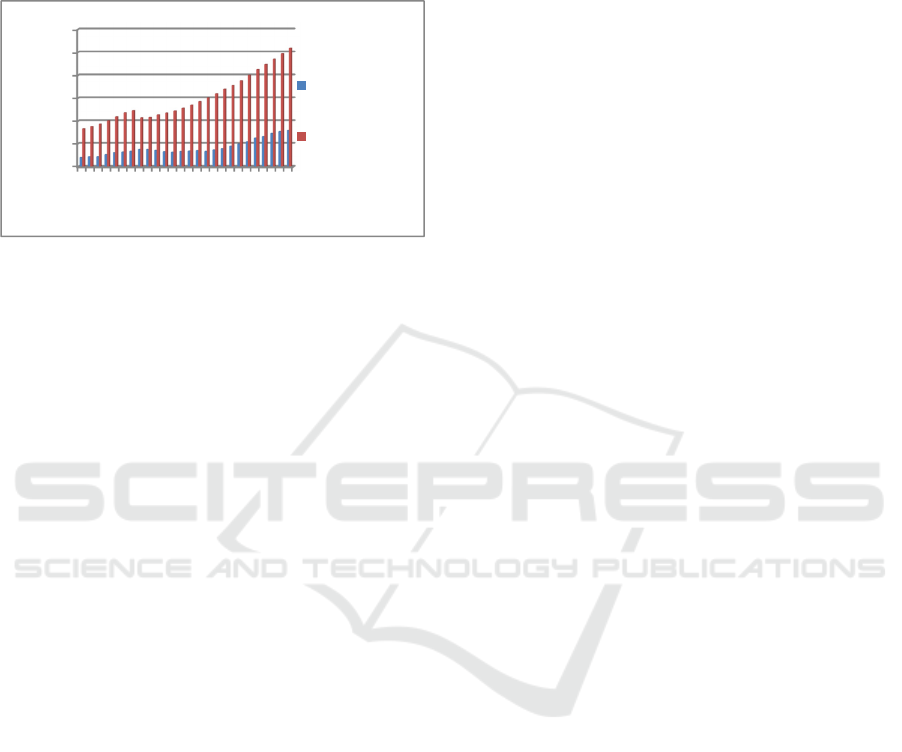
Source: worldbank.go.id
Figure 1: Graph of the development of foreign debt
and economic growth in Indonesia from 1991-2016
Based on the graph above that shows the total
external debt and GDP both fluctuate. But from
2007 to 2016 the total external debt and GDP
experienced an increase every year. Foreign debt
continues to increase because the government cannot
meet the needs of the economy. And GDP that
continues to increase is supported by growth in
public consumption, government and private
investment, and other things are not discussed in this
study.
Normatively, every foreign debt is used by
Indonesia is for development expenditure. The hope
is to participate in financing various development
projects and creating economic growth as indicated
by rising GDP values and creating jobs, which in
turn can contribute to reducing poverty.
In practice, not all foreign debt is spent on
development spending. Some of the debt is actually
used to cover the principal and interest installments.
Hernatasa's research (2004) found the existence of
Fisher Paradox, a situation where more and more
foreign debt repayments were made, the greater the
accumulation of foreign debt. A similar condition
was stated by other researchers that installments plus
interest on foreign debt were substantially financed
by new debts resulting in a net transfer of financial
resources from Indonesia to foreign creditors
(Swasono dan Arief, 1999).
This condition is certainly not profitable. This is
because most of the funds from the State Budget
(APBN) are expected to drive the economy, turned
out to be sucked in by routine expenditures, most of
them which were realized in principal installments
and debt interest. The payment of principal and
interest on foreign debt has an effect on the economy
because in certain conditions the installment
payments can have a negative impact on the
economy there by eliminating the positive
contribution of foreign debt.
Foreign debt is needed to have a positive
influence on economic growth such as by increasing
production (GDP), expand employment
opportunities and improve balance of payments.
However, if the debt is used improperly then the
possibility of being able to have a negative impact
on economic growth even threatens the country's
macroeconomic stability.
Rachmadi (2013:13) said that Indonesia's
Foreign Debt is able to encourage Indonesia's
Economic Growth. Economic sectors that absorb
foreign debt are quite high, proven to show
increasing GDP growth.
Atmadja (2000) said that in the short term,
foreign debt is very helpful for the Indonesian
government in its efforts to cover the budget deficit
of state revenues and expenditures, due to the
financing of routine expenses and considerable
development expenditures. But in the long run, it
turns out that the government's foreign debt can
cause various economic problems in Indonesia, one
of which can cause the rupiah exchange rate to fall.
Foreign debt is like development capital. Foreign
debt can increase investment activities so that
domestic needs can be met. In the economy of a
country there is an indicator that is used to assess
whether the economy is going well or badly.
Indicators in assessing the economy are reflected in
GDP growth.
With all the reviews above, in this study, the
author will discuss how the reciprocal relationship
between foreign debt and economic growth in
Indonesia.
2 THEORICAL FRAMEWORK
Foreign debt
Foreign debt is part of the total state debt obtained
from creditors outside the country. Recipients of
foreign debt can be in the form of governments,
companies or individuals. The form of debt can be in
the form of money obtained from private banks,
governments of other countries or international
financial institutions.
Indonesia is one of the third world countries.
Before the monetary crisis in the Southeast Asia
region, Indonesia had a fairly high economic growth
rate. This is in line with the economic development
strategy reserved by the government at that time,
which placed high economic growth as a priority
target of national economic development.
UNICEES 2018 - Unimed International Conference on Economics Education and Social Science
644

Indonesia's economic growth since the end of the
1970 has always been positive, and the level of
income per capita is relatively low, causing the
relatively high target of economic growth to be
insufficiently financed with own capital, but it must
be supported by using foreign capital assistance. The
government which initially became the main motor
of development continues to increase its foreign debt
so that it can be used to finance national economic
development in order to achieve the target of such a
high level of economic growth, without being
accompanied by an increase in the ability to
mobilize capital in the country. This indicates a
positive correlation between the success of
economic development at the macro level and an
increase in the amount of government foreign debt
(growth with indebtedness) (Atmadja, 2000).
EVIEWS application for the VAR:
Stationarity test, optimum lag selection,
Cointegration Test, Vector error correction model
(VECM), Instrument vector Autoregression.
ܲܧ
௧
ൌ ܽ
ܷܮܰ
௧
െ݅ ܾ
ܲܧ
௧ି
ߜݐ
ୀଵ
ୀଵ
ܷܮܰ
௧
ൌ ܿ
ܷܮܰ
௧
െ݅ ݆
ܲܧ
௧ି
ߣݐ
ୀଵ
ୀଵ
It is assumed that δt and λt are not
correlated.
PE = Economic Growth
PEt-j = Economic Growth Lag
ULN = foreign debt
ܷܮܰ
ݐ
െ݅ = foreign debt Lag
Economic growth
In general, economic growth is defined as an
increase in the ability of an economy to produce
goods and services. Economic growth is one of the
most important indicators in carrying out an analysis
of economic development that occurs in a country.
Economic growth shows the extent to which
economic activity will generate additional
community income in a given period. Because
basically economic activity is a process of using
production factors to produce output, then this
process in turn will result in a return of service to the
factors of production owned by the community.
With the economic growth, it is expected that
people's income as the owner of production factors
will also increase (Sukirno, 2006: 423).
Factors that influence economic growth
according to Sukirno (2010: 429) include: land and
other natural wealth; the number and quality of the
population and labor; capital goods and technology
level; social system and attitudes of the community;
market area as a source of growth.
3 RESEARCH METHOD
This study will examine the analysis of foreign debt
and economic growth in Indonesia (Cointegration
Method) during the period 1991-2016. Problems in
this study will be analyzed using vector
autoregression. Simply put, VAR describes a
relationship that "causes each other" (causality)
between variables in the system, by adding an
intercept. Outcome data were analyzed using the
EVIEWS application for the VAR: Stationarity test,
optimum lag selection, Cointegration Test, Vector
error correction model (VECM), Instrument vector
Autoregression.
4 RESULT AND DISCUSSION
1. Stationary Data Test
Stationary data testing can be done with the graph
method and unit root method. Unit root test is used
augmented Dickey-fuller test (ADF) if the value of
absolute statistics t is smaller than the critical value
in the MacKinnon table at various levels of
confidence (1%, 5% and 10%). Then indicates data
is not stationary. Besides that it can also be seen in a
prob value greater than 0.05 which also indicates
that the data is not stationary. Conversely, if the
ADF value is greater than the critical value of
various levels of confidence (1%, 5% and 10%),
then there is no unit root or stationary data.
Table 1: ADF Test
Variable
Unit
Roo
t
Include in test
equation
ADF Test
Statistic
Critical
Value 5%
Probability Information
Foreign
Debt
Level Intercept -0,383176 -2.991878 0.8972
Stasioner
b
ut
not
significan
t
First Diff Intercep
t
-3.021560 -2.991878 0.0471 Stasione
r
Economic
Growth
Level Intercep
t
-4.771149 -2.991878 0.0008 Stasione
r
First Diff Intercep
t
-7.082076 -2.991878 0.0000 Stasione
r
Analysis the Interdependence of Foreign Debt and Economic Growth in Indonesia
645

Table 1, it can be explained that the ADF test value
for foreign debt rates is smaller than the critical
value of 5%, means that it is stationary both at the
level but not significant, so first data is taken which
is stationary & significant. And the Economic
Growth variable is stationary at level, first different
but to equalize the data then first different is taken.
For second different in this study it was not tested
again.
2. Optimal Lag Length Test
The VAR approach is very sensitive to the amount
of data lag used, therefore it is necessary to set the
optimal lag length. Determination of the length of
the lag is used to determine the length of the period
of influence on an endogenous variable with the past
time and other endogenous variables. Determination
of length of lag can be seen from the values of the
LikelihoodRratio (LR), Final Prediction Error (FPE),
Akaike Information Criterion (AIC) and Schwarz
information (SC). Values can be seen from table 2,
the results of the optimal lag length test below.
Table 2: Optimum Lag Length Test
VAR Lag Order Selection Criteria
Endogenous variables: DLGDP DLULN
Exogenous variables: C
Date: 11/26/18 Time: 22:15
Sample: 1991 2016
Included observations: 22
Lag LogL LR FPE AIC SC HQ
0 -26.88643 NA 0.047378 2.626039 2.725225 2.649404
1 -19.00813 13.60796* 0.033411* 2.273467* 2.571024* 2.343562*
2 -18.04356 1.490709 0.044593 2.549414 3.045343 2.666240
3 -17.10400 1.281208 0.060667 2.827637 3.521936 2.991193
Table 3: Granger Causality Test
Pairwise Granger Causality Tests
Date: 11/26/18 Time: 22:18
Sample: 1991 2016
Lags: 1
Null Hypothesis: Obs F-Statistic Prob.
DLULN does not Granger Cause
DLGDP
24 0.14953 0.7029
DLGDP does not Granger Cause 24
DLULN
0.00183 0.9662
In table 3 all variables have a reciprocal
relationship or have a significant two-way
relationship at the level of 5% (probability> 0.05) in
lag 1. It means that foreign debt affects economic
growth but not significantly.
3. Results of Analysis of causality granger
Granger causality test between research variables is
intended to find out the causality relationship
between variables (Nachrowi, 2006: 289). From the
following table the results of these tests can be
known to be reciprocal relationships.
UNICEES 2018 - Unimed International Conference on Economics Education and Social Science
646

4.Cointegration Test Results
Cointegration means there is a long-term
relationship (balance). In the short term and the
possibility of imbalance (disequilibrium). Because
of this imbalance, correction is needed with an error
correction model introduced by Sarga, developed by
Hendry and popularized by Engle and Granger
(Winarno, 2006: 11.7-11.9). There are three ways to
test cointegration, namely 1) Engle Grenger
Cointegration Test 2) Cointegration regression
Durbin Watson 3) Johansen test.
This study uses the johansen test, with the
johansen test, compared the value of the trance
statistic with the critical value at the confidence
level of 5% and 1%. If the value of the trance
statistic is smaller than the critical value, it can be
concluded that the two variables are not mutually
integrated (Winarno, 2006: 11.7).
Through the Johansen cointegration test in Table
5 below, there appears a trace statistic value> critical
value at a 5% confidence level. Thus indicating both
variables mutually co-ordinate. This cointegeration
is also shown in the notes below the table that says
"Trace test indicates 2 cointegrating eqn (s) at the
0.05 level".
Table 4: Johansen's Co-integration Test
Date: 11/26/18 Time: 22:50
Sample (adjusted): 1994 2016
Included observations: 23 after adjustments
Trend assumption: Linear deterministic trend
Series: DLGDP DLULN
Lags interval (in first differences): 1 to 1
Unrestricted Cointegration Rank Test (Trace)
Hypothesized Trace 0.05
No. of CE(s) Eigenvalue Statistic Critical Value Prob.**
None * 0.510925 20.95249 15.49471 0.0068
At most 1 * 0.177774 4.502011 3.841466 0.0338
Trace test indicates 2 cointegrating eqn(s) at the 0.05 level
* denotes rejection of the hypothesis at the 0.05 level
**MacKinnon-Haug-Michelis (1999) p-values
Unrestricted Cointegration Rank Test (Maximum Eigenvalue)
Hypothesized Max-Eigen 0.05
No. of CE(s) Eigenvalue Statistic Critical Value Prob.**
None * 0.510925 16.45048 14.26460 0.0222
At most 1 * 0.177774 4.502011 3.841466 0.0338
Max-eigenvalue test indicates 2 cointegrating eqn(s) at the 0.05 level
* denotes rejection of the hypothesis at the 0.05 level
**MacKinnon-Haug-Michelis (1999) p-values
Unrestricted Cointegrating Coefficients (normalized by b'*S11*b=I):
DLGDP DLULN
-0.716983 -0.925173
-0.096663 -18.03208
Unrestricted Adjustment Coefficients (alpha):
D(DLGDP) 2.789485 -0.158747
D(DLULN) -0.007701 0.027157
1 Cointegrating Equation(s): Log likelihood -24.91166
Analysis the Interdependence of Foreign Debt and Economic Growth in Indonesia
647
Normalized cointegrating coefficients (standard error in parentheses)
DLGDP DLULN
1.000000 1.290370
(5.55576)
Adjustment coefficients (standard error in parentheses)
D(DLGDP) -2.000014
(0.45317)
D(DLULN) 0.005522
(0.01067)
The next indicator based on the results of the co-
operation test, there is no sign of co-integration with
the symbol (*) at most 1. If there are marked (**) or
(*) at least one, then the equation must be solved by
the VECM method (Vector Error Correction Model)
Based on Johansen's co-integration test of the two
variables in the equation system, we can find out the
number of possible relationships.
Seen in the table above that there are:
• The trace test identifies 1 cointegration equation
at the level of 5%.
• At the Max Eigenvalue test identify there is a
cointegration equation at the level of 5%.
Thus, between the variables of Foreign Debt and
Economic Growth in Indonesia there is a
relationship between long-term balance stability and
movement in the long run, while in the short term all
variables are mutually adjusted to achieve long-term
balance.
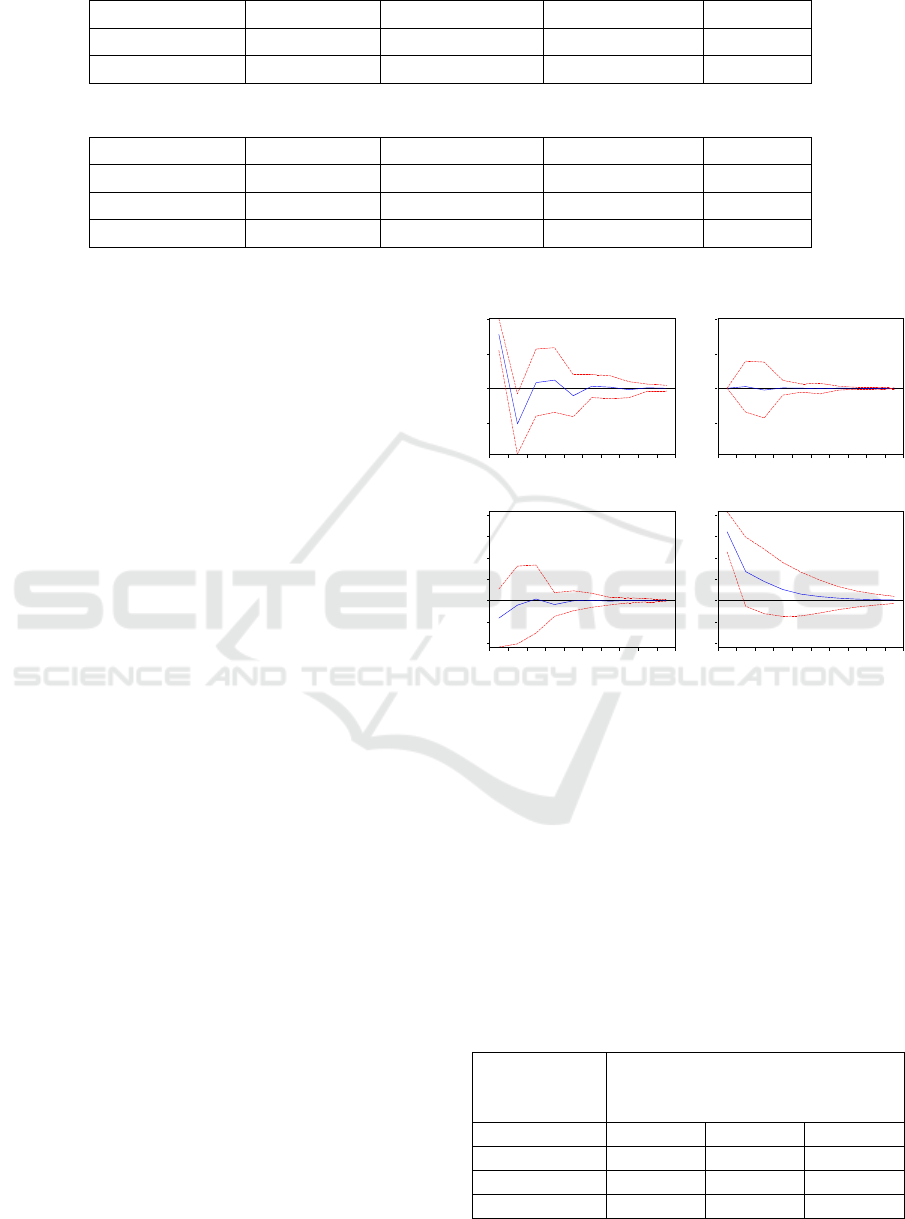
5. Impulse Response Analysis and Variance
Decomposition
• Impulse Response Analysis
Figure 2 shows the Impulse of Foreign Debt
Response to Economic Growth, and the Response of
economic growth to foreign debt.
-2
0
2
4
1 2 3 4 5 6 7 8 9 10
Response of DLGDP to DLGDP
-2
0
2
4
1 2 3 4 5 6 7 8 9 10
Response of DLGDP to DLULN
-.04
-.02
.00
.02
.04
.06
.08
1 2 3 4 5 6 7 8 9 10
Response of DLULN to DLGDP
-.04
-.02
.00
.02
.04
.06
.08
1 2 3 4 5 6 7 8 9 10
Response of DLULN to DLULN
Response to Cholesky One S.D. (d.f. adjusted) Innovations ± 2 S.E.
Figure 2: Foreign Debt Response to Different
Economic Growth
• Analysis of Variance Decomposition
After analyzing the dynamic behavior of the model
through impulse response functions, then the
characteristics of the model will be seen through
Variance Decomposition. The results of variance
decomposition can be seen in table 5 where
fluctuations in Differences in Economic Growth are
influenced by Foreign Debt. In the second period the
highest economic growth of 99.93% continued to
decline until the tenth period to 99.86%. Conversely
the effect of profit sharing experienced an opposite
increase starting from 0.0687% in the second period
to 0.1479% in the 10th period.
Tabel 5: Variance Decompotion Test
Variance
Decomposition
of DLGDP:
Period S.E. DLGDP DLULN
1 3.109088 100.0000 0.000000
2 3.728966 99.93126 0.068741
3 3.744707 99.85681 0.143188
UNICEES 2018 - Unimed International Conference on Economics Education and Social Science
648

4 3.774806 99.85350 0.146503
5 3.798797 99.85477 0.145235
6 3.800908 99.85241 0.147589
7 3.801390 99.85205 0.147947
8 3.802274 99.85212 0.147879
9 3.802433 99.85206 0.147944
10 3.802436 99.85203 0.147966
Variance
Decomposition
of DLULN:
Period S.E. DLGDP DLULN
1 0.066567 6.253329 93.74667
2 0.071958 5.724630 94.27537
3 0.074124 5.423298 94.57670
4 0.074926 5.578608 94.42139
5 0.075154 5.548120 94.45188
6 0.075237 5.536035 94.46397
7 0.075269 5.542479 94.45752
8 0.075278 5.541134 94.45887
9 0.075281 5.540655 94.45934
10 0.075283 5.540893 94.45911
Cholesky Ordering: DLGDP DLULN
5 CONCLUSIONS
After analyzing the research above, the author
concludes as follows:
1. Foreign Debt and Economic Growth are closely
related and influence each other. Increasing
Economic Growth has a positive effect on
Foreign Debt. In the long run, the relationship
between Foreign Debt and economic growth
tends to be stable but the short term tends to
decrease.
2. Johansen's cointegration test appears trace
statistic value > critical value at 5% confidence
level. Thus identifying both mutually integrated
variables.
SUGGESTION: It is necessary to do further studies
by using variables outside that used in this study..
REFERENCES
Arends, R. I. (2008) LEARNING TO TEACH (Belajar
Atmadja, A. S. (2000). Utang Luar Negeri Pemerintah
Indonesia: Perkembangan dan Dampaknya. Jurnal
Akuntansi dan Keuangan, 02 (01), 83-94.
Arsyad, Lincolin. (2010). Ekonomi pembangunan.
Yogyakarta: UPP STIM YKPN.
Hernatasa. (2004). Analisis utang luar negeri Indonesia
terhadap pertumbuhan ekonomi. Bogor: Tesis SPS-
IPB).
Rachmadi, A. L. (2013). "Analisis Pengaruh Utang Luar
Negeri Terhadap Pertumbuhan Ekonomi Indonesia
(Studi Kasus Tahun 2001-2011)".Jurnal Ilmiah
Sukirno, S. (2010). Makroekonomi Teori Pengantar Edisi
ke tiga. Jakarta: PT Raja Grafindo Persada.
Sukirno, S. (2006). Makroekonomi: Teori Pengantar.
Jakarta: PT Raja Grafindo Persada.
Swasono, S.E. dan Arief S. (1999). Pembangunan tanpa
utang: utang luar negeri dan ekonomi indonesia.
Republika, 15 Desember 1999.
Analysis the Interdependence of Foreign Debt and Economic Growth in Indonesia
649
