
Quantifying the ISO 9001:2008 Quality Management System Audit
Reports to Measure the Implementation Performance
Euis Hendrawati
1
, Dedi Purwana
1
and Muchlis R. Luddin
1
1
Program Pasca Sarjana, Universitas Negeri Jakarta
Keywords: CIPP Model, Evaluation Model, Effectiveness, ISO 9001:2008 QMS, Performance Measurement
Abstract: High competition in education sector has made school managements to improve performance of their
organizations. Inline with such a purpose, Al-Azhar BSD Islamic High School in Tangerang Indonesia has
been implementing ISO 9001:2008 Quality Management System since 2010. The aim of the research is to
perform an analysis of audit findings registered between 2010 and 2015, as a part of the review process of
the ISO 9001:2008 QMS. Audit findings consist of non-conformities, opportunities for improvement and
positive observation. They are then analyzed using Context-Input-Process-Product (CIPP) evaluation
model. A new method is introduced to transform the narrative based conformity reports into quantitative
ones. Having this approach, comparison among each CIPP’s component can be performed in time series
basis. The result shows that the proposed quantification method can be used to present the performance
improvement of QMS implementation for each CIPP component.
1 INTRODUCTION
High competition in education sector has made the
school managements to improve the performance of
their organizations. They must be capable of
identifying the current quality performance whilst
realigning with their strategies, operations and
processs in order to improve their performance.
Rusjan and Alič (2010) and Fons (2011) presented a
correlation between business success and
implemented QMS. Inline with their findings, Smith,
Bester and Moll (2014) have shown that many top-
performing businesses that achieved superior levels
of success and sustainability had also implemented a
sound and well-maintained Quality Management
System (QMS). It can be said that such a well
maintained QMS is ISO 9000 series. Indeed, it is
also the most successful standard in ISO history
because there is over 1,1 million registrations with
registrants in almost 200 countries from all
continents (Charlet, 2017). ISO 9000 series
standards provide clear guidelines for the top
management of institutions or schools to improve
the performance of their education system (Cheng,
Lyu and Lin, 2004).
Basically it is a voluntary standard and its
certification is not compulsory. Any organization
can implement it solely for the internal benefits it
brings in increased effectiveness and efficiency of
their operations, without incurring the investment
required in a certification program. Getting
certification may be a business decision which will
be mostly based on:
1. A legally binding necessity from a client as a
condition for working together;
2. Organization's general risk executives strategy;
3. Recognition of an organizatiion's endeavors in
building up a successful QMS;
4. A marketing tool for picking up a focused edge
in the marketplace.
Al-Azhar BSD Islamic High School located in
South Tangerang, Indonesia, holds an ISO
9001:2008 QMS Certification since 2010. The aim
of the research is to assess and evaluate the
effectiveness and efficiency of the school’s
operation after getting the QMS certificate by
performing an analysis of audit findings registered
between 2010 and 2015. Since it is a kind of
accountability evaluation, a CIPP (Context-Input-
Process-Product) Model of Evaluation founded by
Hendrawati, E., Purwana, D. and Luddin, M.
Quantifying the ISO 9001:2008 Quality Management System Audit Reports to Measure the Implementation Performance.
DOI: 10.5220/0009509308670876
In Proceedings of the 1st Unimed International Conference on Economics Education and Social Science (UNICEES 2018), pages 867-876
ISBN: 978-989-758-432-9
Copyright
c
2020 by SCITEPRESS – Science and Technology Publications, Lda. All rights reserved
867
Stufflebeam will be used as a tool to measure the
QMS implementation.
Kenny and Bourne (2015) regarded that
performance measurement is the process and results
of quantifying outcomes. Then, outcomes need to be
distinguished from activities. However there is a
natural tendency in organizations to measure activity
and call this “performance measurement” (Kenny,
2011). This error occurs for two reasons. The first is
that managers are surrounded by and deal with
operations on a daily basis. Naturally when it comes
to measurement, managers think of activity first. The
second reason is that activities are undertaken by
people and managers are driven to measure the
performance of people. As a result, performance
measurement often fails to progress beyond
measuring activity.
ISO 9001:2008 clearly specifies performance
measure as a part of its demand. Performance
measure helps to bring additional scientific analysis
into a decision-making method. It underlines the
change towards management by information and
knowledge, instead of primarily relying on
experiences and judgment (Phusavat et al., 2009). A
performance measurement system can be defined as
a set of metrics used to quantify both the efficiency
and effectiveness of actions (Neely, Gregory and
Platts, 1995, 2005; Neely, 2005). Smith, Bester and
Moll (2014) proposed a method for quantifying
QMS performance by introducing metadata into
historical or current QMS internal audit data.
2 THEORETICAL FRAMEWORK
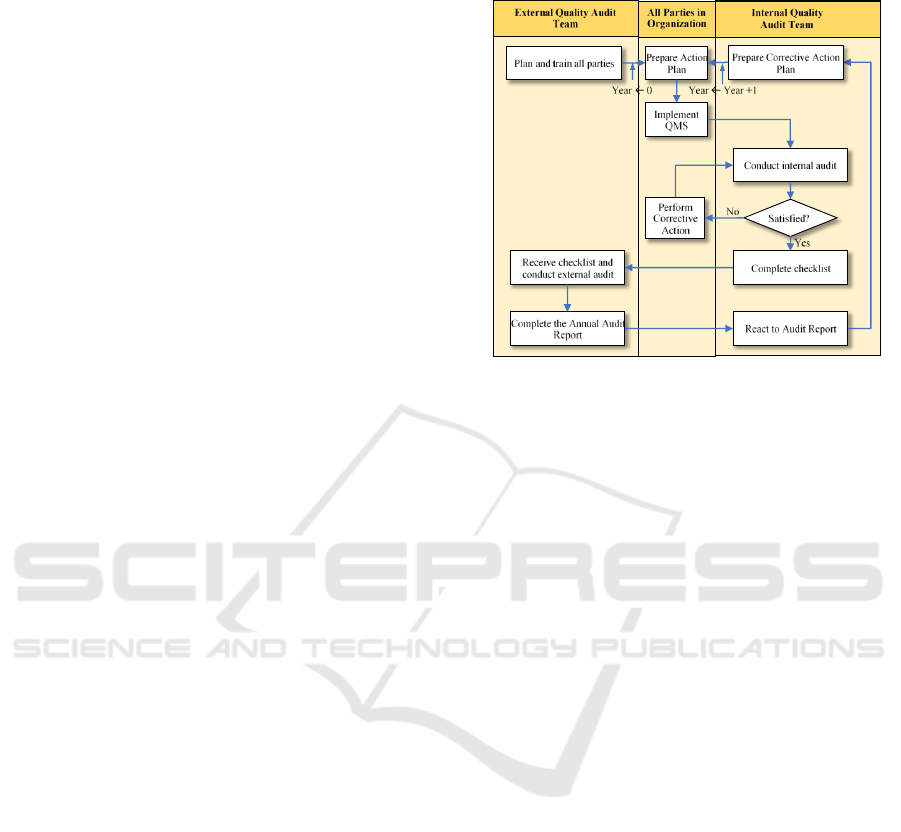
a. Quality Audit Process
The following definition is taken from the ISO
9011:2011 Guidelines for Auditing Management
Systems:
1. Audit is an efficient, free and recorded
procedure for acquiring review proof and
assessing it impartially to decide the degree to
which the review criteria are satisfied.
2. Audit evidence are records, statements of facts
or other data which are applicable to the audit
criteria and unquestionable. Audit evidence can
be subjective or quantitative.
3. Audit criteria are set of approaches, techniques
or prerequisites utilized as a source of
perspective against which audit evidence is
looked at. On the off chance that the audit
criteria are legitimate (counting statutory or
regulatory) prerequisites, the expressions
“compliant” or “noncompliant” are frequently
utilized in a audit findings.
Figure 1: Quality audit process diagram
4. Audit findings are results of the assessment of
the gathered audit evidence against audit
criteria. Audit findings demonstrate conformity
or nonconformity. Audit findings can prompt
the identification of opportunities for
development or recording good practices. On
the off chance that the audit criteria are chosen
from legal or other requirements, the audit
finding is named compliance or non-
compliance.
When all the audit data has been assembled
likewise, auditor should investigate and decide the
data, to be ordered in which category of audit
finding. In general, there are three types of audit
findings, i.e., Non-conformance (NC), Positive
Observation (PO) and Opportunity For Improvement
(OFI) (BSI-CEN, 2011).
1. Non-conformance (NC)
Non-conformance means any breakdown, or
partial breakdown of a process in the Quality
Management System (QMS). An audit non-
conformance typically requires:
a) Root cause analysis
b) Root cause elimination
c) Change to how the process is to be
performed
Non-conformance requires a Corrective Action
Request to document action taken. This type of
finding also known as a major non-conformance
or a systemic finding.
2. Positive Observation (PO)
Positive Observation implies any good deviation
from a generally all around actualized process
or minor oversight with respect to the auditee.
UNICEES 2018 - Unimed International Conference on Economics Education and Social Science
868

Underlying root cause analysis is not frequently
required for Observation. Observations might be
recorded on an Audit Action List.
3. Opportunity for Improvement (OFI)
OFI is a finding dependent on realities and data
that demonstrates a potential improvement
opportunity. Action is not required for OFI, but
more supporting data should be included to
encourage action by auditor.
b. Generating audit findings
Audit evidence ought to be assessed against the
audit criteria so as to decide audit findings. Audit
findings can demonstrate conformity or
nonconformity with audit criteria. When specified
by the audit plan, individual audit findings should
include conformity and good practices along with
their supporting evidence, opportunities for
improvement, and any recommendations to the
auditee.
Nonconformities and their supporting audit
evidence ought to be recorded. Nonconformities
might be reviewed. They ought to be looked into
with the auditee so as to acquire affirmation that the
audit evidencec is accurate, and that the
nonconformities are comprehended. Every attempt
should be made to resolve any diverging opinions
concerning the audit evidence or findings, and
unresolved points should be recorded. The audit
team should meet as expected to review the audit
findings at proper stages amid the audit.
c. CIPP Evaluation Model
CIPP is an abbreviation for Context, Input, Process
and Product. The CIPP Model for evaluation, that
was developed by Daniel Stufflebeam and
colleagues, is a comprehensive framework for
guiding formative and summative evaluations of
programs, projects, personnel, products, institutions,
and systems. The model originated in the late 1960s
to to help improve and achieve accountability for
U.S. inner-city school district reform project. It was
to address the limitations of traditional evaluation
approaches (Stufflebeam and Coryn, 2014). It
requires the evaluation of context, input, process and
product in judging a program’s value. CIPP is a
decision-focused approach to deal with evaluation
and stresses the orderly arrangement of data for
program management and operation.
Context evaluation is regularly alluded to as
needs assessment. It asks, “What needs to be done?”
and evaluates issues, resources, and openings inside
a characterized communities and environmental
context.
Input evaluation endorses an undertaking to
address the recognized needs. It asks, " How should
it be done? The aftereffect of the input evaluation
step is a venture intended to meet the recognized
needs.
Process evaluation oversees the project
implementation process. It asks, "Is it being done?"
and gives a progressing keep an eye on the project’s
implementation process. Essential goals of process
evaluation incorporate archiving the process and
giving input with respect to (a) the degree to which
the arranged activities are completed and (b)
regardless of whether modifications or amendments
of the plan are necessary. An extra purpose of
process evaluation is to survey the degree to which
members acknowledge and complete their jobs.
Product evaluation identifies and assesses project
outcomes. It asks, “Did the project succeed?” and is
similar to outcome evaluation. The purpose of a
product evaluation is to measure, interpret, and
judge a project’s outcomes by assessing their merit,
worth, significance, and probity. Its fundamental
purpose is to find out the degree to which the
necessities of the considerable number of members
were met.
d. ISO 9001 Quality Management System
(QMS)
The ISO 9000 series standards are the most
successful standard in ISO history because there is
over 1.1 million registrations with registrants in
almost 200 countries from all continents (Charlet,
2017).
A quality management system (QMS) is a lot of
approaches, procedures and techniques required for
planning and implementation (creation/develop-
ment/service) in the inside business area of an
association. ISO 9001 that was distributed by ISO
(International Organization for Standardization) is a
case of a Quality Management System.
The ISO 9000 family addresses to various parts
of quality management and contains a portion of
ISO's best known standards. This standards give
direction and devices to companies and
organizations who need to guarantee that their
products and services reliably meet customer’s
requirements, and that quality is reliably made
improved. ISO 9000 was first published in 1987 and
was based on the BS 5750 series of standards from
BSI that were proposed to ISO in 1979. Later an
updated version in 1994 was published.
With an end goal to address the changing needs
of its clients, ISO again refreshed its standard in
2000 and 2008 and again in 2015. The newest
version is known as ISO 9001:2015.
Quantifying the ISO 9001:2008 Quality Management System Audit Reports to Measure the Implementation Performance
869
ISO 9001 manages the requirements that
organizations wishing to satisfy the guideline must
satisfy. The standard covers eight clauses as follows.
1. Scope
2. Normative References
3. Terms and Definition
4. Quality Management System
5. Management Responsibility
6. Resource Management
7. Product Realization
8. Measurement, Analysis and Improvement.
e. Relationship between CIPP Model and ISO
9001:2008 QMS
Table 1: Relationship between CIPP Model and ISO
9001:2008 QMS
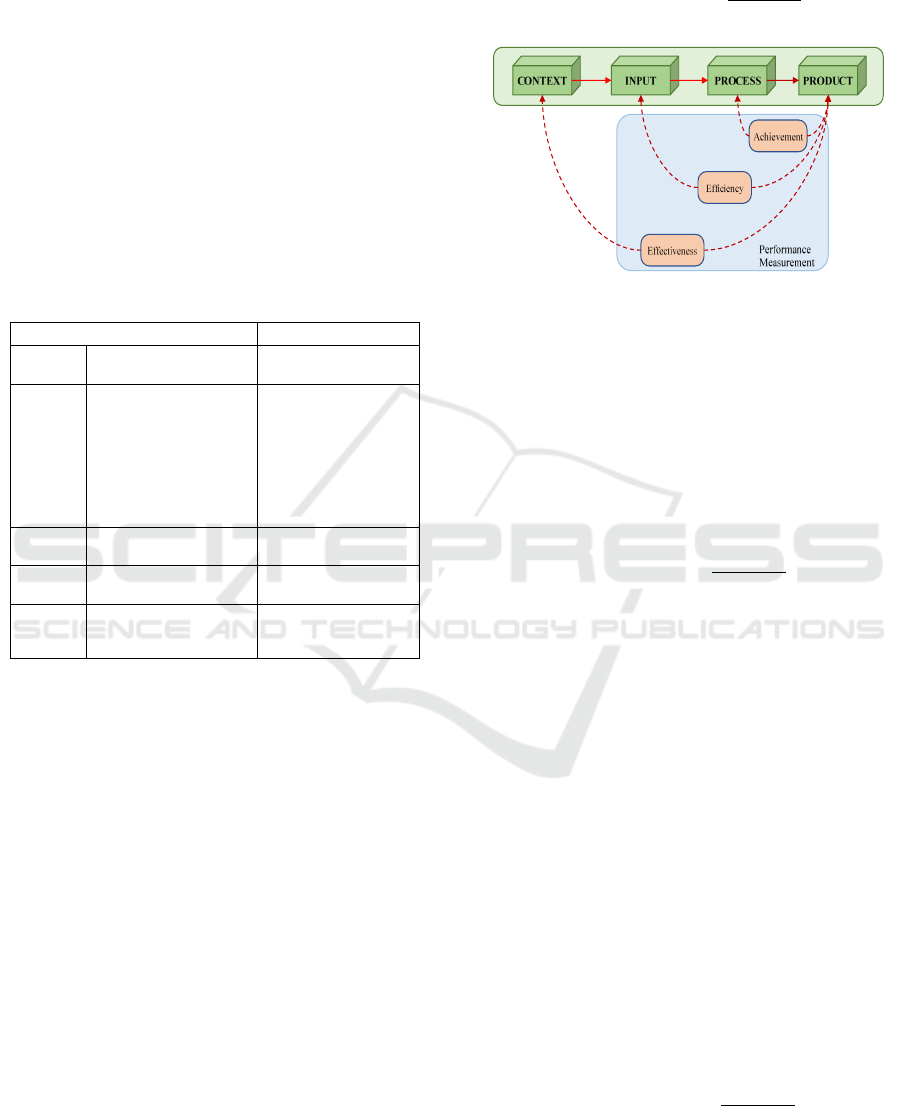
3 RESEARCH METHOD
Method to measure the performance of QMS
implementation is inspired from European
Commission, Tool #42: Identifying The Evaluation
Criteria And Questions (EU, 2015, p. 271).
1. Effectiveness (EU, 2015, p.271)
Effectiveness analysis considers how successful
QMS implementation has been in achieving or
progressing towards its objectives. The
evaluation should form an opinion on the
progress made to date and the role of the school
activity in delivering the observed changes.
On the off chance that the objectives have not
been accomplished, an assessment ought to be
gained of the degree to which ground has
missed the progress regarding the target and
what factors have impacted why something
hasn't been fruitful or why it has not yet been
accomplished.
!""#$%&'#(#))*
+,-./$%
0-(%#1%
Figure 2: Method to measure the performance of the
QMS Implementation using CIPP model.
Source: Inspired from European Commission, Tool #42:
Identifying The Evaluation Criteria And Questions, (Better
Regulation Toolbox as a complement to Better Regulation
Guidelines SWD-2015) p. 271
2. Efficiency
Effectiveness considers the connection between
the resources utilized by an intervention and the
progressions produced by this intervention
(which might be positive or negative).
!""&$&#($2*
+,-./$%
3(4/%
3. Achievement
According to Merriam-Webster Dictionary,
achievement means something that has been
done or achieved through effort, a result of hard
work, the act of achieving something, the state
or condition of having achieved or
accomplished something (https://www.merriam-
webster.com/dictionary/achievement).
Cambridge Dictionary characterizes
accomplishment as (1) something extremely
great and troublesome that you have prevailing
with regards to doing, (2) something that you
did or got subsequent to arranging and
attempting to get it going, and that in this way
gives you a feeling of fulfillment, or the
demonstration of attempting to get this going."
(https://dictionary.cambridge.org/dictionary/eng
lish/achievement). From the definitions above,
achievement can be regarded as a comparison
between product (i.e. “something that you did or
got”) and process (i.e. “the act of working”).
5$6&#'#7#(%*
+,-./$%
+,-$#))
CIPP
ISO 9001:2008 QMS
CIPP
Component
Typical questions for each
component
Requirement Clauses
Context
Needs assessment à “what
needs to be done?”
1. Scope
2. Normative References
3. Terms and Definition
4. Quality Management
System
5. Management
Responsibility
Input
Needs identification à “how
should it be done?”
6. Resource Management
Process
Process monitoring à”is it
being done?”
7. Product Realization
Product
Outcomes identification and
assesment à “did the project
succeed?”
8. Measurement, Analysis
and Improvement
UNICEES 2018 - Unimed International Conference on Economics Education and Social Science
870
4 ANALYSIS
a. Audit Findings
A list of audit findings for the period of 2010-2015
is given as follows.
Table 2: A complete list of Audit Findings 2010-
2015
Year
Cate-
gory
CIPP
Component
Number of Clause
Codes / Audit
Statements
2010
NC
Context
4 clause codes: 5.5.2 -
4.2.3.f - 4.1 - 5.5.3
NC
Input
3 clause codes: 6.3
NC
Process
1 clause codes:
7.2.1.d
NC
Product
3 clause codes: 8.2.4 -
8.3 - 8.2.2
2011
NC
Process
1 clause codes: 7.4.1
NC
Product
2 clause codes: 8.4 -
8.5.2
2012
NC
Context
3 clause codes: 5.6.2 -
5.4.2 - 4.2.4
NC
Process
2 clause codes: 7.5.1 -
7.4.1
NC
Product
1 clause codes: 8.5.2
OFI
Context
1 audit statement
OFI
Input
2 audit statements
OFI
Process
2 audit statements
OFI
Product
2 audit statement
PO
Process
1 audit statement
2013
NC
Context
1 clause codes: 4.2.4
NC
Product
1 clause codes: 8.2.1
OFI
Context
2 audit statements
OFI
Process
4 audit statements
PO
Context
1 audit statement
PO
Process
1 audit statement
PO
Product
5 audit statements
2014
NC
Process
1 clause codes: 7.2.3
OFI
Input
1 audit statement
OFI
Input
1 audit statement
OFI
Input
1 audit statement
PO
Context
1 audit statement
PO
Input
2 audit statements
PO
Process
2 audit statements
PO
Product
4 audit statements
2015
NC
Process
2 clause codes: 7.5.4 -
7.4.3
OFI
Input
12 audit statements
OFI
Product
7 audit statements
PO
Context
1 audit statement
Year
Cate-
gory
CIPP
Component
Number of Clause
Codes / Audit
Statements
PO
Input
1 audit statement
PO
Process
1 audit statement
PO
Product
4 audit statements
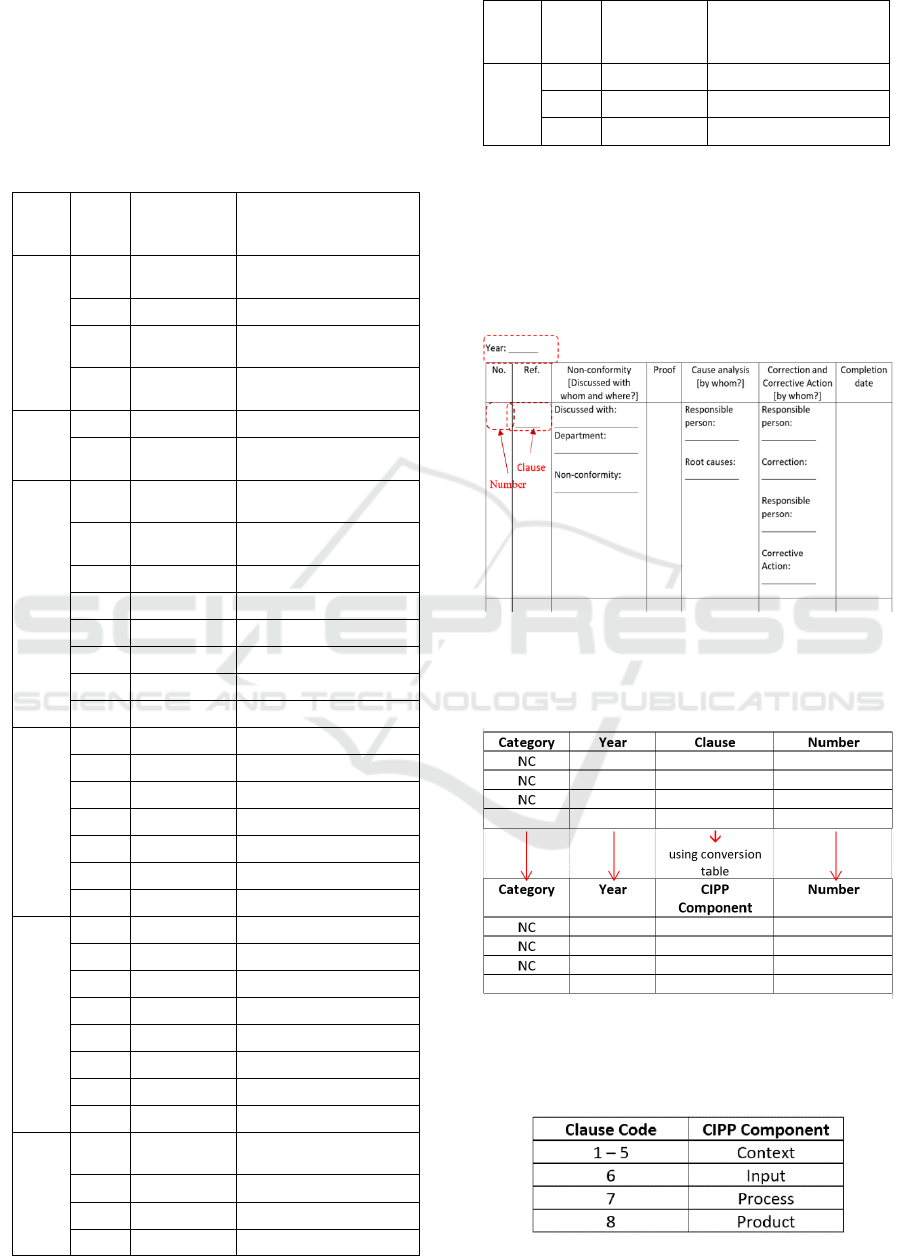
b. Analysis of Non-Conformity Findings
Table of Non-Conformity Findings is shown in the
following table. It consists of eight columns but only
three are taken as our data sources, i.e., Year,
Number and Clause References.
Table 3: Non-conformity Findings
The selected columns are then listed in the
following table of Audit Findings for NC that
consists of additional column, namely, Category
“NC."
Table 4: Audit Findings Attributes for NC
The relation between Clauses and CIPP
components can be seen in Table 1 above. The
following table shows such a relation.
Table 5: Conversion list from Clauses to CIPP
components
Quantifying the ISO 9001:2008 Quality Management System Audit Reports to Measure the Implementation Performance
871
Audit findings for category “NC” can then be
presented as a variable with four attributes, .i.e.,
category (=”NC”), year, CIPP component, and
number.
5/.&%89&(.&(:);9
<=>?@ABCDE
NC"
FC?=BF<AGHAI?I>FIJG
Where
year = 2010, 2011, ..., 2015
component = {“Context”, “Input”, “Process”,
“Product”}
num = 1, 2, 3, ...
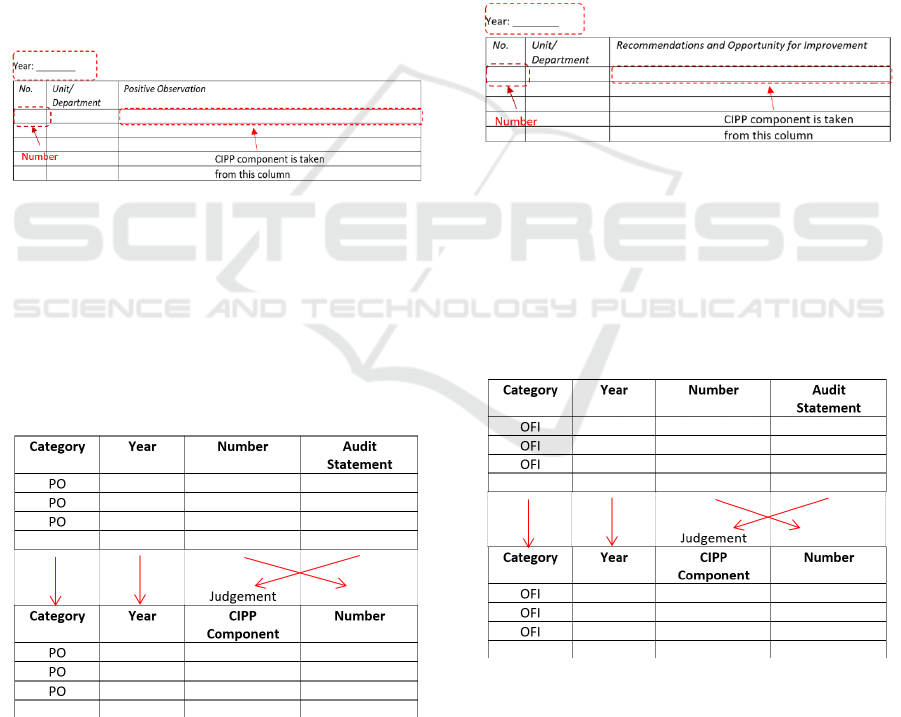
c. Analysis of Positive Observation Findings
Report of positive observation findings uses much
simpler table than that of Non-Conformity as shown
below.
Table 6: Report of Positive Observation findings
Column Positive Observation (PO) presents the
findings on good performance that has been
performed by a particular unit or department of the
School. The list of PO needs to be converted into
CIPP component in order to develop a variable of
Audit Findings. Unlike NC category that uses a
conversion table, the PO category asks for expert
judgement to convert the findings into CIPP
component. This is shown in the following table.
Table 7: Audit Findings Attributes for PO
Audit findings for category “PO” can then be
presented as a variable with four attributes, .i.e.,
category (=”PO”), year, CIPP component, and
number.
5/.&%89&(.&(:);9
<=>?@ABCDE
PO"
FC?=BF<AGHAI?I>FIJG
Where
year = 2010, 2011, ..., 2015
component = {“Context”, “Input”, “Process”,
“Product”}
num = 1, 2, 3, ...
d. Analysis of Opportunity for Improvement
(OFI) Findings
As mentioned in the previous section, OFI is a
finding based on facts and data that shows a
potential improvement opportunity. Action is not
required for OFI, but more supporting data should be
included to encourage action by auditor.
Table 8: Report of Opportunity for Improvement
(OFI) findings
Column OFI presents the findings on opportunity
to improve that is performed by a particular unit or
department of the School. The list of IFO needs to
be converted into CIPP component in order to
develop a variable of Audit Findings. Like the PO
category, the OFI alse asks for expert judgement to
convert the findings into CIPP component. This is
shown in the following table.
Table 9:Audit Findings Attributes for OFI
Audit findings for category “OFI” can then be
presented as a variable with four attributes, .i.e.,
category (=”OFI”), year, CIPP component, and
number.
5/.&%89&(.&(:);9
<=>?@ABCDE
OFI"
FC?=BF<AGHAI?I>FIJG
Where
UNICEES 2018 - Unimed International Conference on Economics Education and Social Science
872
year = 2010, 2011, ..., 2015
component = {“Context”, “Input”, “Process”,
“Product”}
num = 1, 2, 3, ...
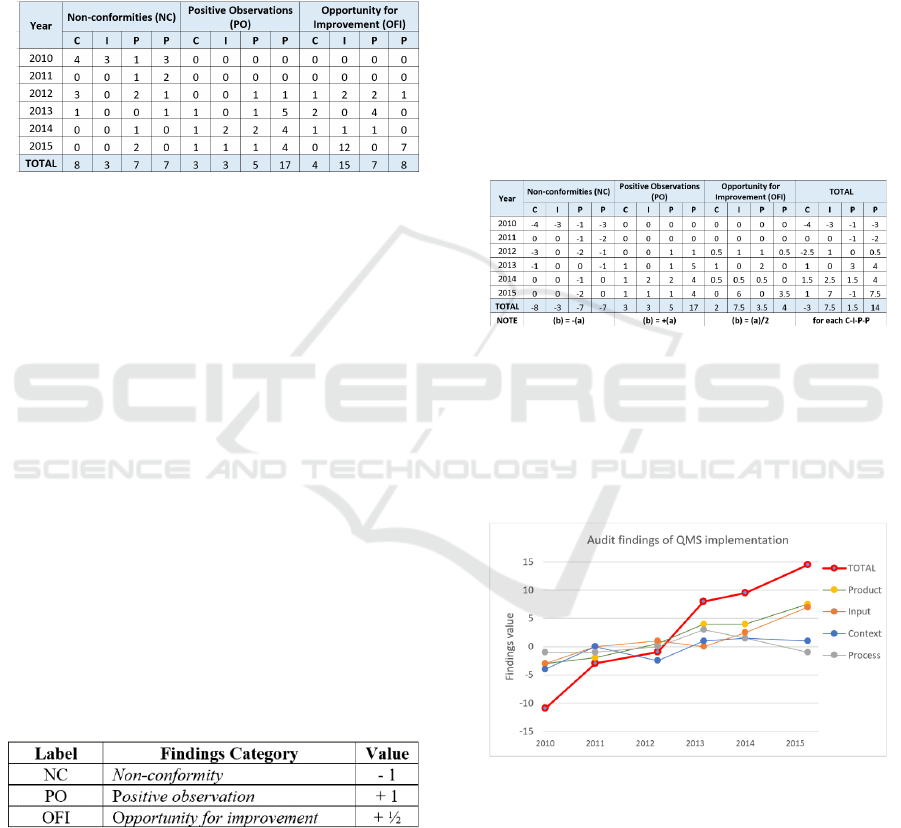
e. Scoring the Audit Findings
The above list then can be summarized as the
following table.
Table 10: Summary of the Audit Findings
K/L(%&%2;8K
C?=BF<=>?@ABCF<AGHAI?I>
888888*
M
9
<=>?@ABCFC?=BF<AGHAI?I>FIJG
IJG
Where
year = 2010, 2011, ..., 2015
category = {“NC”, “PO”, “OFI”}
component = {“Context”, “Input”, “Process”,
“Product”}
num = 1, 2, 3, ...
N
IJG
= count notation for num
The Category variable basically represents the
degree of achievement. NC for example denotes a
negative value since it represents any breakdown in
the QMS implementation. Contrast to PO, it shows a
positive one as it represents a good achievement. On
the other hand, OFI represents something in between
the two but a bit closed to PO but still needs to be
improved. Hence to represent such description we
can assign NC as -1, PO as +1 and OFI as +½ as
shown in the following table.
Table 11: Scoring of Category
Formula to assign values of the above category is
given as follows.
O,L()"-,7
<=>?@ABC
*
P
QR $L%#:-,2*ESTE
UR $L%#:-,2*EVWE
UX $L%#:-,2*EWYZE
Having this formula, the category as shown in
Table 11 can be transformed into scoring value
using the following formula.
[$-,#;88[
C?=BF<=>?@ABCF<AGHAI?I>
8888*O,L()"-,7
<=>?@ABC
\K
C?=BF<=>?@ABCF<AGHAI?I>
Also the Total Score is calculated as follows.
O-%L];8O
C?=BF<AGHAI?I>
888*
^
[
C?=BF<=>?@ABC F<AGHAI?I>
<=>?@ABC
The result can be found in the accompanying
table.
Table 12: Score of the Audit Findings
5 RESULTS
The above method and analysis is a good way to
transform the narrative audit findings into numerical
values and can be represented into the following
chart.
Figure 3: Audit findings of QMS implementation
using CIPP Model
Having such a method the main intention of the
research, i.e. to evaluate the QMS implementation of
Al Azhar BSD Islamic High School, can be easily
shown a good implementation progress for the
period of 2010-2015.
Quantifying the ISO 9001:2008 Quality Management System Audit Reports to Measure the Implementation Performance
873
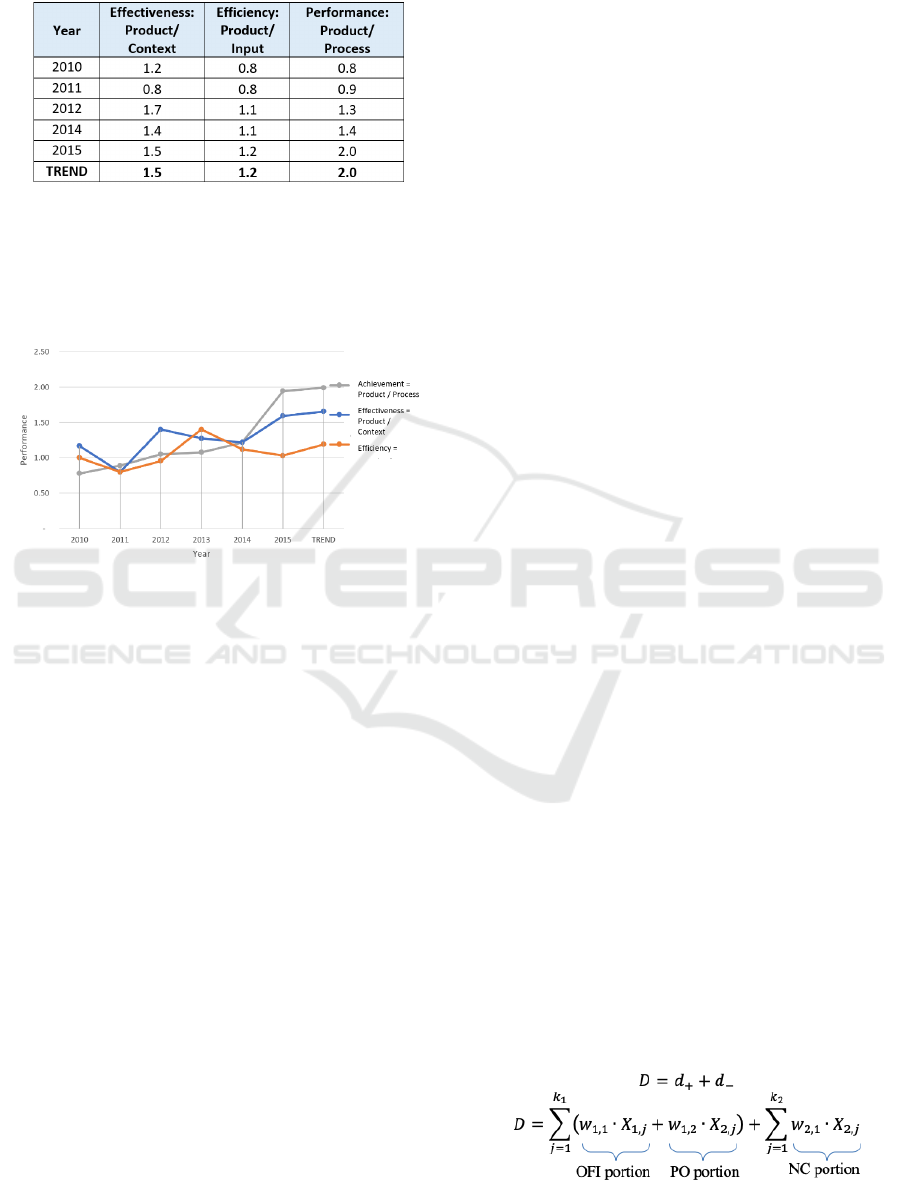
Table 13: Peformance measurement of QMS
implementation
Moreover, having the value of CIPP components
the QMS performance – represented by
effectiveness, efficiency and achievement – can be
calculated as shown in the above table. It then can be
represented in the following chart.
Figure 4: Chart of QMS peformance measurement
6 DISCUSSION
Attempts to quantify ordinal category data have been
going on for decades. The most widespread is the
attitude scale construction after Rensis Likert
published an article entitled "A Technique for the
Measurement of Attitude" in 1932 (in Jamieson,
2004; Chyung et al., 2017). Likert scale uses ordinal
values to differentiate people's attitudes toward a
given topic or a number of issues. The scale uses a
familiar five-point bipolar response format to
indicate how much they agree or disagree, approve
or disapprove, believe to be true or false, for
example, in the form of (1) Strongly disagree, (2)
Disagree, (3) Neither agree nor disagree, (4) Agree,
and (5) Strongly agree. Likert scale is in great
demand by many researchers.
A researcher, Edirisooriya (1997), has proposed
a different approach to attitude scale construction.
Surprisingly, his method is in favor with our
research. His formula of decision-making process –
as a representation of his/her attitude – that an
individual,
[
_
, utilizes can be presented as follows.
`
_
*"
a
b
c
d
*
e
.
_f
g
U
e
.
_h
g
where
`
_
= decision and it includes two components,
.
_f
and
.
_h
.
.
_f
= represents the sum of the weighted-positive
pieces of evidence
.
_h
= represents the sum of the weighted-negative
pieces of evidence
b
c
= a piece of evidence where j = 1, ..., k
1
(positive pieces of evidence) or k
2
(negative
pieces of evidence)
The general form of the component
.
_f
and
.
_h
in
the above equation can be expanded in the
following manner.
.
_f
*
^
i
jF_
a
Ub
c
d
k
l
_FcDj
where
i
jF_
= the amount of weight
m
n
attaches to a
positive piece of evidence, +
b
c
o
j
= the number of positive pieces of evidence.
and
.
_h
*
^
i
pF_
a
Qb
c
d
k
q
_FcDj
where
i
pF_
= the amount of weight
[
_
attaches to a
negative piece of evidence, –
b
c
o
p
= the number of positive pieces of evidence.
If we assign
i
jFj
= +½ to represent OFI findings,
i
jFp
= +1 to represent PO findings, and
i
pFj
= –1 to represent NC findings,
then in order to meet our method we remodify the
formula as follows.
.
f
*r9384-,%&-(U+r84-,%&-(
88*
^a
i
jFj
sb
jFc
Ui
jFp
sb
pFc
d
k
l
cDj
8
.
h
*t084-,%&-(*8
^
i
pFj
sb
pFc
k
q
cDj
Then we will have
UNICEES 2018 - Unimed International Conference on Economics Education and Social Science
874

Note that index i is ommited in the above
equation, since in this case
[
_
is only one individu or
precisely one party, i.e. the representative of external
auditor.
The Likert-like scale of our research, is between
- 1 to +1 to represent the conformance status of ISO
9001 QMS usage. The reason to assign such a range
is to allow negative (for NC) and positive (for OFI
and PO) values. Similar reason is also used by Başak
Manders (Manders, de Vries and Blind, 2016, p.
147) allowing respondents to report both negative
and positive changes in order to measure the
performance of QMS implementation that ranges
between -2 to +2 (e.g. a scale from -2 to 2; -2=Large
decrease; -1=Small decrease; 0=No change; 1=Small
increase; 2=Large increase). Other usage of Likert-
like scale is proposed by R.A. Smith, A. Bester and
M. Moll (2014) that employ different way to assign
the non-conformity of the QMS in order to quantify
QMS performance measure. According to them non-
conformity grade consists of rating value and safety
weight, where rating value is grouped into three
levels, i.e. Low = 0.3; Medium = 0.8; and High =1
and safety weight as Management = 0.3; Enabling =
0.6; and Core = 1.
On the contrary, Nikolay (2016) did not apply
Likert-like scale but rather the number of non-
conformity findings. Compare to our method, there
are at least two differences. Firstly, our method
regards three types of audit findings, i.e. NC, OFI
and PO whereas Nikolay uses NC only. Secondly,
Nikolay traces the number of resolved NCs with
allocated cost for implementing corrective actions.
Future research development may adopt
Nikolay’s method by taking into account the number
of NCs of the past period that have been resolved by
corrective actions. This method concern with all
corrective actions to address identified non-
conformities of the past period are carried out before
the start of the planning period.
REFERENCES
BSI-CEN (2011) BSI Standards Publication: Guidelines
for auditing management systems (ISO
19011:2011). Brussels.
Charlet, L. (2017) The ISO Survey, International
Organization for Standardization. Available at:
https://www.iso.org/the-iso-survey.html
(Accessed: 1 November 2018).
Cheng, Y., Lyu, J. and Lin, Y. (2004) ‘Education
Improvement through ISO 9000 Implementation :
Experiences in Taiwan’, International Journal of
Engineering Education, 20(1), pp. 91–95.
Chyung, Y. et al. (2017) ‘Evidence-Based Survey Design:
The Use of a Midpoint on the Likert Scale’,
Performance Improvement, 56(10), pp. 15–23.
doi: doi:10.1002/pfi.21727.
Edirisooriya, G. (1997) ‘A Different Approach to Attitude
Scale Construction’, in Annual Meeting of the
American Educational Research Association.
Chicago, IL: American Educational Research
Association, pp. 1–21. Available at:
https://files.eric.ed.gov/fulltext/ED410244.pdf.
EU (2015) ‘Toolbox: Tool #42: Identifying the evaluation
criteria and questions’, in Toolbox for Better
Regulation in SWD (2015) 111. European
Commission, pp. 271–277. doi:
10.1163/1571809042388581.
Fons, L. A. S. (2011) ‘Measuring economic effects of
quality management systems’, The TQM Journal,
23(4), pp. 458–474. doi:
10.1108/17542731111139527.
Jamieson, S. (2004) ‘Likert scales : how to (ab)use them’,
Medical Education, 38(12), pp. 1217–1218. doi:
10.1111/j.1365-2929.2004.02012.x.
Kenny (2011) ‘Performance measures in focus’, National
Accountant, (April-May), pp. 24–26.
Kenny, G. and Bourne, M. (2015) ‘Performance
Measurement’, in Cooper, C. L. (ed.) Wiley
Encyclopedia of Management. John Wiley &
Sons. doi: 10.1002/9781118785317.weom120139.
Manders, B., de Vries, H. J. and Blind, K. (2016)
‘Technovation ISO 9001 and product innovation :
A literature review and research framework’,
Technovation. Elsevier, 48(Feb 1), pp. 41–55. doi:
10.1016/j.technovation.2015.11.004.
Neely, A. (2005) ‘The evolution of performance
measurement research: Developments in the last
decade and a research agenda for the next’,
International Journal of Operations & Production
Management, 25(12), pp. 1264–1277. doi:
10.1108/01443570510633648.
Neely, A., Gregory, M. and Platts, K. (1995)
‘Performance measurement system design: A
literature review and research agenda’,
International Journal of Operations & Production
Management, 15(4), pp. 80–116. Available at:
https://doi.org/10.1108/01443579510083622%0A
Downloaded.
Neely, A., Gregory, M. and Platts, K. (2005)
‘Performance measurement system design: A
literature review and research agenda’,
Quantifying the ISO 9001:2008 Quality Management System Audit Reports to Measure the Implementation Performance
875

International Journal of Operations & Production
Management, 25(12), pp. 1228–1263. doi:
10.1108/01443570510633639.
Nikolay, I. (2016) ‘A Study on Optimization of
Nonconformities Management Cost in the Quality
Management System (QMS) of Small-sized
Enterprise of the Construction Industry’, Procedia
Engineering. The Author(s), 153, pp. 228–231.
doi: 10.1016/j.proeng.2016.08.107.
Phusavat, K. et al. (2009) ‘Performance measurement :
roles and challenges’, Industrial Management &
Data Systems, 109(5), pp. 646–664. doi:
10.1108/02635570910957632.
Rusjan, B. and Alic, M. (2010) ‘Capitalising on ISO 9001
benefits for strategic results’, International
Journal of Quality & Reliability Management,
27(7), pp. 756–778. doi:
10.1108/02656711011062372.
Smith, R. A., Bester, A. and Moll, M. (2014) ‘Quantifying
Quality Management System Performance in order
to Improve Business Performance’, South African
Journal of Industrial Engineering, 25(2), pp. 75–
95. Available at:
http://www.scielo.org.za/scielo.php?script=sci_artt
ext&pid=S2224-
78902014000200008&lng=en&tlng=en.%0AQUA
NTIFYING.
Stufflebeam, D. and Coryn, C. (2014) Evaluation Theory,
Models, and Applications. 2nd edn. New York:
Wiley.
UNICEES 2018 - Unimed International Conference on Economics Education and Social Science
876
