
Analysis of Factors Which are Able to Influence the Admittance of
BPJS Ketenagakerjaan Participants towards BPJSTK Mobile by
using Technology Acceptance Model 3 (TAM 3)
Suryaningsih
Magister of Management, Faculty of Economic and Business, Universitas Airlangga, Surabaya -Indonesia
Keywords: BPJSTK Mobile, Perceived Usefulness, Perceived Ease of Use, Intention to Use.
Abstract: Information and Technology are rapidly evolving along with the evolution or the development of an era.
BPJSTK Mobile is a service application intended for the participants as a form of expansion in BPJS
Ketenagakerjaan Program information services, a medium for complaints if any discrepancy status appears,
information regarding the total amount of salary and employee that can be accessed through smartphones.
However, the performance of BPJSTK Mobile service is considered poor, given that it is only providing
information of the employees at the Surabaya Darmo branch which amount are relatively lower than the
total amount of participants who have actually registered. This research aims to analyze factors which are
able to influence the admittance of BPJS Ketenagakerjaan participants at Surabaya Darmo Branch towards
BPJSTK Mobile by using Technology Acceptance Model 3 (TAM 3). Variables that are used in this study
are subjective norm, image, computer self-efficacy, computer/system anxiety, perceived usefulness,
perceived ease of use, and intention of use (IU). Respondents chosen for the research are laborers who have
not used the BPJSTK Mobile Application registered at BPJS Ketenagakerjaan of Surabaya Darmo branch.
The data are gathered directly by conducting the deployment of questionnaires to 150 respondents. The
sampling technique used in this research is incidental sampling. The result of the hypothesis test showed
that SN or subjective norm does not have any positive effect towards intention to use (IU) and image (IMG)
does not have any positive impact towards perceived usefulness (PU).
1 INTRODUCTION
The development and growth of Information and
Technology made many informational search
activities, which hold an important part in human’s
life, no longer be held conventionally. Humans only
need to make use of technologies like the internet to
be able to access various needed information from
various sources that are not limited by time and
distance, unlike when conventional technology was
still around and commonly found (Hong et al., 2002;
Ayele and Sreenivasarao, 2013). One of the forms
of information technology is the appearance of the
mobile service application that can be accessed via
mobile phones or smartphones. The application is
able to answer demands from customers who want
fast service, safety, comfort, cheapness, available at
any time (24/7), and able to be accessed from
everywhere through smartphones (Rahayu, 2015).
There are now many banks and insurance
agencies, commercial and social ones, that offer
mobile access to financial information, one of them
is BPJS Ketenagakerjaan that is BPJSTK Mobile.
BPJSTK Mobile is a service application intended for
the participants as a form of expansion to the
information service media of BPJS Ketenagakerjaan
program, medium to the complaint service regarding
status discrepancy of customers, and the total
amount of salary and employees that can be
accessed anywhere and anytime via smartphones.
BPJSTK Mobile service has many advantages
and is very beneficial for participants since its
launch in 2014, the socialization carried out has been
maximized and awareness is high. But when viewed
from the statistics of its usage at the Surabaya
Darmo Branch Office, where this research will be
conducted, that BPJSTK mobile service
performance for the number of participants utilizing
the mobile BPJSTK is relatively smaller or very low
than the total number of registered participants. The
798
Suryaningsih, .
Analysis of Factors Which are Able to Influence the Admittance of BPJS Ketenagakerjaan Participants towards BPJSTK Mobile by using Technology Acceptance Model 3 (TAM 3).
DOI: 10.5220/0009506707980804
In Proceedings of the 1st Unimed International Conference on Economics Education and Social Science (UNICEES 2018), pages 798-804
ISBN: 978-989-758-432-9
Copyright
c
2020 by SCITEPRESS – Science and Technology Publications, Lda. All rights reserved

number of participants registered at the Surabaya
Darmo Branch of BPJS Ketenagakerjaan until June
2017 was 108,101 workers with 2,438 companies.
Of the total 108,101 participants, only 20,587 or
19.04% of participants used or used BPJSTK
Mobile.
The problem of how participants can receive and
utilize the BPJSTK Mobile service can be explained
optimally using the TAM (Theory Acceptance
Model) framework. TAM is a model built to analyze
and understand the factors that influence the
acceptance of technology use (Davis, 1989). In
2008, Venkatesh and Bala conducted theoretical
development and testing of Technology Acceptance
Model 2 (TAM2) by identifying the determinants of
perceived ease of use (PEOU) developed by
Venkatesh in 2000 to become Technology
Acceptance Model 3 (TAM3) (Venkatesh and Bala,
2008). TAM3 examines more deeply the
determinants of user perceptions of perceived
usefulness and the user's perception of perceived
ease of use (Davis, 1989).
User Trust in the ease of use and usefulness of
new technologies is influenced by computer self-
efficacy. Users with high levels of computer self-
efficacy will find it easier to use a new information
technology (Hong et al., 2002).
Subjective norm is one of the variables of social
influence in the form of social pressure received to
do or not do something. It is very important to
determine how social influence influences the
commitment of users in utilizing information
systems to understand, explain, and predict
acceptance behavior and use of information systems
(Malhotra and Galletta, 1999).
Image is interpreted as someone's perception that
the use of innovation will improve their social status.
(Venkatesh and Davis, 2000) describe the large
impact of social influences (subjective norms, and
images) on technology acceptance. (Venkatesh et
al., 2003) assert that social influence is a direct
determinant of intention to use technology.
The use of technology usually has side effects, such
as negative emotions that increase not only during
interaction with technology but even before.
Frustration, confusion, anger, anxiety, and similar
emotions can affect the process of interaction with
technology (George Saadé and Kira, 2009).
Based on the description above, the formulation
of the problem will be compiled which will be
answered with this research, namely:
1. Does subjective norm (SN) have positive
effect(s) towards intention to use (IU).
2. Does subjective norm (SN) have positive
effect(s) towards perceived usefulness (PU).
3. Does image (IMG) have positive effect(s)
towards perceived usefulness (PU).
4. Does computer self-efficacy (CSE) have positive
effect(s) towards perceived ease of use (PEOU).
5. Does system anxiety (CANX) have positive
effect(s) towards perceived ease of use (PEOU).
6. Does perceived ease of use (PEOU) have
positive effect(s) towards perceived usefulness
(PU).
7. Does perceived ease of use (PEOU) have
positive effect(s) towards intention to use (IU).
8. Does perceived usefulness (PU) have positive
effect(s) towards intention to use (IU).
2 THEORICAL FRAMEWORK
The TAM 3 study was previously conducted by
Venkatesh and Bala in 2008 entitled Technology
Acceptance Model 3 and a Research Agenda on
Interventions. The results to be achieved in this
study are to present a research agenda that identifies
a set of interventions for researchers and
practitioners to investigate further about employee
acceptance and adoption of information technology
to be effective in a company. The results of this
study indicate that perceived ease of use has a
positive effect on perceived usefulness, perceived
ease of use has a positive effect on behavioral
intention, perceived usefulness has a positive effect
on behavioral intention and behavioral intention has
a positive effect on use behavior.
The similarity is also found in this study where
this study decided to use the Technology Acceptance
Model 3 (TAM 3) model to identify external factors
and perceived ease of use or perceived usefulness
that are most influential in using a technology. The
difference is that some variables are not used
because the variable is a research object that varies
and is adapted to the existing environment.
Furthermore, this study took the field of labor
regarding social security.
The following is the BPJSTK Mobile TAM 3
research model at the Surabaya BPJS
Ketenagakerjaan of Darmo Branch which will be
used by the researcher:
Analysis of Factors Which are Able to Influence the Admittance of BPJS Ketenagakerjaan Participants towards BPJSTK Mobile by using
Technology Acceptance Model 3 (TAM 3)
799
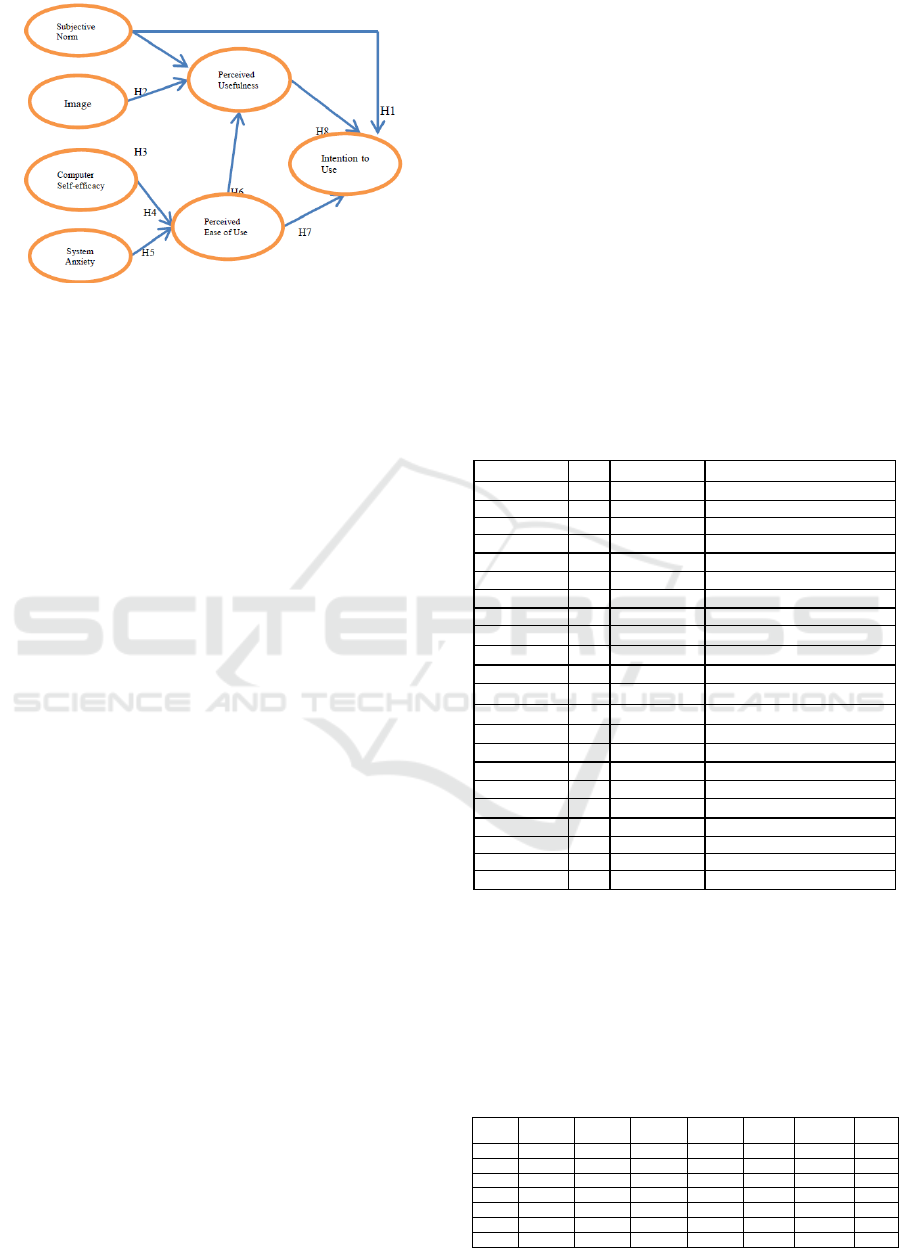
Figure 1: Research Model.
3 RESEARCH METHOD
The research method is classified as a type of
confirmatory research that aims to test or confirm
the hypothesized model (Sholihin, Mustafid and
Safitri, 2014). The type of data used in this study is
quantitative data. The source of data used in this
study is primary data which is the result of answers
from the questionnaire distributed to respondents.
Respondents in this study are workers who have
not used the BPJSTK Mobile application registered
at the BPJS Ketenagakerjaan of Surabaya Darmo
Branch. The determination of the number of
respondents for the analysis of Structural Equation
Modeling (SEM) is by using the formula of the
number of indicators from times 5 to 10 (Ferdinand,
2005). Because the number of indicators used in this
study is 22, then the minimum respondents for this
study are 110. Furthermore, Hair, in (Ferdinand,
2005) found that the size of respondents suitable for
SEM is between 100-200 samples. By referring to
the formula for determining the number of
respondents and opinions of Hair, the number of
respondents used in the study was 150 respondents.
The statistical analysis tool used to test
hypotheses is Structural Equation Modeling (SEM),
that is the reason as to why the structure or pattern of
relationships between a set of latent variables or
theoretical variables can be explained through one or
several indicator variables (Rizal, 2014). Data
processing is done using a software called AMOS
(Analysis of Moment Structure) version 24.
4 ANALYSIS
Based on the data of respondents' characteristics, it
was shown that male respondents were more than
female respondents, namely by the percentage of
males by 58.67%. When viewed from the age group,
the majority of respondents aged 26-35 years is
48.67%. Based on the respondents' education, it was
shown that the majority of respondents had an S1
degree (Strata One), which was 49.33%.
Convergent validity is a measure of construct
validity that shows that items or indicators of a latent
construct must converge or share (share) high
variance proportions. High loading values on a
factor (latent construct) indicate that they converge
at one point. Loading factors of variables SN, IMG,
CSE, CANX, PU, PEOU, and IU are all valued at ≥
0.5 so it can be concluded that all indicators used to
measure subjective norm variables, image, computer
self-efficacy, system anxiety, perceived usefulness,
perceived ease of use, and the intention to use are
declared valid and constitutes a unity of indicators
examined.
Table 1: Convergence Validity Test.
Indicators Variables Loading Factors Value
SN1 <--- SN 0,812
SN2 <--- SN 0,659
SN3 <--- SN 0,892
SN4 <--- SN 0,912
IMG1 <--- IMG 0,906
IMG2 <--- IMG 0,942
IMG3 <--- IMG 0,742
CSE1 <--- CSE 0,9
CSE2 <--- CSE 0,994
CSE3 <--- CSE 0,742
CANX1 <--- CANX 0,947
CANX2 <--- CANX 0,976
CANX3 <--- CANX 0,92
PU1 <--- PU 0,932
PU2 <--- PU 0,942
PU3 <--- PU 0,895
PEOU1 <--- PEOU 0,958
PEOU2 <--- PEOU 0,935
PEOU3 <--- PEOU 0,929
IU1 <--- IU 0,922
IU2 <--- IU 0,949
IU3 <--- IU 0,844
After the convergent validity is achieved, the
second validity test is done, namely discriminant
validity, which aims to test whether a construct is
completely different from other constructs. The
square root value of AVE has a higher value than the
correlation value between constructs. It can be said
that the measurement model has met discriminant
validity.
Table 2: Discriminant Validity Test.
IMG SN CSE CANX PU UI PEOU
IMG
0.825
SN
0.414
0.868
CSE
0.074 0.348
0.885
CANX
0.123 -0.210 -0.207
0.948
PU
0.214 0.652 0.415 -0.325
0.923
UI
0.093 0.567 0.376 -0.446 0.833
0.906
PEOU
0.114 0.510 0.325 -0.369 0.701 0.682
0.941
UNICEES 2018 - Unimed International Conference on Economics Education and Social Science
800

In SEM analysis, the reliability of the model is
examined using construct reliability. A model is said
to be reliable when the construct reliability value of
each variable/construct is more than 0.7 (Solimun,
2002). (Ghozali, 2017) describe the rule of thumb
the value of construct reliability must be > 0.70.
AMOS calculation’s result for testing construct
reliability shows that the variables/constructs of the
study consist of subjective norm, image, computer
self-efficacy, system anxiety, perceived usefulness,
perceived ease of use, and intention to use has a
value of construct reliability > 0.70. Based from the
above, it is concluded that these variables are
reliable in developing the model developed in this
study.
Hypothesis testing is conducted to determine
whether exogenous variables on endogenous
variables and endogenous variables on endogenous
variables are affecting one another. The hypothesis
is stated acceptable if the value of prob (P) < 0.05.
There are 2 rejected hypothesis, H1 and H3, while
H2, H4, H5, H6, H7 and H8 are all accepted.
Table 3: Hypothesis Test.
Hypothesis Causality Relation Estimate S.E. C.R. P Label Information
H1 SN ---> IU .025 .062 .400 .689 par_16 Rejected
H2 SN ---> PU .391 .073 5.351 * ** par_ 18 A dmitted
H3 IMG ---> PU -.028 .077 -.360 .719 par_19 Rejected
H4 CSE ---> PEOU .321 .096 ,3335 *** par_21 Admitted
H5 CANX ---> PEOU -.311 .076 -4.074 *** par_22 Admitted
H6 PEOU ---> PU .550 .074 7.434 * ** par_ 23 A dmitted
H7 PEOU ---> IU .194 .074 2.610 .009 par_20 Admitted
H8 PU ---> IU .623 .086 7.235 *** par_17 Admitted
5 RESULTS
H1: Subjective norm (SN) has positive impact(s)
towards intention to use (IU)
Based on data from the results of data processing, it
is known that the P value (probability) is 0.689.
These results do not meet the requirements of < 0.05
so that it can be concluded that H1 in this study was
not accepted/rejected. This is not in line with Park's
study which states that subjective norms influence
both behavioral intentions and attitudes towards e-
learning (Park, 2009). (Jimantoro and Tjondro,
2014) state that subjective norms (subjective norms)
do not have a significant effect on the intention of
taxpayers in the use of e-filling (intention to use e-
filing). This means that the social environment such
as friends, family, and superiors in the company
have no effect on participants' intention to use the
BPJSTK Mobile application. The intention of the
participants to use the BPJSTK Mobile application is
because of their awareness of the importance of
using BPJSTK Mobile.
H2: Subjective norm (SN) has positive impact(s)
towards perceived usefulness (PU)
Based on the results of data processing, it is known
that the P value (probability) is 0,000. These results
meet the requirements of < 0.05 so it can be
concluded that H2 in this study can be accepted.
This is consistent with Park's study which states that
subjective norms can affect the usefulness of e-
learning to users (Park, 2009). Fang Xu's study also
states that subjective norms have a positive influence
on the usefulness of the MOOC (Massive Open
Online Courses) (Xu, 2015). This means that the
social environment such as friends, family, and
employers in the company has an influence on
participants' perceptions of the benefits of the
BPJSTK Mobile application. Participants will
consider the BPJSTK Mobile application useful if
the social environment is the same.
H3: Image (IMG) has positive impact(s) towards
perceived usefulness (PU)
Based on the results of data processing, it is known
that the P value (probability) is 0.719. These results
do not meet the requirements of < 0.05 so it can be
concluded that H3 in this study was not accepted.
This is not in line with Fang Xu's research which
states that image has a positive influence on the
usefulness of the MOOC (Massive Open Online
Courses) (Xu, 2015). But in line with Ying Wu's
research on user acceptance of the Web 2.0 website
which states that the image has no positive effect on
perceived usefulness (Wu et al., 2011). This means
that the social status does not affect participants'
perceptions about the usefulness of the BPJSTK
Mobile application, even though the use of the
BPJSTK Mobile application does not improve social
status both in the work environment and other social
environments, they still consider BPJSTK Mobile
useful.
H4: Computer self-efficacy (CSE) has positive
impact(s) towards perceived ease of use
(PEOU)
Based on the results of data processing, it is known
that the P value (probability) is 0,000. These results
meet the requirements of < 0.05 so that it can be
concluded that H4 in this study can be accepted.
This study proves that the higher the level of trust of
participants in the ability to use the BPJSTK Mobile
application, the easier the use of BPJSTK Mobile.
This is in line with Fang Xu's research which states
Analysis of Factors Which are Able to Influence the Admittance of BPJS Ketenagakerjaan Participants towards BPJSTK Mobile by using
Technology Acceptance Model 3 (TAM 3)
801

that computer self-efficacy has a positive influence
on the ease of use of MOOC (Massive Open Online
Courses) (Xu, 2015). After participants are
convinced of their ability to use the BPJSTK Mobile
application, participants will get the ease of
downloading and using the BPJSTK Mobile
application without having to drain their energy and
mind, this is also consistent with the research
conducted by Park (2009). Through the BPJSTK
Mobile application, participants can check fast and
accurate online old-age (JHT) balances, calculate the
Old Age Guarantee (JHT), Pension Insurance
simulation (JP), get program and Co-Marketing
information, branch office information, central
information service and social media, and complaint
services.
H5: System anxiety (CANX) has negative
impact(s) towards perceived ease of use
(PEOU)
Based on the results of data processing, it is known
that the P value (probability) is 0,000. These results
meet the requirements of < 0.05 so that it can be
concluded that H5 in this study can be accepted.
This is in line with the research of Saade and Kira
which states that computer/system anxiety has a
significant influence on perceived ease of use from
the use of LMS technology (Learning Management
System) (George Saadé and Kira, 2009). Celik's
study of consumer acceptance of online retail
shopping states that anxiety has a negative influence
on perceived ease of use (Çelik, 2011). This means
that if the level of anxiety, concern or even fear of
the participants when faced with the possibility of
using the BPJSTK Mobile application increases,
their perception of the ease of using BPJSTK Mobile
will decrease
H6: Perceived ease of use (PEOU) has positive
impact(s) towards perceived usefulness
(PU)
Based on the results of data processing, it is known
that the P value (probability) is 0,000. These results
meet the requirements of < 0.05 so that it can be
concluded that H6 in this study can be accepted. The
ease of using the BPJSTK Mobile application and
obtaining the information needed in connection with
participation in the BPJS Employment provides
usefulness in the use of the BPJSTK Mobile
application by participants. This is in line with the
research of Venkatesh and Davis that perceived ease
of use can affect perceived usefulness because the
more easily a technology is used, the more useful the
technology is (Venkatesh and Davis, 2000). (Igbaria
and Chakrabarti, 1990) explains in his research that
perception has an impact on individual behavior.
This is explained in more detail that the greater the
individual has the perception of ease in using a new
system, it will lead to an increase in the use of
information technology. Through the BPJSTK
Mobile application participants can access JHT and
JP balances and calculation simulations, complaint
services, information on the BPJS Ketenagakerjaan
branch office, as well as other information regarding
the BPJS Ketenagakerjaan program anytime and
anywhere via a smartphone without having to come
to the office of BPJS Ketenagakerjaan. With a little
skill and internet access, participants can find the
information they need without wasting time so
participants will feel the use of the BPJSTK Mobile
application will be very useful in increasing the
productivity of their effectiveness.
H7: Perceived ease of use (PEOU) has positive
impact(s) towards intention to use (IU)
Based on the results of data processing, it is known
that the P value (probability) is 0.009. These results
meet the requirements of < 0.05 so that it can be
concluded that H7 in this study can be accepted.
This study proves that the easier use of the BPJSTK
Mobile application, the higher the intention to use it.
In line with Park's research, perceived ease of use
has a significant direct effect on intention and
behavior using e-learning (Park, 2009). Cheng's
study states that perceived ease of use will
encourage the use of e-resources (Cheng, 2014). To
use the BPJSTK Mobile application, participants
simply download it on the Play Store via
smartphone. Then, in the initial display, there are
instructions and guidelines for using BPJSTK
Mobile so that participants will not have difficulties.
When the BPJSTK Mobile service makes it easy for
users to download and search for the required
information, the participants' intention to use Mobile
BPJSTK will also increase.
H8: Perceived usefulness (PU) has positive
impact(s) towards intention to use (IU)
Based on the results of data processing, it is known
that the P value (probability) is 0,000. These results
meet the requirements of < 0.05 so that it can be
concluded that H8 in this study can be accepted. In
line with Park's study, perceived usefulness has a
significant direct effect on intention and behavior
using e-learning (Park, 2009). Cheng's study states
that someone who has a perception that using e-
resources will bring benefits to him, and of course
will affect the intention to use it (Cheng, 2014).
UNICEES 2018 - Unimed International Conference on Economics Education and Social Science
802

TAM states that the factor of user's perception of
perceived usefulness is believed to be the basis for
determining the acceptance and use of various
information technologies (Handayani, Kusrini and
Sunyoto, 2013). Through the BPJSTK Mobile
application, participants are going to be able to
check quickly and accurately regarding online old
age (JHT) balance, simulation of Old Age Insurance
(JHT) calculation, Pension Guarantee simulation
(JP), Program Information and Co-Marketing
information, branch office information, central
information service, and social media, as well as
complaints service, so that participants feel very
helped by the existence of this application.
Therefore, it will make the perception of usefulness
and usefulness of the BPJSTK Mobile application
becomes a factor that influences participants'
intention to use BPJSTK Mobile.
6 CONCLUSIONS
Based on the results of the research and discussion
in the previous chapter, the conclusions obtained
from this study are as follows:
1. The H1 hypothesis which states that subjective
norm positively influences intention to use is not
accepted
2. The H2 Hypothesis which states that subjective
norm positively influences perceived usefulness
is accepted.
3. The H3 Hypothesis which states that image
positively influences perceived usefulness is not
accepted
4. The H4 Hypothesis which states that computer
self-efficacy positively influences perceived ease
of use is accepted
5. The H5 Hypothesis which states that system
anxiety negatively influences perceived ease of
use is accepted
6. The H6 Hypothesis which states that perceived
ease of use positively influences perceived
usefulness is accepted
7. The H7 Hypothesis which states that perceived
ease of use positively influences intention to use
is accepted
8. The H8 Hypothesis which states that perceived
usefulness positively influences intention to use
is accepted.
Based on the conclusions above, some suggestions
can be given as follows:
1. The researcher hopes that further research will be
carried out related to the TAM technology
acceptance model, especially mobile application
technologies with the use of different variables,
such as job relevance.
2. Future research will be conducted qualitatively,
namely by taking primary data not only by
questionnaire but by field observations and direct
interviews with respondents so that the results of
the analysis are comprehensive.
3. This study proves that perceptions of usefulness
and perceived ease of use have a positive effect
on the intention to use BPJSTK Mobile.
Therefore, BPJS Ketenagakerjaan should be able
to add new features that are useful and easy to
use on the BPJSTK Mobile application.
Additionally, the institution should be willing to
further promote BPJSTK Mobile in terms of
perceived benefits and convenience, so that more
participants are willing to be using the BPJSTK
Mobile application.
REFERENCES
Ayele, A. A. and Sreenivasarao, V. (2013) ‘A Case Study
of Acceptance and Use of Electronic Library Services
in Universities Based on SO-UTAUT Model’,
International journal of innovative researche in
computer ans communication engineering. doi:
10.1016/j.revmed.2013.03.311.
Çelik, H. (2011) ‘Influence of social norms, perceived
playfulness and online shopping anxiety on customers’
adoption of online retail shopping: An empirical study
in the Turkish context’, International Journal of Retail
& Distribution Management. doi:
10.1108/09590551111137967.
Cheng, Y. M. (2014) ‘Why do users intend to continue
using the digital library? An integrated perspective’,
Aslib Journal of Information Management. doi:
10.1108/AJIM-05-2013-0042.
Davis, F. D. (1989) ‘Perceived Usefulness, Perceived Ease
of Use, and User Acceptance of Information
Technology’, MIS Quarterly. doi: 10.2307/249008.
Ferdinand, A. (2005) Structural Equation Modeling dalam
Penelitian Manajemen, Aplikasi Model-model Rumit
dalam Penelitian untuk Tesis Magister dan Disertasi
Doktor. Semarang: Badan Penerbit Universitas
Diponegoro.
George Saadé, R. and Kira, D. (2009) ‘Computer Anxiety
in E-Learning: The Effect of Computer Self-Efficacy’,
Journal of Information Technology Education:
Research, 8, pp. 177–191. doi: 10.1007/s00595-010-
4394-x.
Ghozali, I. (2017) Model Persamaan Struktural Konsep
dan Aplikasi dengan program AMOS 24 Update
Bayesian SEM. Semarang: Badan Penerbit Universitas
Diponegoro.
Analysis of Factors Which are Able to Influence the Admittance of BPJS Ketenagakerjaan Participants towards BPJSTK Mobile by using
Technology Acceptance Model 3 (TAM 3)
803

Handayani, T., Kusrini and Sunyoto, A. (2013) ‘Analisis
Penerimaan Sistem Informasi Akademik Berbasis
Web Mengunakan Technology Acceptance Model
(TAM) Dan Usability (Studi Kasus Pada STTNAS
Yogyakarta)’, Prosiding Seminar Nasional Rekayasa
Teknologi Industri dan Informasi, 5(1), pp. 63–74.
Available at:
https://journal.sttnas.ac.id/ReTII/article/view/120.
Hong, W. et al. (2002) ‘Determinants of user acceptance
of digital libraries : An empirical examinati ...’, 18(3),
pp. 97–124.
Igbaria, M. and Chakrabarti, A. (1990) ‘Computer anxiety
and attitudes towards microcomputer use’, Behaviour
and Information Technology. doi:
10.1080/01449299008924239.
Jimantoro, C. and Tjondro, E. (2014) ‘Analisis Niat
Penggunaan E-Filing di PT “X” dan PT “Y” Surabaya
Dengan Structural Equation Modeling’, Tax &
Accounting Review, 4(2), pp. 1–8.
Malhotra, Y. and Galletta, D. F. (1999) ‘Extending the
technology acceptance model to account for social
influence: theoretical bases and empirical validation’,
Proceedings of the 32nd Annual Hawaii International
Conference on Systems Sciences. 1999. HICSS-32.
Abstracts and CD-ROM of Full Papers, 00(c), p. 14.
doi: 10.1109/HICSS.1999.772658.
Park, S. Y. (2009) ‘An analysis of the Technology
Acceptance Model in understandind university
student’s behavioral intention du use e-learning’,
12(3), pp. 150–162. doi: 10.1007/s00340-009-3513-0.
Rahayu, I. S. (2015) ‘Minat Nasabah Menggunakan
Mobile Banking dengan Menggunakan Kerangka
Technology Acceptance Model (TAM)’, Jurnal
Ekonomi Syariah Indonesia, V(2).
Rizal, A. (2014) ‘Analisis Penerapan Project Management
Information System (PMIS) Menggunakan Metode
Technology Acceptance Model (TAM) Studi Kasus
PT. INDOSAT, Tbk’, Jurnal Telekomunikasi dan
Komputer, 1, pp. 1–24.
Sholihin, I., Mustafid and Safitri, D. (2014) ‘ANALISIS
FAKTOR KONFIRMATORI STRATEGI
POSITIONING PASAR MODERN INDOMARET
(Studi Kasus Wilayah Tembalang Kota Semarang)’,
JURNAL GAUSSIAN, 3(3), pp. 431–440. doi:
10.1007/s00204-009-0425-z.
Solimun (2002) Multivariate Analysis Structural Equation
Modelling (SEM) Lisrel dan Amositle. Malang:
Fakultas MIPA, Universitas Brawijaya.
Venkatesh et al. (2003) ‘User Acceptance of Information
Technology: Toward a Unified View’, MIS Quarterly.
doi: 10.2307/30036540.
Venkatesh, V. and Bala, H. (2008) ‘Technology
acceptance model 3 and a research agenda on
interventions’, Decision Sciences. doi: 10.1111/j.1540-
5915.2008.00192.x.
Venkatesh, V. and Davis, F. (2000) ‘A Theoretical
extension of the technology acceptance model: four
longitudinal field studies’, Management Research
Review. doi: 10.1287/mnsc.46.2.186.11926.
Wu, M. et al. (2011) ‘TAM2 Based Study of Website User
Behavior’, 8(4), pp. 133–151. doi:
10.1628/001522105776072771.
Xu, F. (2015) ‘Research of the MOOC Study Behavior
Influencing Factors’, International Conference on
Advanced Information and Communication
Technology for Education, 11(Icaicte), pp. 18–22. doi:
doi:10.2991/icaicte-15.2015.5.
UNICEES 2018 - Unimed International Conference on Economics Education and Social Science
804
