
Effect of Customer Value and Experiential Marketing to
Customer Loyalty with Customer Satisfaction as Intervening
Variable: Case Stud
y
on Go-Jek Makassar Consumers
Rahmat Riwayat Abadi
1
, Idayanti Nursyamsi
1
and Musran Munizu
1
1
Faculty of Economics and Business, Universitas Hasanuddin, Makassar-Indonesia
Keywords: Customer Value, Experiential Marketing, Customer Satisfaction, and Customer Loyalty
Abstract: The Effect of Customer Value and Experiential Marketing on Customer’s Loyalty with Customer’s
Satisfaction as Intervening Variable: A Case Study on GO-JEK Consumers in Makassar. The research
aimed to examine and analyze the effect of customer value and experiential marketing on consumer’s
loyalty with consumer’s satisfaction as intervening variable. The analysis units were the users of GO-JEK
transportation service in Makassar City. The sample consisted of 172 respondents selected using accidental
sampling method. The data were obtained using questionnaires. They were analyzed using Structural
Equational Modeling (SEM) processed with AMOS version 22 program. The results of the research indicate
that customer value significantly affects costumer’s satisfaction and loyalty. Experiential marketing
significantly affects costumer’s satisfaction and loyalty. Costumer’s satisfaction significantly affects
costumer’s loyalty. Customer value and experiential marketing significantly affects costumer’s loyalty
through costumer’s satisfaction. Costumer’s satisfaction and loyalty is more influenced by experiential
marketing compared to customer value.
1 INTRODUCTION
The rapid development of technology has created a
new digital era. The rapid growth in computer
technology, telecommunications, information,
transportation and other technologies has had a
major impact on how companies deliver value to
customers (Kotler and Armstrong, 2008: 28). The
presence of online application technology on
smartphones based on Android, iOS, or Windows
has brought significant changes in various aspects,
both in terms of aspects of life, social, economic,
and not least in the aspect of transportation.
PT. GO-JEK Indonesia is a transportation service
company that use a motorbike and car almost all of
Indonesia's coverage areas. GO-JEK is one of the
transportation providers that presents solutions for
the society, because GO-JEK has an application
system that is easy to use because in one application
there are various services in it. The main services of
GO-JEK include, Go-Ride, Go-Car, Go-Mart, Go-
Send, Go-Clean, Go-Massage, and Go-Tix, etc.
Now, GO-JEK has been operating in the areas of big
cities such as Jakarta, Bandung, Surabaya, Bali,
Makassar, etc.
Targeting, acquiring, and retaining the customers
is the core of many successful companies. The
importance of carefully focusing on loyal and
desirable customers in selected segments and how to
build and maintain their loyalty through a
relationship marketing strategy. The aim is to build
relationships and bring loyal customers who will
continue to use company services in the future
(Lovelock et al., 2010: 76).
Transportation industry depend on services such
as GO-JEK, it is very likely that consumers will
move to other service providers for certain reasons.
These reasons need to be anticipated by the
company to determine the strategy, because the key
to the company still exist in the competitive
competition to maintain the customers. Therefore,
companies need to create value and experience when
customers use these products and services.
The progress of online transportation in
particular GO-JEK is not on one’s own, now there
are competitors who are trying to providing service
Abadi, R., Nursyamsi, I. and Munizu, M.
Effect of Customer Value and Experiential Marketing to Customer Loyalty with Customer Satisfaction as Intervening Variable: Case Study on Go-Jek Makassar Consumers.
DOI: 10.5220/0009505107670774
In Proceedings of the 1st Unimed International Conference on Economics Education and Social Science (UNICEES 2018), pages 767-774
ISBN: 978-989-758-432-9
Copyright
c
2020 by SCITEPRESS – Science and Technology Publications, Lda. All rights reserved
767

using different marketing techniques to be able to
reach the hearts of consumers, now present in
Makassar, that is GRAB and UBER.
Companies are competing to provide excellent
service for consumers, because then consumers will
feel satisfaction and can encourage these customers
to be loyal. However, in reality there are only
shortcomings that arise regarding the online-based
transportation system. Complaints also vary, ranging
from the application system itself, as well as from
partners (drivers).
In business, loving customers means achieving
their loyalty by high values and touching their
feelings and souls. Moreover, consumers want
products that can really make them happy and be
suited their lifestyle, and provide great experience.
In intense competition, the service business must
begin to look at the application of experiential
marketing, which provides emotional experiences
that are unique, positive, and impressive to
customers (Alma, 2007: 265).
However, customers are not just loyal to the
companies. We need to create value for them to be
faithful. Research has proven that relationships can
produce value for individuals through factors such as
providing greater confidence, offering benefits, and
special treatment (Lovelock et al., 2010: 78).
2 THEORICAL FRAMEWORK
Zeithaml (1988) says that customer value is an
evaluation of the benefits of a product or service
perceived by customers compared to what the
customer has issued to obtain the product or service.
The customer value concept gives consumers an idea
about the company, considers what they want, and
believes that they get benefits from a product
(Woodruff, 1997).
The customer estimates which offer will deliver
the highest value and act on that estimate. Whether
or not an offer is expected to affect customer
satisfaction and the dimensions of the probability
that the customer will use or buy another product or
service (Kotler and Keller, 2009: 136). Customer
value refers to a company's ability to create and add
value to goods and services, especially for the
services they offer to customers or aspects of their
business services (Johnson and Weinstein in
McFarlane, 2013). Basically customer value consists
of 4 parts, namely: (1) service, (2) quality, (3)
image, and (4) price.
Experiential marketing can be useful for a
company that wants to improve a brand to improve
brands that are in a decline, differentiate their
products from competing products, create an image
and identity for a company, increase innovation and
persuade customers to try and buy the products
(Maghnati et al, 2012). According of experiential
marketing, Bernd Schmitt in Zena and Hadisumarto
(2012), said: to determine marketing of satisfaction,
delivery of solutions, problems, or benefits is still
too narrow. The higher perceived experiential
marketing, the higher customer satisfaction is felt
(Lee et al., 2011).
Gentile et al. (2007) differentiate six experiential
components, such as the following: (1) sensory, (2)
emotional, (3) cognitive, (4) pragmatic, (5) lifestyle,
and (6) relational. According to Schmitt in Alkilani
et al. (2013), Experiential Modules (SEMs) describe
five types of customer experience that are the basis
of experiential marketing, the five types are sense,
feel, think, act, and relate.
Customer satisfaction depends on performance of
the product's assumptions to the buyer's
expectations. If product performance does not meet
expectations, customers are disappointed. If product
performance is due with expectations, customers are
satisfied. If performance exceeds expectations,
customers are very satisfied (Kotler and Armstrong,
2008: 16). There are many benefits to the company
from a high level of customer satisfaction. This can
increase customer loyalty and churn customer move,
reduce customer price sensitivity, reduce failed
marketing costs and create new customers, reduce
operating costs due to an increase in the number of
customers, increase advertising effectiveness, and
improve business reputation (Kim et al., 2004).
The parameters of customer satisfaction
indicators in this study were measured using the
indicator by Azizah (2012) which was adjusted to
the object of research, namely: (1) pleasure, showing
the extent to which the customers were happy with
the experience of using services (2) the right choice,
measured from feelings that arise in choosing a
company as a partner, whether it is right or not, and
(3) suitability of expectations, which is measured by
the feeling of happy customers arising from the
company's ability to meet all expectations.
Creating strong relationships with customers is a
dream of all marketers and this is often the key to
long-term marketing success (Kotler & Keller, 2009:
153). Once we get to know customers, we must
maintain good relationships with them. We must
know the customer personally, one by one, so that
we can have a description of their needs, desires,
preferences and behavior (Kotler et al., 2010: 186).
Rewards from loyalty are long-term and
cumulative. The longer the loyalty of a customer, the
greater of profit the company receives from one of
these customers. According to Griffin (2003: 11)
increased loyalty can save costs in at least 6 fields:
1) marketing costs are reduced (customer takeover
UNICEES 2018 - Unimed International Conference on Economics Education and Social Science
768
costs are higher than the cost of maintaining
customers; 2) transaction costs are lower; 3)
customer turnover costs are reduced (fewer missing
customers must be replaced; 4) the success of cross-
selling has increased, causing a greater share of
customers; 5) word of mouth reporting becomes
more positive, assuming loyal customers also feel
satisfied; 6) the cost of failure decreases (reduction
in rework, warranty claims, etc.).
The variable customer loyalty in this study was
measured by three indicators, Zeithaml et al. (1996),
namely: (1) Telling positive things about products,
(2) Recommending someone to product has been
consumed to a friend (recommending products to
others), and (3) Repurchase intention to product that
has been consumed (re-purchase).
3 RESEARCH METHOD
This research was conducted on consumers using a
questionnaire to users who had used GO-JEK online
service transportation located in the city of
Makassar. In this study, the population used was
consumers of GO-JEK online transportation services
in the last 4 months, namely the period January-
April 2018. In determining the sample size, this
study is based on the calculations put forward by
Slovin as follows:
𝑛
𝑁
1𝑁𝑒
Based on the formula, samples taken in this study
are:
n
1.439.696
1 1.439.696
5%
399,91
400 responden
From the calculation above, it can be seen that
the number of samples used in this study were 400
people.
Data collection by field research, which is a
study conducted directly into the field, in this study
conducted by interviewing users of GO-JEK online
transportation services in Makassar as well as
providing a list of questions in the form of a
questionnaire.
This study uses a quantitative approach in data
analysis, the analytical method used in analyzing
empirical data collected by researchers includes (1)
descriptive statistical analysis intended to determine
the frequency distribution of questionnaire, and (2)
inferential statistical analysis used to test the
research hypothesis is Structural Equation Modeling
(SEM).
4 ANALYSIS
In this study 400 questionnaires were distributed,
which were disseminated through offline and online.
The questionnaire returned only as many as 200, this
was due to the limitations of the research time, for
one month. In addition, after verification, 28
questionnaires were aborted because they did not
complete the data on the questions and statements in
the questionnaire, so that overall there were 172
questionnaires that were feasible to analyze.
4.1 Measurement Model
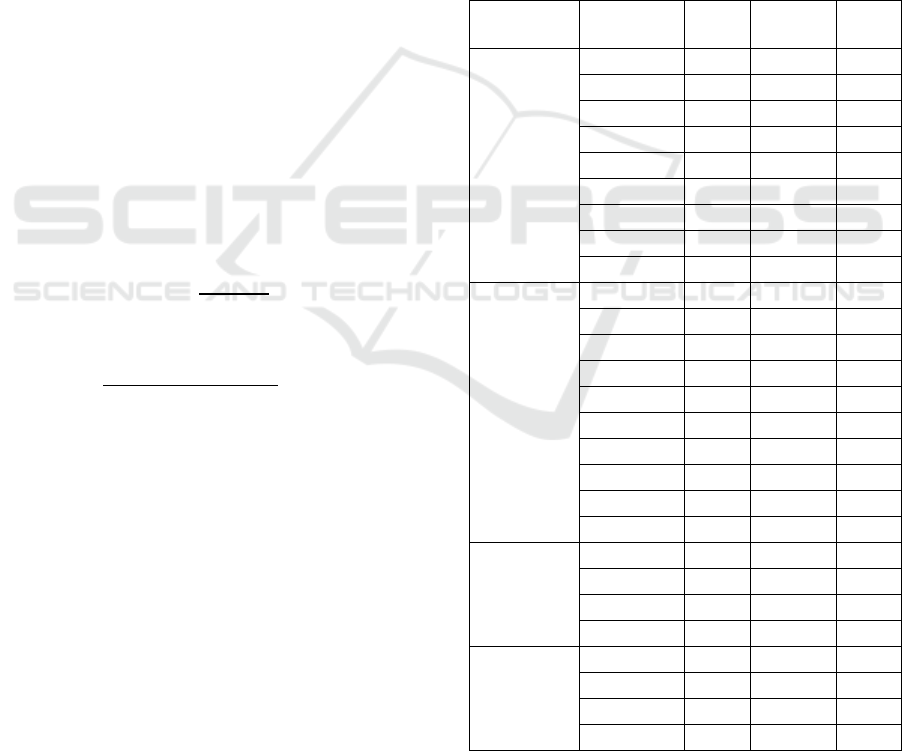
Table 1 below presents the results of the mean and
loading factors of each indicator in study variable.
Table 1: Loading Factor
Variabel Indikator Mean
Loading
Faktor
P-
value
Customer
Value
CVS1
4,13
0,777 Fix
CVS2
3,86
0,720 0,000
CVQ1
3,85
0,710 0,000
CVQ2
4,05
0,788 0,000
CVI1
3,86
0,597 0,000
CVI2
4,18
0,679 0,000
CVP1
3,57
0,905 0,000
CVP2
3,63
0,817 0,000
CVP3
3,22
0,767 0,000
Experiential
Marketing
EMS1
4,19
0,793 Fix
EMS2
4,20
0,789 0,000
EMF1
4,16
0,794 0,000
EMF2
4,20
0,702 0,000
EMT1
4,38
0,638 0,000
EMT2
4,03
0,733 0,000
EMA1
4,27
0,705 0,000
EMA2
4,07
0,847 0,000
EMR1
3,71
0,792 0,000
EMR2
4,05 0,886 0,000
Customer
satisfaction
KPS1
3,97 0,767 Fix
KPP1
4,05 0,768 0,000
KPH1
4,12 0,733 0,000
KPH2
4,01 0,795 0,000
Customer
loyalty
LPT1
4,25 0,679 Fix
LPT2
4,20 0,756 0,000
LPF1
4,11 0,777 0,000
LPR1
4,08 0,803 0,000
Source: Primary Data Processed, 2018
Based on Table 1, that all indicators significantly
measure their respective variables. The results of
Effect of Customer Value and Experiential Marketing to Customer Loyalty with Customer Satisfaction as Intervening Variable: Case Study
on Go-Jek Makassar Consumers
769

this analysis also show that the strongest Customer
Value measure is CVP 1 (factor loading 0.905 and
mean 3.57). Thus, it can be seen that Customer
Value is mainly influenced by lower prices than
similar competitors. Experiential Marketing is
known that the most powerful indicator as a measure
is EMA 1 (loading factor 0.886 and mean 4.05).
Thus it can be seen that Experiential Marketing is
primarily influenced by getting attractive rewards
after using the GO-JEK application. Customer
satisfaction is known that the most powerful
indicator as a measure is KPH 2 (loading factor
0.795 and mean 4.01). Thus it can be seen that
Customer Satisfaction is primarily influenced by
satisfying experience after using GO-JEK services.
Customer loyalty is known that the strongest
indicator as a measure is KPH 2 (factor loading
0.803 and mean 4.08). Thus it can be seen that
Customer Satisfaction is primarily influenced by the
delivery of the latest information about GO-JEK.
4.2 SEM Assumption
Before SEM analysis, the assumptions that underlie
the SEM model are tested, namely, normality,
outliers and linearity. Testing whether or not there
are univariate outliers is done by analyzing the
Zscore value from the research data used. If there is
a greater Zscore value ± 3.0, it will be categorized as
an outlier. This univariate outlier test uses the SPSS
program assistance. Based on the results of data
processing for testing the presence or absence of
outliers, it can be shown that the data does not occur
univariate outlier problems. The proof is marked by
a Zscore value below 3 or not in the range of 3 to 4.
If in the data there is a univariate outlier it will not
be removed from the analysis because the data
describes the real situation and there is no specific
reason for the profile of the respondent (Ferdinand,
2002).
To test the presence or absence of outliers, can be
seen with mahalanobis distance (Md). Mahalanobis
distance is evaluated using the value of 56,892.
From the distance of Mahalanobis with the most
distant observation point is the respondent to 104
with an Md value = 55,483. When compared with
the value of 56,892, then the value of Md 86th point
<56,892, it is concluded that all observation points
are not outliers.
Testing the linearity assumption is done by the
Curve Fit method. The results of linearity testing
show that all linear models are significant because
the Sig value is <0.05 so it is concluded that the
linearity assumptions have been fulfilled.
4.3 Goodness of Fit
The results of testing the overall goodness of fit
model, according to the results of SEM analysis, to
find out whether the hypothetical model is supported
by empirical data, are given in Table 2 below.
Table 2: Goodness of Fit Overall Model
Criteria Cut of value Result Conclusion
Chi-square
Probability
RMSEA
GFI
AGFI
CMIN/DF
TLI
CFI
389,313
≥ 0,05
≤ 0,08
≥ 0,90
≥ 0,90
≤ 2
≥ 0,95
≥ 0,95
529,498
0,000
0,056
0,833
0,804
1,535
0.942
0,947
Marjinal
Marjinal
Baik
Marjinal
Marjinal
Baik
Marjinal
Marjinal
Source: Primary Data Processed, 2018
The results of the Goodness of Fit Overall test
based on Table 2 show that 6 of 9 Goodness of fit
which shows good models, namely CMIN / DF,
GFI, CFI, RMSEA. According to Arbuckle and
Wothke, in Solimun (2009), the best criteria used as
an indication of the goodness of the model is the
value of Chi Square / DF which is less than 2, and
RMSEA which is below 0.08. In this study, the
values of CMIN / DF and RMSEA have met the cut-
off value. Therefore the SEM model in this study is
suitable and feasible to use, so that interpretation can
be carried out for further discussion.
4.4 SEM Analysis Structural
In this structural model, 5 hypotheses of
relationships between variables (direct efect) are
tested. The following is presented in full the results
of testing the relationship between research variables
as follows:
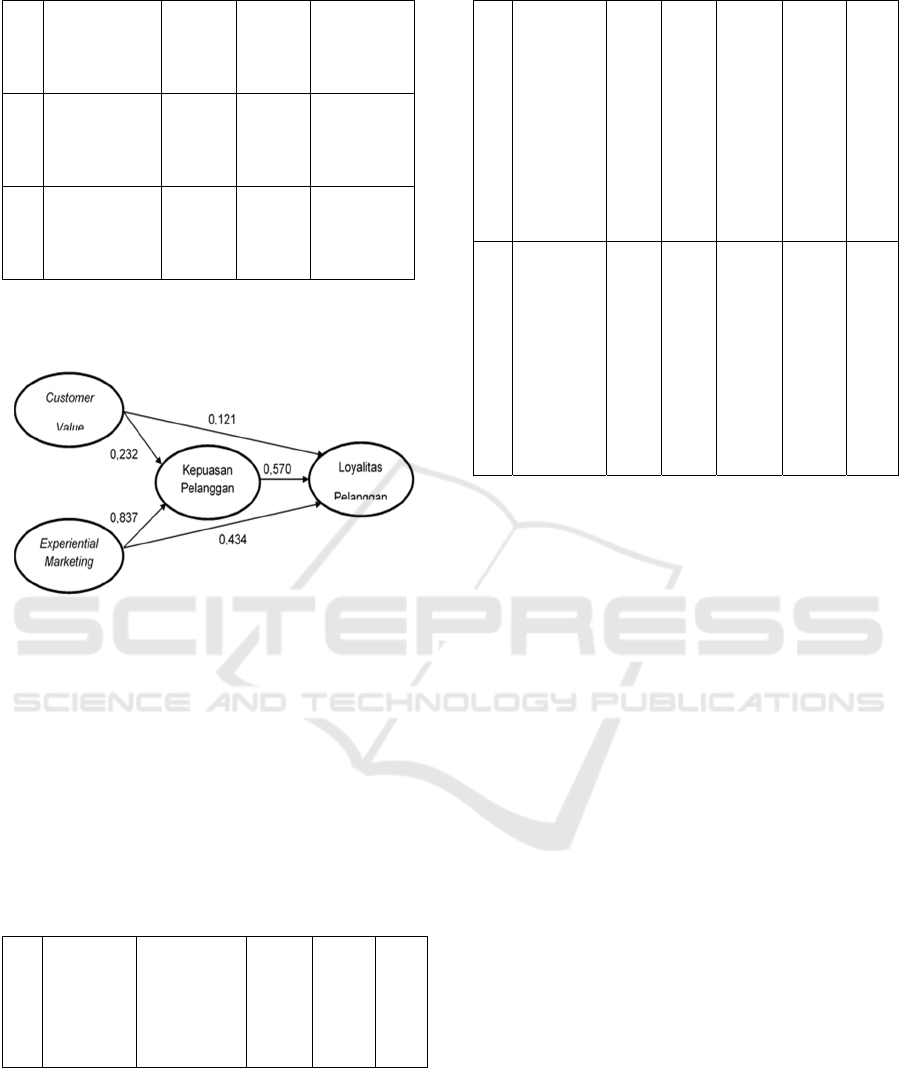
Table 3: Structural Modeling of SEM: Direct Effect
Corelation
between
variables
Coeff. P-value Conclusion
H1
Customer
Value (CV)
towards
Customer
Satisfaction
(KP)
0,232 0,000 Significant
H2
Experiential
Marketing
(EM) towards
Customer
Satisfaction
(KP)
0,837 0,000 Significant
UNICEES 2018 - Unimed International Conference on Economics Education and Social Science
770
H3
Customer
Value (CV)
towards
Customer
Loyalty (LP)
0,121 0,029 Significant
H4
Experiential
Marketing
(EM) towards
Customer
Loyalty (LP)
0,434 0,000 Significant
H5
Customer
Satisfaction
(KP) towards
Customer
Loyalty (LP)
0,570 0,000 Significant
Source: Primary Data Processed, 2018
Graphically presented as follows:
Figure 1: Structural Modeling of SEM: Direct Effect
In Table 3 it can be seen that the greatest weight
for total effect is the effect of Relationship
Marketing (RM) on Customer Satisfaction (KN)
with a weight of 0.527. Besides testing the direct
effect, SEM is also known as indirect effect. Indirect
influence is the result of multiplying 2 (two) direct
influences. Indirect influence is significant if the two
direct influences that make it up are significant. The
following is presented the results of indirect
influence.
Table 4: Structural Modeling of SEM: Indirect
Effect
Indirect
Effect
Coeff. Direct
Effect
Coeff.
Indirec
t Effect
Z
score
(P-
Value
)
Con.
H
6
Customer
Value (CV)
towards
Customer
Loyalty
(LP)
through
Customer
Satisfaction
(KP)
CV
→
KP =
0,23
2
KP
→
LP =
0,57
0
0,132 0,000
Sign
if-
icant
H
7
Experientia
l Marketing
(EM)
towards
Customer
Loyalty
(LP)
through
Customer
Satisfaction
(KP)
EM
→
KP =
0,83
7
KP
→
LP =
0,57
0
0,477 0,000
Sign
if-
icant
Source: Primary Data Processed, 2018
5 RESULTS
5.1 Direct Effect between Customer
Value and Customer Satisfaction
The results of the analysis of customer value found
that customer value has a significant influence on
customer satisfaction, which means that the higher
the customer value, the higher customer satisfaction.
Based on the results of data processing it is known
that the value of Critical Ratio (CR) influence
between customer value variables on customer
satisfaction is equal to 3.388 with a Probability (P)
of 0.000. The results of these two values provide
information that the effect of customer value
variables on customer satisfaction can be accepted,
because it meets the requirements above 1.96 for
Critical Ratio (CR) and below 0.05 for Probability
(P), thus it can be said that these findings can be
accepted.
This research also supports previous studies
conducted by Vedadi et al. (2013) The Effect of
Customer Value and Satisfaction on Customer
Loyalty: The Moderating Role of Ethical Reputation
to visitors to the Tehran Heart Center hospital in
Iran. The results of the study show that customer
value significantly influences customer satisfaction.
Effect of Customer Value and Experiential Marketing to Customer Loyalty with Customer Satisfaction as Intervening Variable: Case Study
on Go-Jek Makassar Consumers
771

5.2 Direct Effect between Experiential
Marketing and Customer
Satisfaction
The results of the analysis of experiential marketing
found that experiential marketing has a significant
influence on customer satisfaction, which means that
the higher the experiential marketing, the higher
customer satisfaction. Based on the results of data
processing it is known that the value of Critical
Ratio (CR) influence between experiential marketing
variables on customer satisfaction is 9,157 with a
Probability (P) value of 0,000. The results of these
two values provide information that the influence of
experiential marketing variables on customer
satisfaction can be accepted, because it meets the
requirements above 1.96 for Critical Ratio (CR) and
below 0.05 for Probability (P), thus it can be said
that the findings of this study acceptable.
This research also supports previous studies
conducted by Kusumawati (2011) about analyzing
the influence of experiential marketing on customer
satisfaction and loyalty: the case of Hypermart
Malang Town Square (MATOS). Ekoputra et al.
(2015) conducted a study of The Effect of
Experimental Marketing on Customer Satisfaction
and Loyalty Restaurant 150 Eatery in Bogor, the
results showed that experiential marketing had a
significant effect on customer satisfaction.
5.3 Direct Effect between Customer
Value and Customer Loyalty
The results of the analysis of customer value found
that customer value findings have a significant effect
on customer loyalty, which means that the higher the
customer value, the higher customer loyalty. Based
on the results of data processing it is known that the
value of Critical Ratio (CR) influence between
customer value variables on customer loyalty is
equal to 2.189 with a Probability (P) value of 0.029.
The results of these two values provide information
that the effect of customer value variables on
customer loyalty can be accepted, because it meets
the requirements above 1.96 for Critical Ratio (CR)
and below 0.05 for Probability (P), thus it can be
said that the findings of this study acceptable.
This study also supports previous studies
conducted by Lai et al. (2008) conducted a study of
How Quality, Value, Image, and Satisfaction Create
Loyalty at a Chinese Telecom. The results show that
value has a positive and significant effect on loyalty.
The research conducted by Vedadi et al. (2013) The
Effect of Customer Value and Satisfaction on
Customer Loyalty: The Moderating Role of Ethical
Reputation to visitors to the Tehran Heart Center
hospital in Iran. The results show that customer
value has a positive effect on loyalty.
5.4 Direct Effect between Experiential
Marketing and Customer Loyalty
The results of this analysis of experiential marketing
found that experiential marketing has a significant
influence on customer loyalty, which means that the
higher the experiential marketing, the higher
customer loyalty. Based on the results of data
processing it is known that the value of Critical
Ratio (CR) influence between experiential marketing
variables on customer loyalty is 3.861 with a
Probability (P) value of 0.000. The results of these
two values provide information that the influence of
experiential marketing variables on customer loyalty
is acceptable, because it meets the requirements
above 1.96 for Critical Ratio (CR) and below 0.05
for Probability (P), thus it can be said that the
findings of this study acceptable.
Pham and Huang (2017) conducted a study of
The Impact of Experiential Marketing on
Customers's Experiential Value and Satisfaction: An
Empirical Study in Vietnam Hotel Sector, the results
showed that experiential marketing had a significant
effect on loyalty. Wu and Tseng (2015) conducted a
study of Customer Satisfaction and Loyalty in
Online Shop: An Experiential Marketing Perspective
result showed that experiential marketing had a
positive effect on customer loyalty.
5.5 Direct Effect between Customer
Satisfaction and Customer Loyalty
The results of the analysis of customer satisfaction
found that customer satisfaction has a significant
influence on customer loyalty, which means that the
higher customer satisfaction, the higher customer
loyalty. Based on the results of data processing it is
known that the value of Critical Ratio (CR)
influence between customer loyalty variables on
customer loyalty is equal to 4.645 with a Probability
(P) of 0.000. The results of these two values provide
information that the influence of customer loyalty
variables on customer loyalty can be accepted,
because it meets the requirements above 1.96 for
Critical Ratio (CR) and below 0.05 for Probability
(P), thus it can be said that the findings of this study
acceptable.
Munizu and Hamid (2015) conducted a study of
the Satisfaction and Loyalty Improvement Model on
the Quality of Higher Education Services, the results
UNICEES 2018 - Unimed International Conference on Economics Education and Social Science
772

showed that satisfaction had a significant effect on
student loyalty.
5.6 Indirect Effects of Customer Value
on Customer Loyalty through
Customer Satisfaction
If seen from the indirect influence of customer value
on customer satisfaction through customer loyalty,
the indirect influence between customer value and
customer loyalty is 0.232. Given that this indirect
influence is formed by two direct influences, namely
the direct influence of customer value and customer
satisfaction, and the direct effect of customer
satisfaction and customer loyalty, where both
influences are significant, it can also be explained
that the indirect influence is significant. This
indicates the indirect influence of customer value
and customer loyalty through customer satisfaction.
The research conducted by Vedadi et al. (2013)
The Effect of Customer Value and Satisfaction on
Customer Loyalty: The Moderating Role of Ethical
Reputation to visitors to the Tehran Heart Center
hospital in Iran. The results show that customer
value has a positive effect on customer satisfaction
and loyalty. The meaning of this finding is that
customer value indirectly has an influence on
customer loyalty through customer satisfaction in
GO-JEK online service users.
5.7 Indirect Effect of Experiential
Marketing on Customer Loyalty
through Customer Satisfaction
When viewed from the indirect influence of
experiential marketing on customer loyalty through
customer satisfaction, there is an indirect influence
between experiential marketing on customer loyalty
of 0.363. Since these indirect effects are formed by
two direct influences, namely the direct influence of
experiential marketing on customer satisfaction, and
the direct influence of customer satisfaction and
customer loyalty, where both direct effects are
significant, it can also be explained that the indirect
influence is significant.
Kusumawati (2011) conducted a study of the
effect of the analysis of the effect of Experiential
Marketing on customer satisfaction and loyalty: the
case of Hypermart Malang Town Square (MATOS).
The results showed that experiential marketing had a
positive and significant effect on customer loyalty.
The meaning of these findings is that indirectly
experiential marketing has an influence on customer
loyalty through customer satisfaction on GO-JEK
online service users.
6 CONCLUSIONS
6.1 Finding
Based on the background, formulation of the
problem, the purpose of research, theoretical studies,
empirical studies, hypotheses, and test results, it can
be summarized as follows:
1) Customer value has a significant effect on
customer satisfaction. Where the better
customer value provided by GO-JEK online
transportation service providers will increase
customer satisfaction
2) Experiential marketing has a significant effect
on customer satisfaction. Where the better
experiential marketing provided by GO-JEK
online transportation service providers will
increase customer satisfaction
3) Customer value has a significant effect on
customer loyalty. Where the higher customer
value provided by GO-JEK online
transportation service providers will increase
loyalty so that it will have an impact on the
low level of customer turnover (churn) to other
brands or competitors.
4) Experiential marketing has a significant effect
on customer loyalty. Where the higher
experiential marketing provided by GO-JEK
online transportation service providers will
increase loyalty so that it will have an impact
on the low level of customer turnover (churn)
to other brands or competitors.
5) Customer satisfaction has a significant effect
on customer loyalty, which means, if the level
of customer satisfaction is high it will have an
impact on loyalty. Likewise, vice versa, if the
satisfaction level is low, it will result in a low
customer turnover (churn) to another brand or
competitor.
6) Customer value has a significant effect on
customer loyalty through customer
satisfaction, which means that the higher
customer value, will affect the high customer
loyalty through customer satisfaction. This
finding is in accordance with the customer
value concept.
7) Experiential marketing has a significant effect
on customer loyalty through customer
satisfaction, which means that the higher
experiential marketing will affect the high
customer loyalty through customer
satisfaction. This finding is in accordance with
the concept of experiential marketing.
Effect of Customer Value and Experiential Marketing to Customer Loyalty with Customer Satisfaction as Intervening Variable: Case Study
on Go-Jek Makassar Consumers
773

6.2 Recommendation
This research still has limitations so it still needs
to be improved. Suggestions that can be submitted
for further research, as follows:
1) GO-JEK online transportation service
providers in Makassar should maintain
customer value and experiential marketing that
exist today and need to be upgraded to the
latest features of the application, innovate,
provide attractive promos to customers, and
improve service systems to make customers
more satisfied and not move to competing
brands.
2) The GO-JEK online transportation service
provider in Makassar city should give special
awards to customers who have long used
transportation facilities so that they are more
loyal and recommend to those around them to
become customers of this transportation
service provider.
3) For the future, it would be better if research
was conducted on other variables that were
thought to have an influence on customer
satisfaction and customer loyalty in GO-JEK
transport users in Makassar so that companies
could make improvements to further increase
customer satisfaction and loyalty.
REFERENCES
Alkilani, K., Ling, K. C., dan Abzakh, A. A. (2013). The
Impact of Experiential Marketing and Customer
Satisfaction on Customer Commitment in the World of
Social Networks. Asian Social Science, Vol. 9, No.1,
ISSN: 1911-2025
Alma, Buchari. (2007). Manajemen Pemasaran Dan
Pemasaran Jasa. Bandung: Alfabeta
Azizah, Hilyatul. (2012). Pengaruh Kualitas Layanan,
Citra dan Kepuasan Terhadap Loyalitas Nasabah.
Management Analysis Journal, Vol. 5, No.7, ISSN:
2252-6552
Ekoputra, A., Hartoyo, dan Nurrochmat, Dodikridho.
(2015). The Effect of Experiential Marketing on
Customer Satisfaction and Loyalty Restaurant 150
Eatery in Bogor. International Journal of Science and
Research, Vol. 6, No.9, ISSN: 2319-7064
Gentile, C., Spiller, N., dan Noci, Giulano. (2007). How to
Sustain the Customer Experience: An Overview of
Experience Components That Co-create Value with
the Customer. European Management Journal,
Vol.25, No.5, pp.395-410
Griffin, Jill. (2003). Costomer Loyalty: Menumbuhkan
dan Mempertahankan Kesetiaan Pelanggan. Jakarta:
Erlangga
Ferdinand, Augusti. (2002). Structural Equation Modeling
Dalam Penelitian Manajemen. Semarang: BP UNDIP
Kim M.K., Park M.C., dan Jeong D.H. (2004). The Effects
of Customer Satisfaction and Switching Barrier on
Customer Loyalty in Korean Mobile
Telecommunication Services. Telecommunications
Policy. pp, 145-159
Kotler, Philip dan Armstrong, Gary. (2008). Prinsip-
Prinsip Pemasaran, Edisi 12 Jilid 1. Jakarta: Erlangga
Kotler, Philip dan Keller, Kevin Lane. (2009). Manajemen
Pemasaran, Edisi 13 Jilid 1. Jakarta: Erlangga
Kusumawati, Andriani. (2011). Analisis Pengarauh
Experiential Marketing Terhadap Kepuasan dan
Loyalitas Pelanggan: Kasus Hypermart Malang Town
Square (MATOS). Jurnal Manajemen Pemasaran
Modern, Vol. 3, No.1, ISSN: 2085-0972
Lovelock, C. H., Wirtz, J., dan Mussry, J. (2010).
Manajemen Pemasaran Jasa Manusia, Teknologi,
Strategi. Jakarta: Erlangga
McFarlane, Donovan A. (2013). The Strategic Importance
of Customer Value. Atlantic Marketing Journal, Vol.
2, No.1 ISSN: 2165-3878, E-ISSN: 2165-3887
Munizu, Musran dan Hamid, Nurdjanah. 2015.
Satisfaction and Loyalty Improvement Model on the
Quality of Higher Education Services. Jurnal
Dinamika Manajemen, Vol. 6, No.1, pp: 13-24
Pham, Thi Hoa dan Huang, Ying-Yuh. (2015). The Impact
of Experiential Marketing On Customer’s Experiential
Value and Satisfaction: An Empirical Study in
Vietnam Hotel Sector. Journal of Business
Management & Social Sciences Research, Vol. 4,
No.1, ISSN: 2319-5614
Vedadi, A., Kolobandi, A., dan Pool, Hossein K. (2013).
The Effect of Customer Value and Satisfaction on
Customer Loyalty: The Moderating Role of Ethical
Reputation. International Journal of Basic Sciences &
Applied Research, Vol. 2, No.5, pages.453-458-70,
ISSN: 2147-3749
Woodruff, Robert B. (1997). Customer Value: The Next
Source for Competitive Advantage. Academy of
Marketing Science. Journal. Volume 25, Issue 2, pp
139-153
Zeithaml, Valarie A. (1988), Consumer Perception of
Price, Quality, and Value: A Means-End Model and
Synthesis of Evidence. Journal of Marketing, Vol. 52,
pp. 2-22
Wu, Mei-Ying dan Tseng, Li-Hsia. (2015). Customer
Satisfaction and Loyalty in an Online Shop: An
Experiential Marketing Perspective. International
Journal of Business and Management, Vol. 10, No.1,
ISSN: 1833-3859, E-ISSN: 1833-8119
Zeithaml, V. A., Parasuraman, A., dan Berry, L. L. (1996),
The Behavioral Consequences of Service Quality.
Journal of Marketing, Vol. 60, pp. 31-46
Zena, P. A. dan Hadisumarto, A. D. (2012). The Study of
Relationship among Experiential Marketing, Service
Quality, Customer Satisfaction, and Customer
Loyalty. ASEAN Marketing Journal, Vol.4, No.1
UNICEES 2018 - Unimed International Conference on Economics Education and Social Science
774
