
Analysis of the Interdependence of Monetary Instruments
a
g
ainst Real Mone
y
Demand in Indonesia
Putri Suryani Sebayang
1
, Fitrawaty
2
and Muhammad Fitri Rahmadana
2
1
Post Graduate School, State University of Medan, North Sumatra, 20219, Indonesia
2
Department Economics, Faculty of Economics, State University of Medan, North Sumatra, 20219, Indonesia
Keywords: Real Demand for Money (M1), GDP, Interest Rate of Bank Indonesia, Exchange Rate, Inflation, Vector
Error Correction Model (VECM)
Abstract: This research aims to determine how the relationship between variables gross domestic product, interest
rates, exchange rates, and inflation against the demand for real money (M1) in Indonesia. The data used in
the study of this empirical data for the time series of the year 1987-2017 derived from Bank Indonesia and
the Central Bureau of Statistics (BPS). The analysis method in this research is The Vector Error Correction
Model (VECM). The results showed there is a direct relationship between the exchange rates with demand
for real money (M1). And there is a direct relationship with the demand for real money (M1) with inflation.
The results of the study also showed the gross domestic product of influential negative and significantly
affect the demand for real money in the short-term. Variable exchange rates, interest rates and inflation
effect no effect against the demand for real money (M1) in the short-term. The demand for real money (M1)
in Indonesia in the long-term be influenced in a positive and significant by the variable gross domestic
product, exchange rates, interest rate. While the variable is a negative and significant effect of inflation
against the demand for real money (M1) in Indonesia in the long-term.
1 INTRODUCTION
The money created in the economy aims to launch
exchange-traded activities and trade, or in other
words, the money was defined as objects that are
approved by the community as a mediator to hold
someone or trade. Money Kartal is money issued by
the central bank both banknotes or coins that are
circulating in the community. (Prawoto, 2010:18).
The money supply is often linked to interest
rates, economic growth, and the development of
prices. The phenomenon is happening in Indonesia
showed at the time the money supply increases tend
to encourage price increases of goods in General,
resulting in inflation. Conversely, when the money
supply decreased, economic activity will slow down
that led to the decline in production levels that
followed price increases of goods.
Request money greatly affects the economy of
Indonesia it can be reinforced with the theory of the
demand for money. Many of the theories that discuss
the request for money. According to the classical
doctrine, money has no influence on the rill, no
sector of its effect on interest rates, employment
opportunities or national income (Nopirin, 2009). At
the beginning of this theory is not intended to
explain why communities save money. But more on
the role of on the money. Therefore some of the
theory with familiar classics such as Irving Fisher's
theory only describes the relationship the number of
coins, turnover, volume, and price of the goods. And
Marshall's theory that only describes the relationship
of the nominal value of money, prices, income, and
the proportion of the demand for money.
The theory of money demand continues to grow
and then comes the theory that further deepens the
theory Keynes is a theory developed by Baumol and
Tobin who explained that requests money for the
purpose of transactions affected interest rates
(Nopirin, 2007). Because when high-interest rates
then that will reduce an individual means of
payment in the form of cash and money to expand
the securities. Otherwise, once the interest rates low
so the individual will reproduce the cash money.
An overview of the linkages of the development
of monetary instruments with real money demand
(M1) can be seen in the picture below.
532
Sebayang, P., Fitrawaty, . and Rahmadana, M.
Analysis of the Interdependence of Monetary Instruments against Real Money Demand in Indonesia.
DOI: 10.5220/0009505005320537
In Proceedings of the 1st Unimed International Conference on Economics Education and Social Science (UNICEES 2018), pages 532-537
ISBN: 978-989-758-432-9
Copyright
c
2020 by SCITEPRESS – Science and Technology Publications, Lda. All rights reserved
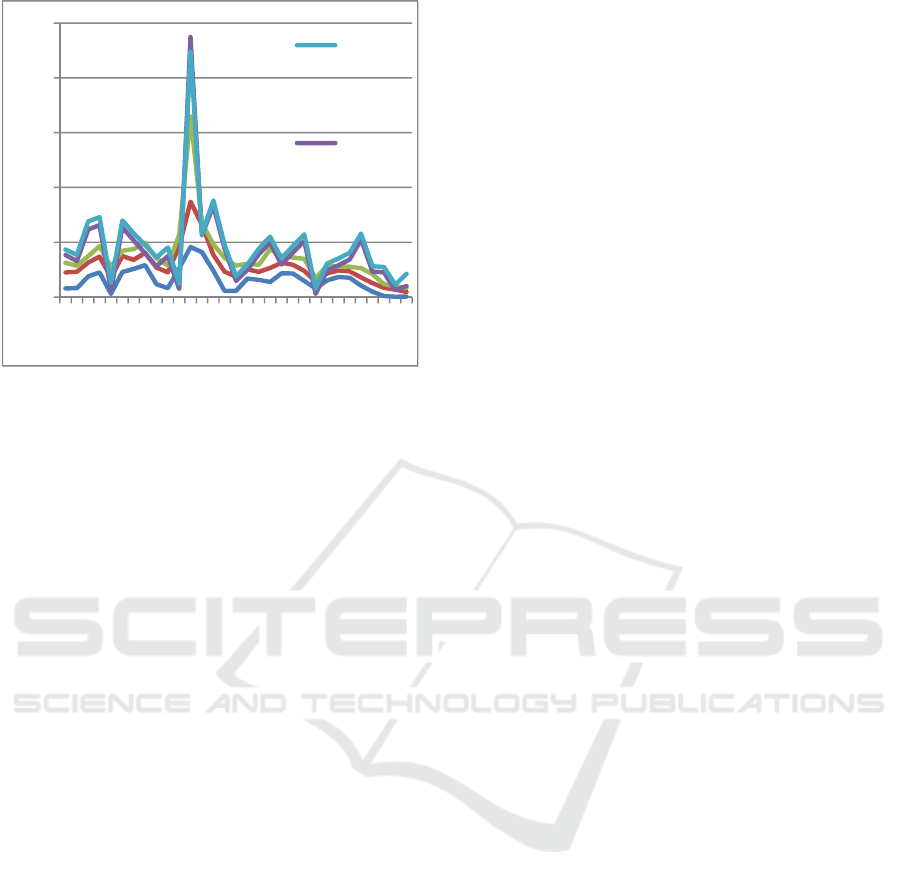
Figure 1: The trend of the real money demand (M1) and
monetary instruments variable in Indonesia year 1987-
2017
Based on Figure 1 shows that the demand for
real money year 2008 experienced a decline of 21.44
percent to 14.63 percent. When the world economy
is hit by the global economic crisis, the impact is felt
in Indonesia that led to the economic climate in the
country also come into effect, the peak occurred in
the year 2008. GDP growth the year 2008 noted the
development of a fairly good about 14.63 percent in
the middle of the occurrence of the external turmoil.
In late 2008, however, the exchange rate of rupiah
currency from rising of rupiahs per dollar into 9,419
10,950 rupiahs per dollar and at the same time the
banks start to tighten its credit policies. Then in mid-
2008 world oil prices rising back up to reach above
145 U.S. dollars per barrel and followed a financial
crisis in America in 2008. The economic impact on
the countries of Europe, Asia and Indonesia are also
included. Finally back pressing the rupiah exchange
rate in 2008 reached almost 10,950 rupiah per dollar.
Changes in interest rates and the sharp inflation
occurred in the year 2008, inflation has a high
influence on the demand for real money (M1).
Thus, the phenomenon of money demand
monetary interest to research. Identify economic
quantities that affect the demand for money through
various studies theory, empirical studies and the
phenomenon of data that has been done previously
showed the importance of the development of
research request for money in Indonesia. In General,
this research examines the relationship between the
independent variable and the dependent variable in
the short-term and long-term. The purpose of this
research is to analyze the association between
variables Bank Indonesia interest rate (BI Rate),
inflation (INF), the exchange rate (EXC), and the
GDP against the demand for real money (M1) in
Indonesia.
2 THEORETICAL FRAMEWORK
Money has a negative relationship with the level of
interest rates. Keynes stated that the community has
confidence the presence of a normal interest rate. If
the securities are held at the time the interest rate
goes up, it will be incurred losses. This can be
avoided by way of reducing the Securities and adds
cash money. The higher the interest rate, the higher
the cost of holding cash money anyway so desire
cash money holding it down. Conversely, when
interest rates go down means the cost of holding
money in cash is also getting low so cash money
demand rises (Nopirin, 2009).
Purchasing Power Parity theory predicts that the
decline in domestic purchasing power of the
currency indicated by the domestic price level would
relate to currency appreciation proportionately. In
short, there are two versions of the theory of
purchasing power parity, i.e. the interpretation of
absolute and relative. According to the interpretation
of the absolute purchasing power parity, a
comparison of the value of one currency with
another currency (exchange rate) is determined by
the price level in their respective countries. So the
exchange rate is based on a comparison of
purchasing power. While according to the
interpretation of relative purchasing power parity
exchange rate saying that power parity based on
price changes (Nopirin, 2009).
In the quantity theory of money theory of money
demand, Fisher and Keynes ware mainly for the
purpose of the transaction stated that demand for
money depends on income. The higher the income,
the greater the desire then would cash money. It can
be seen from the behavior of the community level
high revenues, will usually do more transactions
than the community that its revenues are lower. This
means that when revenues increase, then spending
more and more money so that also to deals increases
(Nopirin, 2009).
3 RESEARCH METHOD
The data will be used in this research in the form of
secondary data. Secondary data that will be used is
the data time series during the year 1987-2017
0
50
100
150
200
250
1987
1990
1993
1996
1999
2002
2005
2008
2011
2014
2017
GDP
Exchange
Rate
Analysis of the Interdependence of Monetary Instruments against Real Money Demand in Indonesia
533

which is the total amount of data Bank Indonesia
interest rate (BI Rate), inflation (INF), the exchange
rate (EXC), and the GDP against the demand for
real money (M1) in Indonesia. The data can be
taken from the Bank Indonesia (BI) and the Central
Bureau of Statistics (BPS) or via the official website
of each of the institutions (www.bi.go.id and
www.bps.go.id).
Methods of data analysis used in this study was a
statistical analysis method with equation model
VECM (vector error correction model) which
consists of the initial test variables by using the root
test a unit test that uses Augmented Dickey-Fuller. If
the present level of stationary data then continued
with the usual VAR equations (VAR unrestricted)
which comprise two equations to determine the
optimal VAR order and continued with the Granger
test method using Johansen. The last stage is doing
the estimation methods of VAR and accompanying
the VECM, namely test causality, function response
to shock (the Impulse Response Function/IRF), and
decomposition of variants (Forecast Error Variance
Decomposition/FEVD). This study uses statistics
programs help E-Views version 7.
4 ANALYSIS
4.1 Stationer Test
The first thing to do is to examine whether the data
is stationary or not. This Stasioneritas test needs to
be done because a regression analysis should not be
done when the data used is not stationary and
normally if it still has done the resulting equations
then are a spurious regression. The test methods
used in this Test method is stationeries Unit Root
Test or also known as the test of the Augmented
Dickey-Fuller (ADF).
4.1.1 Unit Root Test
The value of the test results with the Augmented
Dickey-Fuller (ADF), indicated by the value of the
statistical regression coefficients t on the observed
variable (X). If the value is greater than the value of
the ADF test critical values MacKinnon on the level
of the 1 percent, 5 percent, or 10 percent, then the
stationary means data.
Based on table 1 that Bank Indonesia interest rate
(BI Rate), and the demand for real money (M1) in
Indonesia is not significant at the α = 5 percent.
Because not stationary at the zero degrees, then it
needs to be done again using stationarity test the
degree of integration of the single.
Table 1: Unit Root Test Results
Variables
Value
ADF
Critical
Value
McKinnon
(α = 5%)
Desc
M1
-1.178163
-2.971853
Non-
Stationary
GDP -3.918175 -2.963972
Stationary
EXC -3.292333 -2.963972
Stationary
BI Rate
-1.566971
-2.963972
Non-
Stationary
INF -5.751641 -2.963972
Stationary
4.1.2 Integration Test
A test of the degree of integration is a test done to
measure at the level of difference to how data all the
variables are stationary. The taking of decision is
when the count of an ADF variable is greater than
the critical value of MacKinnon, means the variable
is stationary, and vice versa.
Based on table 2 that variable Bank Indonesia
interest rate (BI Rate), inflation (INF), the exchange
rate (EXC), and the GDP against the demand for
real money (M1) in Indonesia has been stationary at
the same degree, that is one degree, shown from the
ADF value calculate more than the value of the
critical (Mackinnon critical values) at α = 5%. Thus,
the Granger test requires a stationary data at the
same degree can be used.
Table 2: Integration Test Results
Variables
Value
ADF
Critical
Value
McKinnon
(α = 5%)
Desc
M1 -4.327986 -2.971853 Stationary
GDP -6.849849
-2.967767 Stationary
EXC -6.776012
-2.967767 Stationary
BI Rate -5.525270
-2.967767 Stationary
INF -6.249907
-2.967767 Stationary
4.1.3 Cointegration Test
Granger test is a test of unit roots test and degree of
integration. Granger test meant to know the behavior
of the data in the long term between related variables
is there Granger or not as you see fit by economic
theory. To do this test used Granger Johansen test.
The taking of decision is when the value of the
Trace Statistic>Critical Value and the value of Max-
UNICEES 2018 - Unimed International Conference on Economics Education and Social Science
534
Eigen Statistics>Critical Value, meaning between
these variables in long-term relations equilibrium,
and vice versa.
Table 3: Cointegration Test Results
Hypothesis
Trace
Statistic
Critical
Value
(α = 5%)
Prob
None* 159.3965 68.81889 0.00000
At most 1* 94.54151
47.85613 0.0000
At most 2* 45.73188
29.79707 0.0004
At most 3*
19.68411
15.49471 0.0110
At most 4*
8.431014
3.841466 0.0037
Based on table 3 that there are equations that
model in Granger. Thus, an appropriate model to be
used in this research is the Vector Error Correction
models (VECM).
4.2 Estimation Vector Error
Correction Model (VECM)
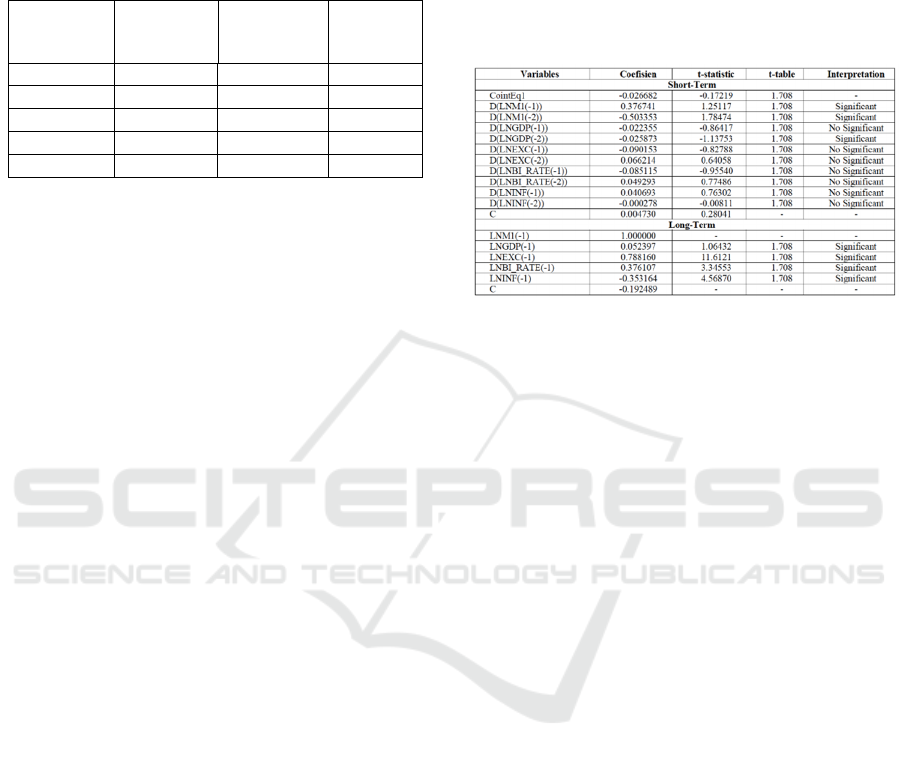
Based on table 4 provides statistical information for
each equation of variables DM1, DGDP, DEXC,
DBIRATE and DINF and the very bottom is the
information thoroughly. Numbers in brackets show
the first standard error numbers are locked up while
the bottom shows a value of the t-statistic.
VECM estimation results in the table above
show that in the long run, the first of the variable
gross domestic product had a positive relationship
towards the demand for real money amounting to
0.052397 and a significant increase in the
probability of 10 percent. These results show that
long-term changes in the gross domestic product will
be followed by the demand for real money with
direct direction. If an increase in the amount of 1
billion rupiahs in a gross domestic product will be
followed by an increase in the demand for real
money amounting to 0.052397 percent.
Second, the variable exchange rate against the
real money demand relationship 0.788160 of
positive and significant at probability 10 percent.
Thus, in the event of an increase of 1 percent on the
exchange rate of 1 the rupiah per dollar will be
followed by a decrease in the demand for real money
amounting to 0.788160 percent.
Third, the variable interest rate against the
demand for real money has a positive relation of
0.376107 and significant at probability 10 percent.
Thus, in the event of an increase of 1 percent on the
interest rate will be followed by a rise in the demand
for real money amounting to 0.376107 percent.
Fourth, variable Inflation against real money
demand relationship -0.353164 negative and
significant at the 10 percent probability. Thus, in the
event of an increase of 1 percent in Inflation will be
followed by a decrease in the demand for money is
real of 0.353164 percent
Table 4: Estimation VECM Test Results
On the model of equation VECM, where each
variable influence each other (exogenous) and may
also be affected (endogenous). The first equation,
DM1 which is a query variable real money as an
endogenous variable is affected by the variable
demand for real money yourself (DM1), gross
domestic product (DGDP), exchange rates (DEXC),
the interest rate of Bank Indonesia (DBI RATE) and
inflation (DINF) next could be explained on the
model equations are given below. The resulting
equation in the VECM estimation is as follows:
D(LNM1) = 0.004730 - 0.022355 D(LNGDP(-1)
-
0.025873 D(LNGDP(-2))
– 0.090153
D(LNEXC(-1))
+
0.066214
D(LNEXC(-2)
–
0.085115
D(LNBI RATE(-1)) + 0.049293
D(LNBI RATE(2))
+ 0.040693
D(LNINF(-1)) - 0.000278
D(LNINF(-2))
- 0.026682 ECT
As for the VECM equation for the long-term are
as follows:
LNM1 = - 0.192489 + 0.052397 LNPDB(-1) +
0.788160 LNEXC(1
)
+
0.376107 LNBI RATE(-1)) -
0.353164 LNINF(-1)
The first equation with endogenous variables
requests real money (M1), where a variabel gross
domestic product, inflation, exchange rate and a
variable interest rate do not give significant effects
against the movement of real money demand. The
demand for real money (M1) was also significantly
influenced by the movement itself on two and one
years earlier. Real money demand relationship
Analysis of the Interdependence of Monetary Instruments against Real Money Demand in Indonesia
535

pattern (M1) and himself is negative except for the
previous two years related positively. The
relationship of real money demand and gross
domestic product are insignificant and have a
positive relationship for the two to a year earlier.
The relationship between real money demand and
inflation was not significant and has a negative
relationship for two to a year earlier. Real money
demand a relationship and exchange rate were not
significant and negative except for two months
before that deal was positive. Real money demand
relationship and significant interest rate on one-
month before and have a positive relationship one
year earlier and have a negative relationship to the
previous two years.
The results of this equation indicates that any
increase in the product gross domestic at this time, it
will be an increase in the demand for real money in
the next one to two years. The increase in Inflation
at the moment will have an impact on the decline in
the demand for real money one and twenty years
after. The increase in the exchange rate when. This
will result in increased demand for real money one
year later, but then leads to a decrease in the two
years thereafter. An increase in the current interest
rate will lower the demand for real money in one
year afterward. but later led to a decrease in the two
years thereafter. Within the same way, we can
interpret the equations with the dependent variables
etc.
4.3 Estimation Impulse Response
Function (IRF)
To know a variable response to changes or shock
that occurs from the variable itself with other
variables in this study used the analysis of impulse
response. Following the results of the analysis of
impulse response:
Figure 2: The Impulse Response Function
The variable demand for real money (M1) at the
change of one (1) standard deviation experience a
decrease. The response continues to be negative with
declining small fluctuations after the next 10 years.
The GDP variable on changes one (1) standard
deviation of GDP alone showed the value of positive
response at one year next and experience negative
response on one the following year. Next at one
month later inflation experience positive and
negative responses one month there after in turns
until the end of the period.
4.4 EstimationVariance Decomposition
After he had done the testing against the impulse
response, then the next to perform testing of the
decomposition of the variant that aims to find out
donations variant of variables against the demand for
real money (M1).
In the first period, the analysis of variance
showed that the decomposition forecast error
variance from the demand for real money on the first
period determined by himself in the amount of 100
per cent, while the variable contribution of gross
domestic product, exchange rate, Bank Indonesia
interest rates and inflation are not able to explain the
variability of the demand for real money (M1) of 0
percent.
5 CONCLUSIONS
The condition is the amount of money circulating in
the economy of Indonesia is dominated with the
influence of interest rates and inflation. It refers to
the theory the interest rate transmission explained
that the role of the monetary sector is still pretty. It
is important in controlling the number of money in
circulation. The Government through the Central
banks still hold strong control to control the
economy in Indonesia. Economic growth was also
considerable effect on rates interest rate, inflation
and the amount of money in circulation. But based
on the results of impulse response, these variables
quickly back to a point of stability caused economic
growth only give short-term influence.
REFERENCES
Nopirin, Ph.D. (2009). Ekonomi Moneter Buku II. BPFE.
Yogyakarta.
Prawoto, N. (2010). Money demand: A Study on the
Indonesian influental factors. Economic Journal of
UNICEES 2018 - Unimed International Conference on Economics Education and Social Science
536

Emerging Markets, December 2010 2(3), p. 223-
236
Dharmadasa, C dan Nakanishi, M. (2013). Demand for
money in Sri Langka: ARDL Approach to Co-
integration. 3rd International conference on
humanities, Geography and Economics (ICHGE),
January 4-5, 2013 Bali, p. 143-147.
Analysis of the Interdependence of Monetary Instruments against Real Money Demand in Indonesia
537
