
Analysis of Purchasing Decisions as a Form of Consumer Brand
Responses
P. Dewi Dirgantari
1
, Y. M. Hidayat
1
and B. Widjajanta
1
1
Faculty of Economics and Business Education, Universitas Pendidikan Indonesia, Bandung-Indonesia
Keywords: Purchase Decision, Marketing Mix, Meta-Analysis.
Abstract: The purpose of this study is to find out and analyze purchasing decisions that are influenced by the factors
forming the marketing mix. This research is motivated by the gap in research results so that it needs to be
reexamined these factors and/or dimensions. The method used is a meta-analysis by collecting the results of
research published online/online about purchasing decisions that are influenced by the marketing mix
factors. The results obtained from this study indicate that purchasing decisions are influenced by acceptable
marketing mix factors.
1 INTRODUCTION
Marketing is one of the main sources of competitive
advantage in a company (Guercini & Runfola,
2015). As stakeholders of marketing activities,
consumer behavior must be well understood
(Abdeen, Rajah, & Gaur, 2016). Consumer behavior
is the study of how individuals, groups and
organizations choose, buy, use, and spend goods,
services, ideas, or experiences to satisfy the needs
and desires of consumers (Kotler & Keller, 2016:
151). Purchasing behavior gets a lot of attention
from marketers and researchers because of the
significant role it plays in anticipating operational
success and achieving competitive advantage
(Panasuraman et al., 1985).
Purchasing decisions is a process where
consumers know the problem, find information
about a particular product or brand and evaluate how
well each of these alternatives in solving the
problem which then leads to purchasing decisions
and greatly influenced perceived risk (Kotler &
Keller, 2015). Lack of information and knowledge
of a brand and the features of a product can clearly
lead to low purchasing decisions, thereby reducing
the number of purchases (Kotler & Keller, 2015).
Thus, to overcome the low purchasing decisions,
companies must multiply their product information
when consumers carry out information seeking
stages (Shareef et al., 2008). At the information
seeking stage, consumers will seek offline and
online referrals (Chaffey & Smith, 2008).
Companies must provide marketing stimuli that can
be controlled through products, prices,
places/locations and integrated promotions
(marketing mix) to produce the desired response in
the target market (Kotler & Armstrong, 2008). The
marketing mix in turn aims to translate brand
expressions into actual products or services, at
certain prices, which will be sold at certain outlets,
to be promoted through communication activities
and certain channels, and must be supported by
certain services (Sicco Van Gelder, 2005:1)
Research on purchasing decisions has been
carried out to date in various industries such as the
fashion industry (Eckman, Damhorst & Kadolp,
1990), the automotive industry (Purwani &
Dharmmesta, 2002), organic food industry
(Balawera, 2013), industry tourism (Khuong, Thi, &
Thanh, 2016), the food and beverage industry
(Salleh, Ariff, Zakuan, Sulaiman, & Saman, 2016),
the industrial industry (Yulindo, 2011) and the
telecommunications industry (Kakar et al., 2017 ).
The results of the study show that certain
products with low purchasing decisions make the
level of trust in the company low and cause the level
of sales to be very dependent on the purchasing
decisions of goods and services produced (Eckman
et al., 1990). Dewi Pujiani's (2014) showed that the
mix marketing (product, price, place, promotion)
influence buying decisions and the most dominant
dimension is promotion. Whereas Alizar Hasan,
Yumi Meuthia, Berry Yuliandra, and Indah Desfita
(2014) showed that for places/locations there was no
754
Dirgantari, P., Hidayat, Y. and Widjajanta, .
Analysis of Purchasing Decisions as a Form of Consumer Brand Responses.
DOI: 10.5220/0009504507540759
In Proceedings of the 1st Unimed International Conference on Economics Education and Social Science (UNICEES 2018), pages 754-759
ISBN: 978-989-758-432-9
Copyright
c
2020 by SCITEPRESS – Science and Technology Publications, Lda. All rights reserved
significant relationship to purchasing decisions and
the most dominant dimension was price and Amelia
Tjahjono's, Prof. Dr. Hatane Semuel, MS. and
Ritzky Karina M. R. Brahmana, S.E., M.A. (2013)
shows that the marketing mix consisting of products,
prices, places and promotions affects the decision to
purchase women's clothing online as well as the
social and psychological environment which is the
variable that has the biggest contribution to
purchasing decisions.
Based on the above phenomena, there appears to
be a research gap so that the factors and/or
dimensions need to be reexamined. Thus, it is
necessary to do research related to purchasing
decisions. This research is limited to the factors that
form the marketing mix such as products,
promotions, prices, and places that influence
purchasing decisions. The assumption used in this
study is the amount of research on similar topics,
especially research on purchasing decisions but
different results.
The purpose of this paper is to obtain findings
regarding: the influence of the marketing mix factors
on purchasing decisions with a meta-analysis
approach, so that the synthesis results can be
obtained as a hypothesis for further testing. The
results of this study are expected to be used as input
for policy makers related to purchasing decisions.
2 METHODOLOGY
A meta-analysis method used to obtain further
information about purchasing decisions that
influenced by marketing mix factors from
articles/studies. Articles/studies are obtained through
databases of online journals such as Science Direct,
Springer, Ingenta Connect, Sage, and Research Gate,
etc. with the year published between 2008 and 2018.
The steps of the meta-analysis in this study are as
follows:
1. Formulating research questions. The
problem in this study is related to purchasing
decisions, especially purchasing decisions and
marketing mix formers namely products,
promotions, prices, and places by formulating the
meaning of these two concepts /defining variables
including their relevance.
2. Gathering existing empirical
studies/research. After formulating research
questions, articles/studies was sought using
keywords that are relevant to the topic of purchasing
decisions that are influenced by the marketing mix
factors. A total of 339 articles were obtained from
this step.
3. Selecting studies. Studies that not provide
sufficient information to calculate general metrics
are excluded from the analysis. Researches with
different methods is also excluded, although the
topic is relevant to the research question. Through
this process, 26 studies/studies were obtained that
were in accordance with the criteria and metric
measures relevant to the research formula.
4. Encoding of selected studies/researches.
After a set of studies selected, the next step is
encoding, obtain characteristics studies/researches,
and input it to a spreadsheet program to manage the
processing of statistics from the meta-analysis.
5. Data analysis. At this step, data extracted
from studies/researches can be the basis for various
calculations to get a summary of the results in the
literature.
6. Interpret and present results.
3 RESULTS AND DISCUSSION
After formulating the research questions and
collecting empirical studies/research a total of 339
articles were subsequently obtained:
1. Transform the value of F
count
and t
count
to the
size of the correlation (r). F
count
and t
count
obtained from 26 selected studies are
transformed into correlation values with the
following formula (Hunter & Schmidt, 2004)
√
2
the results are shown in table 1.
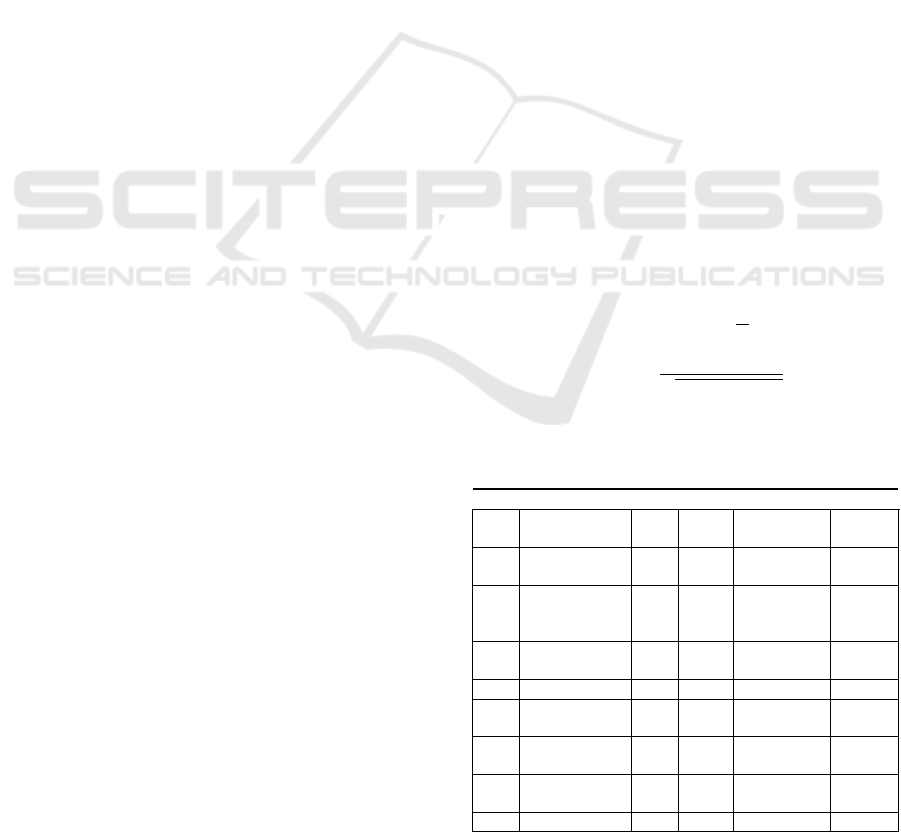
Table 1: Transformation to r value.
No. Author N F
T
1.
(Ahmad, et al.,
2012)
50 13.530 3.678 0.4689
2.
(Andreti, et al.,
2013)
300 5.962 0.3264
3.
(Saidani &
Ramadhan,
2013)
100 21.406 4.627 0.4234
4.
(Ahmadi, et al.,
2010)
100 12.545 0.7850
5. (Agustim, 2010) 69 19.141 4.375 0.4714
6.
(Purnomo, et al.,
2014)
98 16.977 4.120 0.3876
7.
(Mughal, et al.,
2014)
200 0.2090
8.
(Malombeke, et
al., 2014)
75 5.221 0.5214
9. (Hasan, et al., 160 0.2380
Analysis of Purchasing Decisions as a Form of Consumer Brand Responses
755
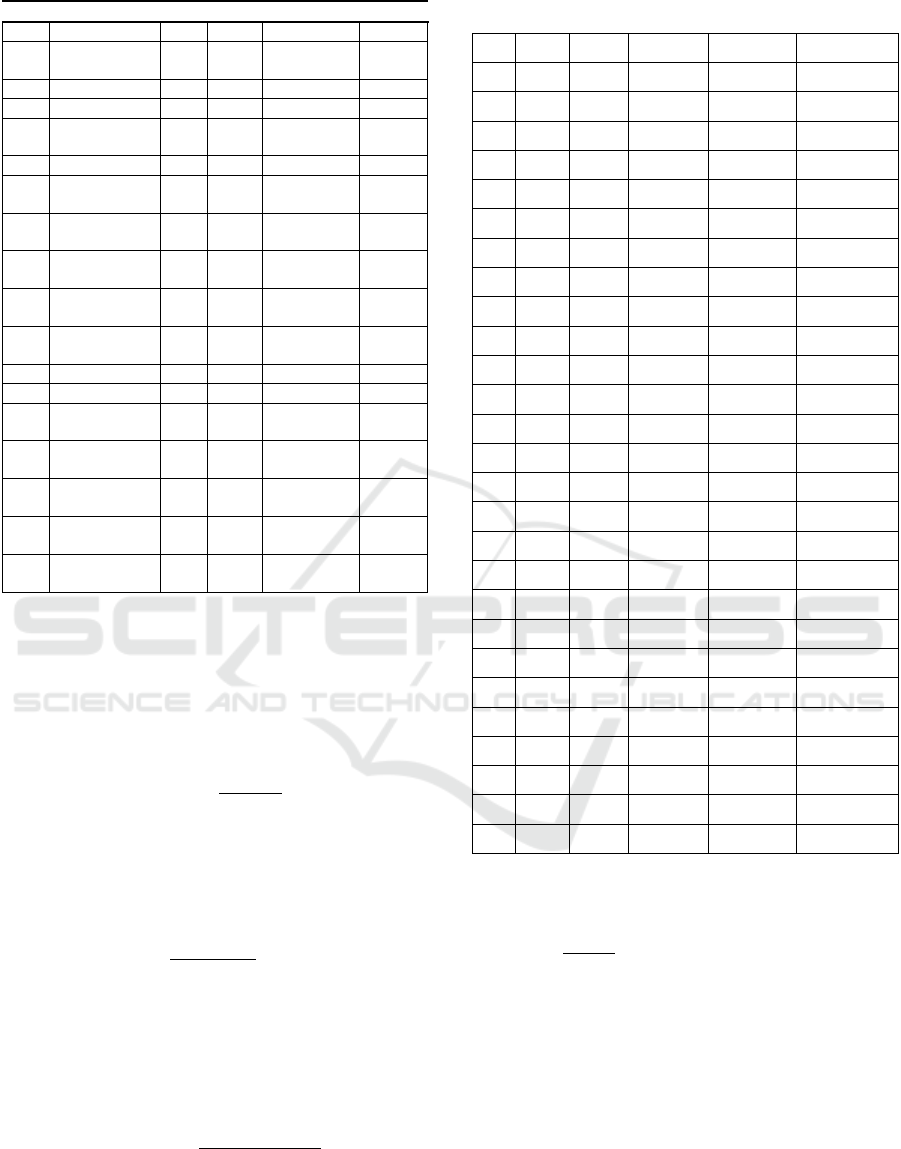
No. Author N F
T
2014)
10.
(Imelda &
Sangen, 2013)
219 0.7800
11. (Miharja, 2013) 96 33.235 5.765 0.5111
12. (Yazia, 2013) 100 16.162 4.020 0.3763
13.
(Tajik & Gorji,
2014)
400 4.280 0.2098
14. (Yosep, 2013) 200 44.099 6.641 0.4268
15.
(Wibowo &
Karimah, 2012)
110 9.087 3.014 0.2786
16.
(Abdullah, et al.,
2013)
150 28.161 5.307 0.3998
17.
(Citrawati &
Sulistiono, 2014)
100 217.684 14.754 0.8304
18.
(Moorthy, et al.,
2014)
71 19.707 4.439 0.4713
19.
(Perdana &
N
anang, 2018)
100 0.4700
20. (Yu, et al., 2017) 173 0.4100
21. (Kenning, 2008) 276 4.009 2.002 0.1201
22.
(Nawawi &
Ikhaz, 2015)
200 22.693 4.764 0.3207
23.
(Aras, et al.,
2017)
100 8.119 0.6341
24.
(Astuti &
Wijaya, 2015)
100 68.216 8.259 0.6406
25.
(Sipayung &
Sinaga, 2017)
384 275.661 16.603 0.6474
26.
(Hasan, et al.,
2016)
94 23.259 4.823 0.4492
2. Calculate estimated population correlation
average (̅). Estimated average population
correlation is obtained by dividing the average
correlation from the selected studies by the
number of samples (Hunter & Schmidt, 2004)
or written in the formula
r̅
∑
N
r
∑
N
with N
is the number of samples in study i and
r
is the correlation in the study i.
From the Table 1, an estimate of the average
population correlation is obtained
r̅
1,699.142
4,025
0.422
3. Calculates the variance of the population
average. Similar to calculate population
correlation averages, the variance of population
averages is obtained by weighted it with the
sample size (Hunter & Schmidt, 2004)
σ
∑
N
r
r̅
∑
N
Calculation of variance from population
averages is obtained through the following table
Table 1: Calculation of Variances of Average Population.
No. N
̅
̅
̅
1
50 0.469 0.047 0.002 0.109
2
300 0.326 (0.096) 0.009 2.747
3
100 0.423 0.001 0.000 0.000
4
100 0.785 0.363 0.132 13.168
5
69 0.471 0.049 0.002 0.167
6
98 0.388 (0.035) 0.001 0.117
7
200 0.209 (0.213) 0.045 9.086
8
75 0.521 0.099 0.010 0.739
9
160 0.238 (0.184) 0.034 5.426
10
219 0.780 0.358 0.128 28.045
11
96 0.511 0.089 0.008 0.759
12
100 0.376 (0.046) 0.002 0.211
13
400 0.210 (0.212) 0.045 18.043
14
200 0.427 0.005 0.000 0.004
15
110 0.279 (0.144) 0.021 2.267
16
150 0.400 (0.022) 0.000 0.075
17
100 0.830 0.408 0.167 16.667
18
71 0.471 0.049 0.002 0.172
19
100 0.470 0.048 0.002 0.229
20
173 0.410 (0.012) 0.000 0.026
21
276 0.120 (0.302) 0.091 25.183
22
200 0.321 (0.101) 0.010 2.060
23
100 0.634 0.212 0.045 4.494
24
100 0.641 0.218 0.048 4.773
25
384 0.647 0.225 0.051 19.487
26
94 0.449 0.027 0.001 0.069
Total
4025 154.123
From the table 2 Calculation of variance from
population averages is obtained
.
,
0.0383
4. Calculates the variance of sampling errors
that obtained from previous step is a
combination of variance in population
correlation and variance in sampling errors, so
that the variance in population correlation must
be corrected by variance in sampling errors. The
variance of sampling errors was formulated as
follows (Hunter & Schmidt, 2004)
1̅
1
UNICEES 2018 - Unimed International Conference on Economics Education and Social Science
756

then the sampling error variance is obtained
10.422
154.8071
0.0044
then, the impact of sampling errors is obtained
0.0044
0.0383
100% 11.488%
Calculate corrected population correlation
variances. After obtaining the sampling error
variance (
) ), then the population correlation
variance is calculated by using the formula
0.03830.0044 0.0339
5. Calculates measurement error correction Y
Measurement errors in a general study occur,
this level of measurement error is measured by
the reliability coefficient of each research
study. The greater reliability coefficient will
produce a small measurement error. Therefore
the population correlation value (r̅obtained in
the second step of analysis needs correction by
involving reliability coefficient in this case on
variable Y. The formula used is
̅
with:
̅
= average measurement error correction
(a) = square root reliability coefficient
Ave(a)= average(a)
to simplify the calculation process, it is
presented in the following table:
Table 3: Reliability Coefficient.
No. r
yy
1
0.718 0.847
2
0.824 0.908
3
0.721 0.849
4
0.896 0.947
5
- -
6
- -
7
0.639 0.799
8
0.867 0.931
9
0.583 0.764
10
- -
11
0.867 0.931
12
- -
13
0.916 0.957
No. r
yy
14
- -
15
0.822 0.907
16
- -
17
- -
18
0.606 0.778
19
- -
20
- -
21
0.891 0.944
22
0.774 0.880
23
- -
24
- -
25
- -
26
0.729 0.854
Total
12.296
Average (
̅
)
0.878
6. Calculate corrected population correlations
Next is to calculate the actual or corrected
population correlation values, namely by using
the following formula (Hunter & Schmidt,
2004)
48.0
878.0/422.0
/
ArAve
Ave
i
so that the corrected population correlation
obtained is equal to 0.48
7. Calculate corrected variance.
The next step is to calculate the number of
squared coefficients of variation (V) using the
following formula (Hunter Schmidt, 2004)
261.0
878.0/449.0
/
22
22
aAveaSDV
Furthermore, variance is calculated due to
variations in artifacts
047.0
261.0878.0480.0
22
222
2
VAS
Analysis of Purchasing Decisions as a Form of Consumer Brand Responses
757

Corrected population correlation variances are as
follows
1187.0
014.0
014.0
878.0/0.047-0.0339
/
2
222
0
SD
AVAVarVar
assuming the correlation effect size is normally
distributed with the confidence level of 95%, the
interval is
248.0)1187.0(96.1
713.0)1187.0(96.1
96.1
lower
upper
SD
The meta-analysis study found that the corrected
population correlation (ρ) between purchasing
decisions and marketing mix factors was estimated
at 0.48, the variance of the population was 0.014 and
the standard deviation was 0.1187. With a
confidence level of 95%, the acceptance limit is
0.248 < ρ < 0.713, then the corrected population
correlation (ρ) of 0.48 enters the acceptance limit.
Thus, referring to the results of the analysis of
meta-analysis study data regarding the influence of
the marketing mix factors on acceptable purchasing
decisions.
The purchase process occurs when consumers
search for information, compare existing
alternatives, then make purchasing decisions for a
product (Neha & Manoj, 2013), because consumers
before making a purchase decision, will usually
spend time evaluating by looking at suggestions,
reviews or reviews. what consumers have done
before on the product or service that will be bought
(Sciences, 2013). This is where the right time the
company provides marketing stimuli that can be
controlled through products, prices, places and
integrated promotions (marketing mix) to produce
the desired response in the target market (Kotler &
Armstrong, 2008).
4 CONCLUSIONS
Referring to the results of analysis of meta-analysis
study data on the influence of the marketing mix (the
forming factors & marketing mix such as product,
price, place and promotion) on purchasing decisions
shows that the hypothesis states that there is an
influence of the marketing mix (products, prices,
places and promotions) towards purchasing
decisions.
Whereas to minimize the impact of sampling
errors, it is recommended that in future studies be
able to pay attention to the characteristics of the
manufacturing or service industry as well as offline
or online.
ACKNOWLEDGEMENT
The researcher would like to thank the Lembaga
Penelitian dan Pengabdian kepada Masyarakat of
Universitas Pendidikan Indonesia, Bandung who
supports the study.
REFERENCES
Abdullah, M., Kalam, A. & Akterujjaman, S., (2013).
Packaging Factors Determining Consumer Buying
Decision. International Journal of Humanities and
Management Sciences (IJHMS) Volume 1, Issue 5, pp.
285-289.
Agustim, W., (2010). ANALISA PENGARUH BRAND
IMAGE TERHADAP KEPUTUSAN KONSUMEN
DALAM PEMBELIAN SEPEDA MOTOR HONDA.
MODERNISASI, Volume 6, Nomor 3, pp. 196-204.
Ahmadi, A. Y., Syahlani, S. P. & Haryadi, F. T., (2010).
THE EFFECT OF CONSUMER PERCEPTION ON
PRODUCT ATTRIBUTES TO ATTITUDE
TOWARD PRODUCT AND REPEAT PURCHASE
INTENTION : Empirical Study on Decision Making
of Frozen Processed Meat Product. Buletin Peternakan
Vol. 34(2), pp. 131-137.
Ahmad, N., Billoo, M. & Lakhan, A., (2012). Effect of
Product Packaging on Consumer Buying Decision.
JOURNAL OF BUSINESS STRATEGIES, pp. 1-10.
Andreti, J., Zhafira, N. H., Akmal, S. S. & Kumar, S.,
(2013). The Analysis of Product, Price, Place,
Promotion and Service Quality on Customers’ Buying
Decision of Convenience Store: A Survey of Young
Adult in Bekasi, West Java, Indonesia. International
Journal of Advances in Management and Economics
Vol 2 Issue 6, pp. 72-78.
Aras, M. et al., (2017). The Effect of Service Marketing
Mix on Consumer Decision Making. The 1st
International Conference on Education, Science, Art
and Technology (the 1st ICESAT), pp. 108-112.
Astuti, R. & Wijaya, R. L. R. S. G. D. P., (2015).
Marketing Strategy Based on Marketing Mix Influence
on Purchasing Decisions of Malang Apples
Consumers at Giant Olympic Garden Mall (MOG),
Malang City, East Java Province, Indonesia.
UNICEES 2018 - Unimed International Conference on Economics Education and Social Science
758

Agriculture and Agricultural Science Procedia 3 , pp.
67-71.
Citrawati, D. & Sulistiono, (2014). Pengaruh Bauran
Pemasaran Jasa Terhadap Keputusan Pembelian.
Marketing Mix, pp. 19-28.
Hasan, A., Meuthia, Y., Yuliandra, B. & Desfita, I.,
(2014). ANALISIS HUBUNGAN BAURAN
PEMASARAN TERHADAP KEPUTUSAN
PEMBELIAN SMARTPHONE BLACKBERRY
DAN SAMSUNG ANDROID. Jurnal Optimasi
Sistem Industri, Vol. 13 No. 2, pp. 687-706.
Hasan, S., Wahid, M. & Basalamah, M., (2016).
Marketing Mix Effect on the Decision of Customers in
The Matter In Choosing The Home Purchase Loans In
Pt.Bni 46 Griya Bni (Persero) Tbk Branch Makassar.
International Journal of Business and Management
Invention ISSN (Online): 2319 – 8028, ISSN (Print):
2319 – 801X, pp. 20-30.
Hunter, J. E. & Schmidt, F. L., (2004). Methods of Meta
Analysis: Correcting Error and Bias in Research
Finding. California: Sage Publications.
Imelda, S. & Sangen, M., (2013). Pengaruh Keputusan
Bauran Promosi Terhadap Pengambilan Keputusan
Pembelian Nomor Perdana Telkom Flexi di Kota
Banjarmasin. Jurnal Wawasan Manajemen, Vol. 1,
Nomor 2, pp. 259-279.
Kenning, P., (2008). The influence of general trust and
specific trust on buying behaviour general.
International Journal of Retail & Distribution
Management, pp. 461-479.
Malombeke, S., Saerang, D. P. E. & Pangemanan, S. S.,
(2014). THE IMPACT OF PROMOTIONAL TOOLS
ON CONSUMER BUYING BEHAVIOR AT
MATAHARI DEPARTMENT STORE MANADO
TOWN SQUAR. Jurnal EMBA Vol.2 No.1, pp. 48-56.
Miharja, K., (2013). PENGARUH BAURAN
PEMASARAN TERHADAP KEPUTUSAN
PEMBELIAN DI PUSAT GROSIR CILILITAN.
Jurnal MIX, Volume III, No. 2, pp. 189-197.
Moorthy, R. R., Kumar, D. S. A. & Haresh, R., (2014).
Impact of Pricing Elements on Customer Purchase
Decision for Health Insurance Product. TSM Business
Review, Vol. 2, No. 1, pp. 47-56.
Mughal, A., Mehmood, A., AmmarMohi-ud-deen &
Ahmad, B., (2014). The Impact of Promotional Tools
on Consumer Buying Behavior: A Study from
Pakistan. Journal of Public Administration and
Governance ISSN 2161-7104 2014, Vol. 4, No. 3 , pp.
402-414.
Nawawi, M. T. & Ikhaz, M. S., (2015). THE FACTORS
THAT INFLUENCE CONSUMER DECISIONS IN
PURCHASING PRODUCTS IN ALFAMART
MINIMARKET IN PINANG, A SUBDISTRICT OF
TANGERANG. BINUS BUSINESS REVIEW Vol. 6
No. 3, pp. 486-497.
Perdana, K. E. & Nanang, W., (2018). PURCHASE
DECISION OF CHEMICAL COMPOUND
FERTILIZERS BY WHITE PEPPER FARMERS.
RJOAS, 4(76), pp. 287-295.
Purnomo, A. D., Hadi, S. P. & Prabawani, B., (2014).
THE EFFECT OF DIFFERENTIATION AND
PROMOTION TOYOTA AVANZA. DIPONEGORO
JOURNAL OF SOCIAL AND POLITIC , pp. 1-8.
Saidani, B. & Ramadhan, D. R., (2013). PENGARUH
IKLAN DAN ATRIBUT PRODUK TERHADAP
KEPUTUSAN PEMBELIAN SMARTPHONE
SAMSUNG SERI GALAXY (SURVEI PADA
PELANGGAN ITC ROXY MAS). Jurnal Riset
Manajemen Sains Indonesia (JRMSI)│Vol. 4, No. 1,
pp. 53-73.
Sipayung, M. L. & Sinaga, A. H., (2017). Marketing Mix
Effect and Quality Product Purchase Decision onRice
Pandaraman in South Tapanuli Region. IOSR Journal
of Business and Management (IOSR-JBM) , pp. 85-89.
Tajik, G. & Gorji, M. B., (2014). Relationship of
Marketing Mix with Online Purchase Intention and
Intermediary Role of Brand Equity. Applied
mathematics in Engineering, Management and
Technology, pp. 509-517 .
Wibowo, S. F. & Karimah, M. P., (2012). PENGARUH
IKLAN TELEVISI DAN HARGA
TERHADAPKEPUTUSAN PEMBELIAN SABUN
LUX (SURVEI PADA PENGUNJUNG MEGA
BEKASI HYPERMALL). Jurnal Riset Manajemen
Sains Indonesia (JRMSI) |Vol. 3, No. 1, pp. 1-15.
Yazia, V., (2013). PENGARUH KUALITAS PRODUK,
HARGA DAN IKLAN TERHADAP KEPUTUSAN
PEMBELIAN HANDPHONE BLACKBERRY.
Journal of Economic and Economic Education Vol.2
No.2, pp. 165-173.
Yosep, L., (2013). PENGARUH HARGA DAN
PROMOSI TERHADAP KEPUTUSANKONSUMEN
DALAM PEMBELIAN CAT MEREK MOWILEK DI
JAKARTA. Jurnal MIX, Volume III, No. 3, pp. 373-
383.
Yu, L. et al., (2017). The role of individual colour
preferences in consumer purchase. Wiley: Color Res
Appl.2017, pp. 1-10.
Yulindo, Kenshi Poneva. (2011). Pengaruh Atribut-
Atribut Produk Terhadap Keputusan Pembelian Green
Product Cosmetics Sariayu Martha Tilaar di Kota
Padang.
Analysis of Purchasing Decisions as a Form of Consumer Brand Responses
759
