
Corporate Financial Performance Assessment using Economic Value
Added Method
Nurliyani
1
, Lisa Aisah
1
and Tiya Mardiyati Dalimunthe
1
1
Departement of Accounting, Universitas Negeri Medan, Medan -Indonesia
Keywords: Financial Performance, Financial Statements, EVA.
Abstract: The purpose of this study is to find out the financial performance of PT Jaya Agra Wattie Tbk in 2015 up to
2017 based on the EVA method. This research uses descriptive analysis method. Data sources in the form of
financial statements of PT Jaya Agra Wattie Tbk for the period 2015-2017 were obtained from the
Indonesia Stock Exchange website. From data analysis based on EVA method shows poor performance
because for 2 years EVA company research shows a negative value (EVA<0), and 1 year the company
shows a positive value (EVA>0). In 2015 positive EVA value of Rp.7.460.451.257 shows that the company
is able to create added value for its shareholders. While the year 2016 to 2017 was less good, where
EVA<0,2016 amounted EVA -Rp.68,025,625.37. Then in 2017 the EVA value decreases to -Rp.
225,973,196,925. this indicates that the company has not been able to create added value for its
shareholders.
1 INTRODUCTION
Economic conditions in Indonesia that are constantly
changing and not fixed with the development of
technology make a company continue to compete to
maintain the existence of its company. This
condition requires a company to make
improvements in various fields. One of them is in
finance.
Every company established aims to gain profits
or profits and maximize the wealth of its
shareholders. Besides that, it also aims to maintain
the survival of the company properly so that the
company can develop in accordance with the
activities carried out in the future (Neysa, 2017).
Financial management has an important role in
managing the company's finances, so financial
management is required to carry out its functions
effectively. The management of the company in
carrying out its business requires a financial
performance measurement tool to evaluate its
company (Dewi, 2017). According to (Fahmi, 2013),
financial performance is an analysis conducted to
see the extent to which a company has implemented
it using the rules of financial implementation
properly and correctly. The measurement of the
company's financial performance arises as a result of
the management decision-making process. This is a
more complex job because it will involve the
effectiveness of the use of capital, efficiency and
profitability of the company.
Assessing financial performance by using
financial ratios only oriented to profit oriented , but
at this time the company is required not only to be
profit oriented but also to be value oriented . To
overcome these weaknesses, the Economic Value
Added method is used (Dewi, 2017).
According to (Sawir, 2001) EVA (Economic
Value Added) is an indicator of the addition of the
value of an investment. EVA (Economic Value
Added) shows a good measure to what extent the
company has added value to the owners of the
company. In other words, if management focuses on
EVA (Economic Value Added), then they will make
decisions that are consistent with the aim of
maximizing the prosperity of the owner of the
company. If EVA (Economic Value Added) value is
positive, then operating profit after tax exceeds the
capital cost needed to generate the profit, and
management actions add value to shareholders
(Iswandira, 2015).
Application of Economic Value Added (EVA) in
a company will focusing more on the creation of
corporate value, this is one of the hallmarks of
Economic Value Added. With this approach,
1090
Nurliyani, ., Aisah, L. and Dalimunthe, T.
Corporate Financial Performance Assessment using Economic Value Added Method.
DOI: 10.5220/0009504210901096
In Proceedings of the 1st Unimed International Conference on Economics Education and Social Science (UNICEES 2018), pages 1090-1096
ISBN: 978-989-758-432-9
Copyright
c
2020 by SCITEPRESS – Science and Technology Publications, Lda. All rights reserved
shareholders can see how much value the company
has achieved.
PT Jaya Agra Wattie Tbk. or commonly
abbreviated as JAWA is one company that is
engaged in agribusiness. JAWA was listed on
Indonesia Stock Exchange in 2011 under the Main
Board. The company was founded in 1921 and based
in Jakarta, Indonesia. The company operates in the
cultivation, processing, agricultural logistics and
marketing activities of rubber, crude palm oil (CPO),
coffee and tea.
The PT Jaya Agra Wattie Tbk profit (loss)
report, based on the 2015 to 2017 financial
statements, can be seen in the following table 1:
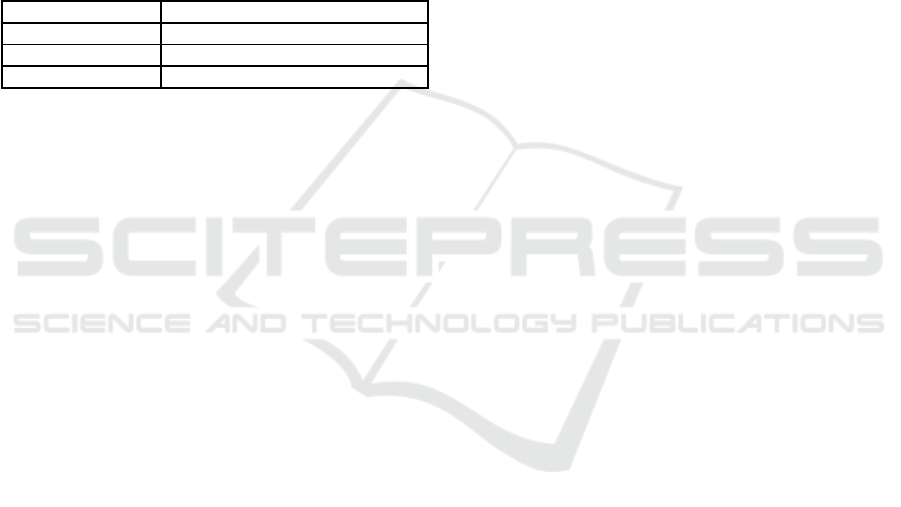
Table 1: The Profit (Loss) Report is presented in Rupiah.
Year Loss
2015 ( 11,715,503,160)
2016
(225.132,640,088)
2017
(199,929,077,450)
Source: Financial Statements of PT Jaya Agra Wattie Tbk.
From table 1, it can be seen that PT Jaya Agra
Wattie Tbk from 2015 to 2017 continues to suffer
losses. This continuous loss of the company will
make the company considered bad in earning profits
and bankruptcy can occur, thus financial
performance analysis is needed to evaluate the
company's performance in financial terms. The aim
to be achieved in this study is to find out the
financial performance of PT Jaya Agra Wattie Tbk
using the Economic method Value Added (EVA).
2 THEORICAL FRAMEWORK
Analyzing financial statements means digging up
more information contained in a financial report.
Definition of financial statement analysis according
to (Harahap, 2011) Outlines financial statement
posts into smaller units of information and see their
relationships that are significant or that have
meaning between one another between quantitative
data and non-quantitative data with the aim of
knowing deeper financial conditions that are very
important in the process of producing the right
decisions.
(Fahmi, 2013) financial performance is an
analysis carried out to see the extent to which a
company has implemented it using the rules of
financial implementation properly and correctly.
Financial Performance Assessment can be assessed
by calculating financial ratios. It can be concluded
that financial performance is an assessment
conducted to determine the extent to which the
condition of the company is by using comparisons
and applicable rules (Tanor, 2015).
The purpose of evaluating the performance of a
company according to (Sucipto, 2007) is as follows:
1. Manage organization operations effectively and
efficiently through maximum employee
motivation. In managing the company,
management determines the goals to be achieved
in the future and in the process is called
planning.
2. Helping decision making concerned with
employees such as promotions, transfers and
dismissals. Performance appraisal will produce
data that can be used as the basis for making
decisions related to employees who are judged
based on their performance.
3. Identify employee training and development
needs and to provide selection and evaluation
criteria for employee training programs. If
topmanagement does not recognize the
shortcomings and weaknesses it has, it is difficult
for management to evaluate and select employee
training programs that are in line with employee
needs.
4. Provide feedback for employees about how their
supervisors assess their performance. In
corporate organizations, management over
delegates part of its authority to management
under them.
5. Providing a basis for the distribution of awards.
The results of these measurements can also be
used as evaluation tools for management
performance so far whether they have worked
effectively or not.
Along with the development of theory and
knowledge, there are many new ideas in the field of
financial management to measure the financial
performance of a company. One of them is
Economic Value Added (EVA) that measures the
performance of companies by taking into account
the important role of funders (creditors and
shareholders).
According to (Young, and O’Byrne, 2001) "EVA
is an effective communication tool both for value
creation that can be reached by line managers which
ultimately drives the company's performance and to
connect with the capital market". EVA is able to
calculate the actual economic profit or True
Economic Profit of a company in a given year and is
very different compared to accounting profit.
According to (Hansen, and Mowen, 2009) "EVA
is the residual profit with the cost of capital equal to
the actual capital cost of the company (instead of a
Corporate Financial Performance Assessment using Economic Value Added Method
1091

minimum rate of return desired by the company for
other reasons)".
(Rudianto, 2006) in EVA, the assessment of
financial performance is measured by the following
provisions:
1. If EVA>0, then the company's financial
performance can be said to be good, so that there
is a process of changing its economic value.
2. If EVA=0, then the company's financial
performance is economically break-even.
3. If EVA<0, then the company's financial
performance is said to be less good because the
profits obtained do not meet the expectations of
funders, so there is no additional economic value
to the company.
The purpose of implementing EVA is expected
to get a more realistic calculation of the company's
economic value. This is caused by EVA calculated
based on the calculation of capital costs that use
market value based on the interests of creditors,
especially the shareholders and not based on
historical book values.
3 RESEARCH METHOD
This research uses a descriptive method. The object
of research is PT Jaya Agra Wattie Tbk. Which is
one of the companies engaged in agribusiness that is
listed on the Indonesia Stock Exchange. The source
through the website https://www.jawattie.com/ is in
the form of information that is in the form of
numbers and financial statements of PT Jaya Agra
Wattie Tbk for the period 2015-2017 obtained from
the Indonesia Stock Exchange.
The analysis tool used is Economic Value Added
(EVA). The steps in calculating EVA are as follows:
1. Calculate Economic Value Added (EVA). With
formula used (Sartono, 2010) :
EVA = NOPAT - ( WACC x Invested Capital)
2. Determine Net Operating Profit After Tax
(NOPAT). The formula used (Brigham and
Houston, 2010):
NOPAT = EBIT (1 - T )
Information:
NOPAT = Net Operating Profit After Tax
EBIT = Earnings Before Interest and Tax
T = Tax Level
3. Capital Costs (Capital Charges). The formula
used is as the following (Margaretha, 2011): Cost of
Capital = Invested Capital x WACC
a. WACC counted with formula (Margaretha,
2011):
WACC = W d K d + W e K e
W d = Total liabilities / Total liabilities + Equity
We = Total equity / Total liabilities + Equity
Information:
WACC = Weighted Average Cost of Capital
Wd = Amount of Debt to Structure Capital
We =Amount of Capital to Structure Capital
K d = cost of debt
K e = cost of equity
1) Cost Debt (Cost of Debt) To calculate the debt
costs of a company are as follows (Margaretha,
2011):
K d = k dbt (1 - T )
kdbt = interst expense/ long term debt
T = tax expense / net profit before tax x 100%
Information:
K d= After-tax debt costs
K dbt = interest expense before tax debt
T = Tax rate
2) Cost Equity (Cost of Equity) According to
(Prawiranegoro, 2008), cost of equity could
searching for with use ROE (Return On Equity).
ROE can searching for with use formula :
k e= ROE = net income after tax / total equity
b. Invested Capital (Invested Capital) With the
following formula (Young, and O’Byrne, 2008):
Invested capital = long-term debt + equity
4 ANALYSIS
In order to analyze and assess the financial
performance of PT Jaya Agra Wattie Tbk, economic
value added (EVA) is used. To calculate EVA, the
financial data needed is:
1. NOPAT ( Net Operating Profit After Tax )
2. WACC ( Weight Average Cost of Capital )
3. Total Capital that Invested (Invested Capital )
UNICEES 2018 - Unimed International Conference on Economics Education and Social Science
1092
a. NOPAT Analysis ( Net Operating Profit After
Tax )
NOPAT calculation results of PT Jaya Agra Wattie
Tbk as shown in the table below this :
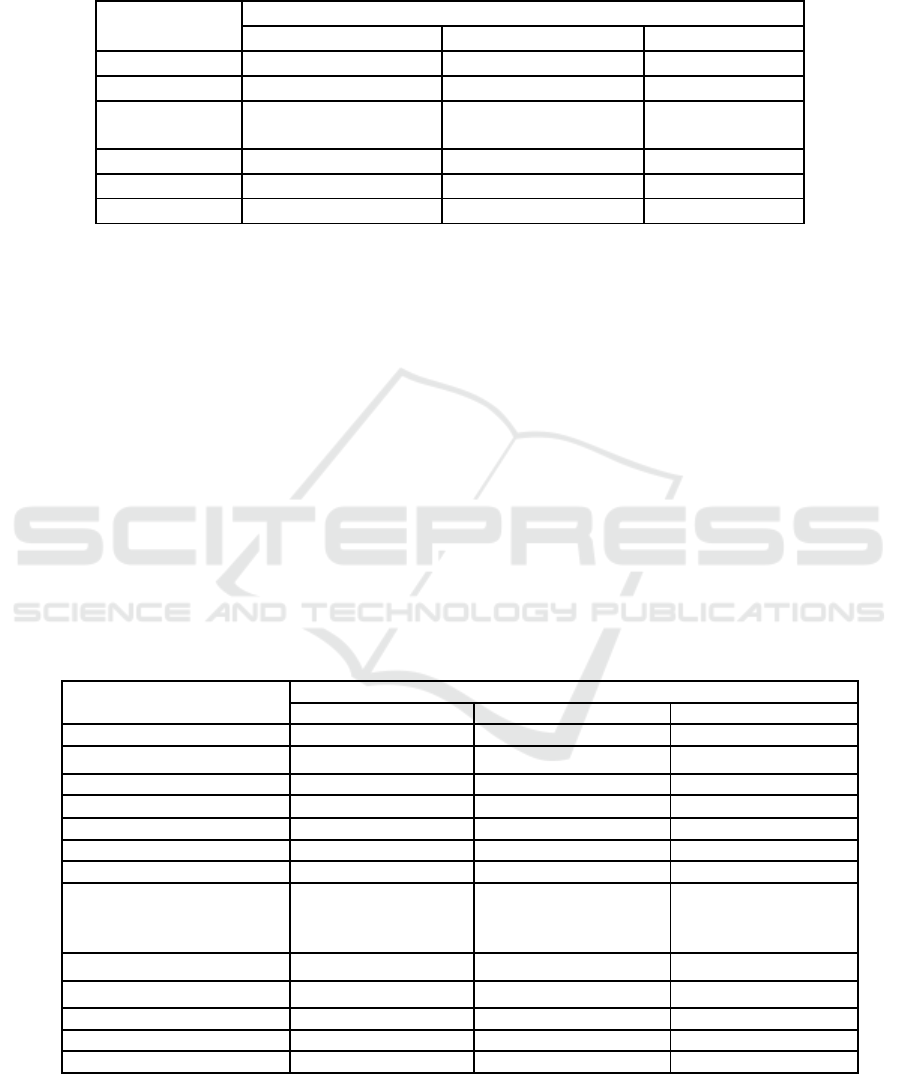
Table 2: Calculation of NOPAT 2015 – 2017 (expressed in Rupiah).
NOPAT
Year
component
2015 2016
2017
EBIT
76,593,643,005
4.103.437.116
1,422,183,930
Tax expense
(8,916,814,827)
(2,576,736,349) 34,321,928,850
Profit before
tax
-2,798,688,333
-
222,555,903,739
-
234,251,006,300
Tax
76.11%
1.14% -17.17%
1- Tax 0.24 0.99
1.17
NOPAT
18,297,270,901
4,056,471,578
1,666,330,986
Source: PT. Jaya Agra Wattie Tbk. Processed (2018).
Based on the NOPAT (Net Operating Profit
After Tax) calculation in the table above, it indicates
that the value of NOPAT of PT Jaya Agra Wattie
Tbk in 2015 amounted to Rp.18,297,270,901 in
2016 NOPAT decreased to Rp.4,056,471.578, this
decrease is due to a decrease in Earning Before
Interest Tax from Rp.76,593,643,005. in 2015
became Rp.4,103,437,116 in 2016. Then in 2017
NOPAT PT. Jaya Agra Wattie Tbk again
experienced a significant decline to
Rp.1,666,330,986, this is because PT. Jaya Agra
Wattie Tbk has decreased again or in other words
obtained EBIT (Earning Before Interest Tax) of
Rp.1,422,183,930.
Based on the description above it can be seen
that from 2015 to 2017 the NOPAT company
experienced a decline. The company's operating
profit can be increased without additional capital,
meaning that management can use the company's
assets efficiently to make a profit optimal.
b. WACC (Weight Average Cost of Capital)
Analysis
After calculating NOPAT , the second step in
calculating EVA is calculating the company's
WACC. The weight in the average cost of capital is
measured by the target capital structure of the
company, which is the proportion of various
components of the company's capital for its
investment funds. The results of the WACC
calculation of PT Jaya Agra Wattie Tbk as shown in
the table below:
Table 3: WACC calculations 2015 - 2017 (expressed in Rupiah).
Component
Year
WACC
2015 2016
2017
Interest expense
79,392,331,338 226,659,340,855
235,673,190,230
Long-term Liabilities
1,626,712,445,984
1,594,844,261,850 1,197,888,515,756
Tax
76.11%
1.14% -17.17%
1- Tax 0.24 0.99
1.17
K d 1.17% 14.05%
23.05%
Total Amoun of debt
2,078,210,962,892
2,240,797,394,458 2,472,502,548,901
Total Equity
1,289,940,799,377
1,050,319,497,420 839,979,442,737
Total Amoun of debt +
Total
3,368,151,762,269
3,291,116,891,878 3,312,481,991,638
Equity
W
d
61.70%
68.09%
74.64%
W
e
38.30%
31.91%
25.36%
Net profit after tax (11,715,503,160)
(225.132,640,088) (199,929,077,450)
ROE -0.91%
-21.43%
-23.80%
WACC 0.37% 2.73%
11.17%
Source: PT. Jaya Agra Wattie Tbk. Processed (2018),
Based on WACC calculation in table 3,it appears
that the weighted average cost or WACC PT Jaya
Agra Wattie Tbk in 2015 that is equal to 0.37%.
WACC in 2016 an increase of 2.73% and 2017
Corporate Financial Performance Assessment using Economic Value Added Method
1093
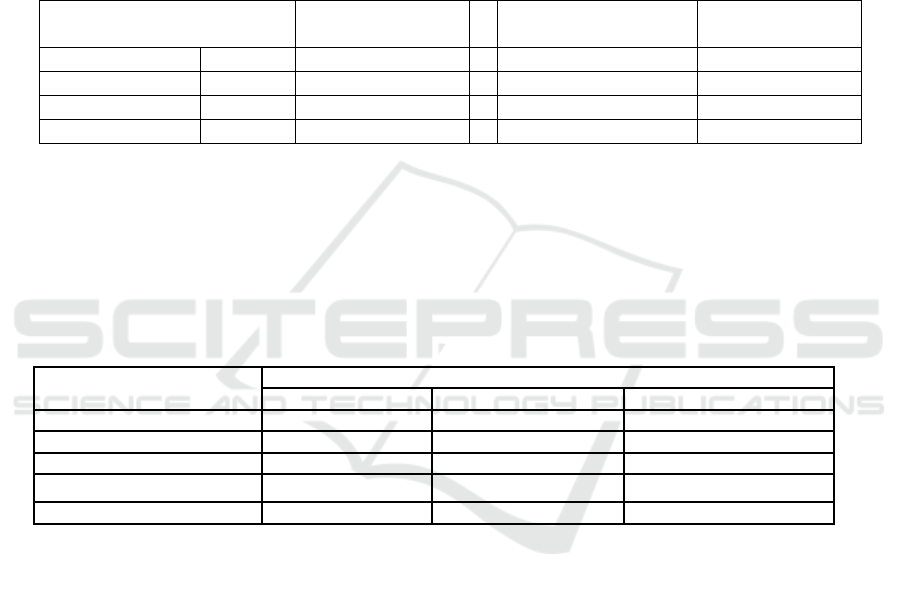
WACC has increased significantly to 11.17%, this
was due to a decline in the cost of equity in this case
ROE the company becomes -23.80%.
Based on the description above, it can be seen
that from 2015 to 2017 the company has not
succeeded in reducing the weighted average capital
cost (WACC). This will make the company produce
a negative EVA so that it can not provide economic
added value for the company. A company can
increase its economic added value if it gets a greater
return than WACC.
c. Analysis of Total Capital Invested (Invested
Capital)
Furthermore, the third step in the calculation of EVA
is to calculate the company's invested capital .
The results of the calculation of PT Jaya Agra
Wattie Tbk 's Invested Capital as shown in the table
below:
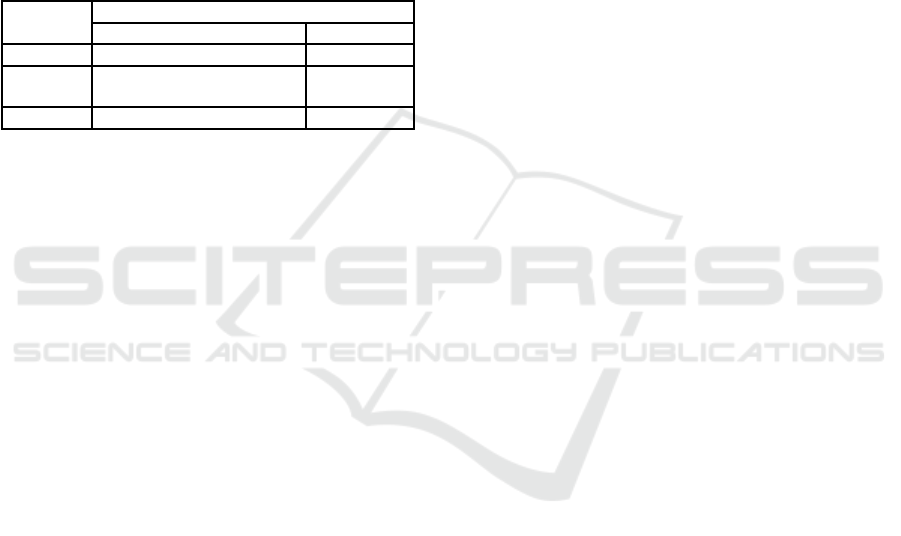
Table 4: Invested Capital calculations 2015 - 2017 (expressed in Rupiah)
Invested Capital
Component
Year
2015 2016 2017
Long-term debt
1,626,712,445,984
1,594,844,261,850
1,197,888,515,756
Equity
1,289,940,799,377
1,050,319,497,420
839,979,442,737
Invested Capital
2,916,653,245,361
2,645,163,759,270
2,037,867,958,493
Source: PT. Jaya Agra Wattie Tbk. Processed (2018).
Based on calculations, Table 4 explains that
Invested Capital (IC) PT. Jaya Arga Wattie Tbk in
2015 which is Rp.2,916,653,245,361. For 2016 the
IC has decreased to Rp.2,645,163,759,270. In 2017
IC PT. Jaya Arga Wattie Tbk which again decreased
to Rp.2,037,867,958,493.
From this explanation shows that the total capital
invested in the year 2015 until 2017 has decreased.
This is due to the decrease in the number of loans
and equity
Table 5: Calculation of EVA 2015 - 2017 (expressed in Rupiah).
Component EVA
Year
2015 2016 2017
NOPAT
18,297,270,901
4,056,471,578 1,666,330,986
WACC 0.37% 2.73%
11.17%
Invested Capital 2,916,653,245,361 2,645,163,759,270 2,037,867,958,493
Capital Costs (WACC x IC)
10,836,819,644 72,082,096,950 227,639,527,911
EVA 7,460,451.257 -68,025,625,372
-225,973,196,925
Source: PT. Jaya Agra Wattie Tbk. Processed (2018).
d. EVA Analysis (Economic Value Added)
After the calculation of NOPAT, WACC and
Incested Capital (IC). Furthermore, the value of the
company EVA can be calculated . Economic Value
Added (EVA) is the remaining profit after deducted
by all capital costs used to generate profits (Sartono,
2010).
The results of the calculation of EVA PT. Jaya
Arga Wattie Tbk as shown in table 5 below. Based
on the results of the EVA calculation in Table 5
shows that the value of EVA PT. Jaya Arga Wattie
Tbk in 2015 was Rp.7,460,451.257 positive EVA
values indicate that the management of PT. Jaya
Arga Wattie Tbk is able to create added value for its
shareholders. In 2016 the value of EVA negative ie -
Rp.68,025,625,372 due to an increase in the WACC
to 2.73%, so that the cost of capital is greater than
the operating profit after tax, the management of PT.
Jaya Arga Wattie Tbk has not been able to create
added value for its shareholders. In 201 7 EVA
value has a significant decrease and is still negative,
namely –Rp.225,973,196,925, which was caused by
a decrease in NOPAT to Rp.1,666,330,986, the
management of PT. Jaya Arga Watitie Tbk has not
been able to create added value for its shareholders.
From this explanation it can be concluded that in
the year 2015 the company produced the value of
EVA>0, meaning EVA is positive That is because
the company is able to generate a return on operating
profit after tax that exceeds the cost of capital. But in
2016 to 2017 the company produces an value
EVA<0, meaning EVA is negative because the
company is unable to produce a return on operating
profit after tax that exceeds the cost of capital.
UNICEES 2018 - Unimed International Conference on Economics Education and Social Science
1094
Negative EVA indicates that the company has not
been able to create value added wealth of the
company and its shareholders.
5 RESULTS
In this study, performance appraisal measured using
the EVA (Economic Value Added) method can be
restated in a summary of the results of EVA
calculations derived from table 2 and table 5
displayed again in table 6:
Table 6: Calculation of Company Performance 2015 –
2017 (expressed in Rupiah):
Information
Year
2015 2016 2017
NOPAT
18,297,270,9014,056,471,578 1,666,330,986
Capital
10,836,819,64472,082,096,950
227,639,527,911
Costs
EVA
7,460,451.257
-68,025,625,372 -25,973,196,925
Source: Table 2 and Table 5, processed (2018).
Based on Table 6, it can be seen that the
fluctuations in the NOPAT value achieved by PT.
Jaya Arga Wattie Tbk from 2015 continued to
decline until 2017. The decline in NOPAT
companies from 2015 to 201 6 reached by 78%.
NOPAT then again decreased in 2017 by 59%.
Capital costs at PT. Jaya Arga Wattie Tbk from
2015 to 2016 there was an increase of 85%. And
from 2016 to 2017 capital costs have increased again
by 68.3%. The cost of capital incurred by the
company is greater than the operating profit after tax
achieved by the company. This is what resulted in
the value of EVA at PT. Jaya Arga Wattie Tbk is
worth negative.
EVA achieved by PT. Jaya Arga Wattie Tbk in
2015 of Rp.7,460,451.257 . Then in 2016 until 2017
there was a drastic decrease of -232% from -Rp.
68,025,625,372 to –Rp.225,973,196,925. The EVA
value achieved by PT. Jaya Arga Wattie Tbk is
EVA<0, which means EVA is negative because the
after-tax operating profit (NOPAT) is smaller than
the capital cost (WACCx IC) resulting in a negative
EVA (Sawir, 2009).
Based on EVA calculations from the year 2015-
2017, company management has not been able to
create a positive EVA value, which means the
company has not been able to increase operating
profit after tax and the company has not been able to
reduce the cost of capital. Although the value of
EVA is still negative, but by entering EVA values
into the company's financial statements, investors
can see the true value of the company. To be able to
create added value the company can be done by
means of companies must be able to increase
operating profit without additional capital. Because
if NOPAT increases while the cost of fixed capital,
then the company EVA increase.
The results of the research on the development of
Teaching Materials for Problem Based Learning
Strategy include: 1) student worksheet; 2) learning
strategy material; and 3) problem-based evaluation
instruments.
Student worksheets are developed to help
students understand the teaching material for
learning strategies. Student worksheets are designed
to adopt problem-based learning steps which
include: 1) problem orientation; 2) learning
organization; 3) individual or group investigations;
4) development and presentation of problem solving
results; 5) analysis and evaluation of the problem
solving process.
Teaching materials designed include: 1) learning
theory in learning; 2) basic concepts of learning
strategies; 3) 21st century learning strategies; 4)
learning approach; 5) learning methods and
techniques; 6) learning models; 7) teaching factory;
8) strengthening character education.
Evaluation instruments designed include: 1)
problem-based problem instruments; and 2)
assessment guidelines.
6 CONCLUSIONS
Based on the results of research and discussion
conducted by researchers at PT. Jaya Arga Wattie
Tbk, it can be concluded that company performance
based on analysis of Economic Value Added (EVA)
from 2016 to 2017 is not good , where EVA<0, that
is, for 2 consecutive years EVA companies show
negative values. In 2016 the EVA value was -Rp.
68,025,625.37. Then in 2017 the EVA value
decreases to –Rp.225,973,196,925 .
Value EVA<0, which means EVA is negative
because the company is unable to produce a return
on operating profit after tax that exceeds the cost of
capital. This means that the company's management
has not been able to create added value for the
company and has not been able to create added value
for shareholders.
Corporate Financial Performance Assessment using Economic Value Added Method
1095

REFERENCES
Brigham, Eugene and Houston, Joel F. (2010) Financial
Management. jakarta: Erlangga.
Dewi, M. (2017) ‘Penilaian Kinerja Keuangan Perusahaan
dengan Menggunakan Metode EVA (Economic Value
Added) (Studi Kasus pada PT. Krakatau Steel Tbk
Periode 2012-2016)’, Jurnal Manajemen dan
Keuangan, 6(1), pp. 648–659.
Fahmi, I. (2013) Analysis of Financial Statements.
bandung: alfabeta.
Hansen, Dor R and Mowen, M. (2009) Managerial
Accounting. jakarta: Salemba Empat.
Harahap, S. S. (2011) Critical Analysis of the First Edition
of Financial Statementso. jakarta: PT. Raja Grafindo
Persada.
Iswandira, A. Nurhayati, I. dan Suharti, T. (2015)
‘Analisis Economic Value Added (Eva) Dan Market
Value Added (Mva Sebagai Alat Untuk Mengukur
Kinerja Keuangan Perusahaan Pt.Indofood Sukses
Makmur Tbk.’, jurnal ilmiah inovator.
Margaretha, F. (2011) Financial Management for Non-
Financial Managers. jakarta: Erlangga.
Neysa, Irena A. Murni, S dan Tumiwa, J. (2017) ‘Analisis
Kinerja Keuangan Dengan Menggunakan Metode
Economic Value Added (Eva) Pada Perusahaan Plastik
Dan Kemasan Yang Terdaftar di Bursa Efek Indonesia
Periode Tahun 2011-2015’, jurnal EMBA, 5(2), pp.
433–442.
Prawiranegoro, and Purwati. (2008) Management
Accounting. 2nd edn. jakarta: Mitra Wacana Media.
Rudianto (2006) Management Accounting. jakarta:
Gransindo.
Sartono, A. (2010) Financial Management Theory and
Application. Yogyakarta: BPFE.
Sawir, A. (2001) Financial Performance Analysis and
Corporate Financial Planning. jakarta: PT Gramedia
Main Library. Sucipto (2007) Financial Performance
Assessment. jakarta: Salemba Empat.
Tanor, Melissa O. Sabijono, H dan walandouw, Stanley
Kho. (2015) ‘Analisis Laporan Keuangan Dalam
Mengukur Kinerja Keuangan Pada Pt. Bank Artha
Graha Internasional, Tbk’, jurnal EMBA, 3, pp. 639–
649.
Young, S. David and O’Byrne, S. F. (2001) Value Based
Management. jakarta: Salemba Empat.
Young, S. David and O’Byrne, S. F. (2008) EVA and
Value Based Management. jakarta: Salemba Empat.
UNICEES 2018 - Unimed International Conference on Economics Education and Social Science
1096
