
An Empirical Analysis of Medan Indonesia MSMES Persistence
based on Capital Structure Behavior, Business Strategy, and Business
Operational: A Descriptive Study
Muhammad Andi Abdillah Triono
1
, Syahrizal Chalil Harahap
1
and Humisar Sihombing
1
1
Faculty of Economics, Universitas Negeri Medan, Medan -Indonesia
Keywords: Persistence, Capital Structure, Business Strategy, Business Operational
Abstract: The purpose of this study is to explore Medan City-Indonesia Micro, Small, and Medium Enterprises
(MSMEs) persistence based on their capital structure behavior, business strategy, and business operational.
Most literature in SMEs envisage lack of capital is the most severe constraint for SMEs survival and
growth. Furthermore, trade-off and packing theory are commonly used to explore SMEs behavior toward
how they seek new capitals. This study conducted from 1st of August 2018 until 15th of October 2018
which used primary data through in-depth interview which used questionnaire to capture the characteristics
of Medan Indonesia MSMEs capital structure behavior, business strategy, and business operational that
describe their persistence. The research population was targeted all MSMEs that operate in 33 districts of
Medan, Indonesia and cluster sampling (area sampling) is used as the study sampling method which come
out to 21 districts are selected as the sampling area that lead to 530 MSMEs as the research respondents and
covers a period of 2017 to 2018. Descriptive analysis is used with SPSS 18 as the study tool of analysis. The
result showed that 72.8 percent in 2018 Medan MSMEs did not apply for new capital such as debts and
equities. Moreover, data from finance retainment indicates that the proportion of retain in finance was at
62.6 percent which indicate most of Medan MSMEs used their own retain on earning for operating their
business. Furthermore, debts retained were at 61.1 percent which was higher than retain on equities at 56.4
percent. Therefore, this empirical evidence of persistence through analysis of descriptive statistics shows
that Medan MSMEs capital structure behavior were highly consistent with packing order theory. Moreover,
it showed that financial measures, focus on cost, focus on product quality, and focus on innovation are the
main characteristics of Medan MSMEs business strategy. Furthermore, it showed that Medan MSMEs
operational were mostly characterized by the used of small number of employees that account from using 1-
5 employees and operate less than 5 years.
1 INTRODUCTION
One crucial part of SMEs is persistence in doing
business because for those who has persistence
meant that they have optimism (Adomako, et al.,
2016). Studying aspects on SMEs persistence has
been attention-grabbing for most of researchers that
focusing in SMEs, namely: persistence of product
and process innovation on employment growth
according to the size of the firms (Triguero, et al.,
2013), persistence of SMEs investment in research
and development and growth (Ma´n˜ez, et al., 2015;
Deschryvere, 2013; Ahn, et al., 2017), persistence of
SMEs performance (Serrasqueiro & Nunes, 2008),
and persistence SMEs on performing Business
Excellence (BE) model (Sternad, et al., 2017).
However, there are unseen studies that focus on the
SMEs persistence based on their capital structure
behavior, business strategy, and business
operational, especially at the fourth biggest city in
Indonesia which is the capital city of North
Sumatera, Medan (WIKIPEDIA, 2018). This paper,
therefore, introduces a descriptive exploration of
Medan MSMEs in doing business which based on
capital structure behavior, business strategy, and
business operational that operate at Medan,
Indonesia.
736
Triono, M., Harahap, S. and Sihombing, H.
An Empirical Analysis of Medan Indonesia MSMES Persistence based on Capital Structure Behavior, Business Strategy, and Business Operational: A Descriptive Study.
DOI: 10.5220/0009503107360743
In Proceedings of the 1st Unimed International Conference on Economics Education and Social Science (UNICEES 2018), pages 736-743
ISBN: 978-989-758-432-9
Copyright
c
2020 by SCITEPRESS – Science and Technology Publications, Lda. All rights reserved

All business such as SMEs, firm long-term
investment is the blood in running or persistence the
business game which is called as firm capital
structure. Capital structure behavior on SMEs is
distinctly difference than those in large company,
this is because SMEs financing exhibits considerable
contrast when compared to large enterprises which
point out finance theory is not established with the
small business in mind Ang in (Daskalakis, et al.,
2017). Study which have been done by Matias &
Serrasqueiro (2017) that examined the behavior of
11.016 Portuguese SMEs and conclude that
Portuguese SMEs capital structure differs across
regions with the impact of firm size, age,
profitability, asset structure, and growth on firm
debt. Furthermore, Burgstaller & Wagner (2015) in
their study on 470 SMEs that classified as family
firm revealed that debt is relatively prefer rather than
other external capital injection to the company,
whether the family firm controlled by founders or
not. Hence, most studies conclude that the capital
structure behavior of SMEs are highly consistent
with packing order theory (Daskalakis, et al., 2017;
Matias & Serrasqueiro, 2017; Burgstaller & Wagner,
2015; Xiang & Worthington, 2015; Xiang, et al.,
2015).
Most strategic studies focus on large enterprises
such as competitive strategies and strategic groups
(Parnell, et al., 2015). Study on Australia SMEs
business strategy, Xiang & Worthington (2015)
reveals that SMEs that focus on innovations are
more likely to obtain debt. Moreover, longitudinal
study of internalization strategy on Canadian SMEs
Sui & Baum (2014) reported that no single strategy
is superior however internalization strategy
moderates to Canadian SMEs survival as the relative
important of resources. Moreover, in a time of crisis
KOSSYVA, et al., (2014) suggest that co-opetition
could be an applicable business strategy for SMEs.
There are many studies that focus on supply
chain management and information system which
are considered as two important application in
optimization of firm outcome performance.
Comparative study on Turkey and Bulgarian SMEs,
Tatoglu, et al., (2015) shows that supply chain
management and information system positively
influence SMEs operational which Turkey SMEs
had higher application on supply chain management
rather than Bulgarian. Furthermore, Yadav, et al.,
(2018) conducted simultaneous equation modelling
to analyze lean implementation toward operational
performance of 425 Indian SMEs which reveals that
operational performance of Indian SMEs are
positively related to lean implementation.
This paper used Xiang & Worthington, (2015)
key explanatory variables in explaining Medan
MSMEs capital structure behavior, business
strategy, and business operational.
2 THEORICAL FRAMEWORK
Theory and mechanism toward combining debt and
equity to financing business activities with a
systematically approach is called capital structure
theory (Ross, 2018). Moreover, Xiang &
Worthington, (2015) find evidence that Australian
SMEs financial behavior could be explained by
packing order theory and agency cost theory of
capital structure theory. Evidence from SMEs at
Portugal peripheral region through LSDVC dynamic
estimator Serrasqueiro & Caetano, (2015) conclude
that the most profitable and oldest SMEs resort less
to debt, which verify the forecast of Packing-Order
Theory, while SMEs with greater size and resort
more to debt verify the forecast of Packing Order
Theory and Trade-off Theory.
Modigliani and Miller introduce Trade-off theory
or static trade-off theory which states that a
company could lower its weighted average cost of
capital through capital structure with debt over
equity with assumption of debt payments are tax
deductible and debt financing is initially cheaper
than equity financing (Tarver, 2018). Moreover, a
company should favor to finance itself first
internally through retained earnings, however, if this
source of financing is unavailable then finance itself
through debt and if it not enough then as a last
resort, a company should finance itself through the
issuing of new equity (Tarver, 2018; Zoppa &
McMahon, 2002; Zeidan, et al., 2017).Therefore,
these two theories are emphasizing which sources of
capital that a company favor most.
Applying a specific action through generate a
plan to achieve a specific goal is called a strategy
(Charles, 2018). There are some specific strategies
in understanding product strengths, adjusting price,
or acquiring another business of SMEs such as,
namely, growth strategy, product differentiation
strategy, price-skimming strategy, acquisition
strategy (Suttle, 2018). Furthermore, Leonard (2018)
presents five types of business strategy in order to
satisfy customer needs, explicitly, cost leadership,
differentiation, focus low cost, focus differentiation,
and integrated low cost/differentiation. In
conclusion, a strategy is used by businesses is to
ensure sustainability of company growth and
generate money could be established.
Business operational is defined as everything that
occur within a company to maintain it operation and
earning money (Shopify Inc [CA], 2018).
An Empirical Analysis of Medan Indonesia MSMES Persistence based on Capital Structure Behavior, Business Strategy, and Business
Operational: A Descriptive Study
737

Furthermore, there are four business operation to
consider, namely, process, staffing, location, and
equipment or technology (Shopify Inc [CA], 2018).
Moreover, Lacoma (2018) concludes that there are
four keys elements of business operation, explicitly,
supply, efficiency, reliability and adaptability, and
quality control.
This study refers to the study of Xiang &
Worthington (2015) key explanatory variables,
which capital structure behavior regarded from
applied for additional finance (FINA), applied for
additional debt finance (DEBT), applied for
additional equity finance (EQUI), availability of
finance (AFINA), availability of Debt (ADEBT),
availability of equity (AEQUI). Moreover, in seeing
business strategy, viewed from focus on financial
measures (FOCUF), focus on cost measures
(FOCUC), focus on operational measures (FOCUO),
focus on quality measures (FOCUQ), focus on
innovation (FOCUI), focus on human resources
(FOCUH), and acquired written business strategy or
written business plan (PLAN). Furthermore,
business operational refers to no employee
(SIZE01), 1-5 employees used (SIZE02), 6-20
employees used (SIZE03), less than 5 years business
operate (AGE01), operate 6 – 20 years business
operate (AGE02), operate more than 20 years
(AGE03), doing an export of its goods or services
(EXP), doing an importing of goods or services
(IMP).
In this sense, the study seeks answers to the
following questions:
1. What percentage of Medan MSMEs applies
additional finance (FINA), debt (DEBT), and
equity (EQUI) in 2018?
2. What proportion of Medan MSMEs has the
availability of finance (AFINA), debt
(ADEBT), equity (AEQUI)?
3. What percentage of Medan MSMEs that focus
on financial measures (FOCUF), cost measures
(FOCUC), operational measures (FOCUO),
quality measures (FOCUQ), innovation
(FOCUI), human resources measure (FOCUH),
and acquired written business strategy or written
business plan (PLAN)?
4. What proportion of Medan MSMEs on their
operational measures which refers to no
employee (SIZE01), 1-5 employees used
(SIZE02), 6-20 employees used (SIZE03),
operate less than 5 years (AGE01), operate 6 –
20 years (AGE02), operate more than 20 years
(AGE03), doing an export of its goods or
services (EXP), doing an importing of goods or
services (IMP)?
3 RESEARCH METHOD
This study is descriptive exploration research that
used descriptive statistics analysis which conducted
through in-depth interviews via questionnaire which
based on the study of Xiang & Worthington (2015).
Targeted population is 751 Medan MSMEs that has
been recorded by the government of Medan City
through all in 33 districts in 2018. This research
used cluster sampling method which picked 21
districts randomly as the sampling area and about
530 Medan MSMEs has been gathered based on
government of Medan City dataset as sampling data
through in-depth interviews from 1st of August 2018
until 15th of October 2018. All four research
questions are analyzed through descriptive analysis
which SPSS 18 as the calculation tool.
Furthermore, this study used three latent
variables. Firstly, capital structure behavior with six
manifest variables that refers to additional finance
(FINA) with nominal type data, applied for
additional debt finance (DEBT) with nominal type
data, applied for additional equity finance (EQUI)
with nominal type data, availability of finance
(AFINA) with nominal type data, availability of
Debt (ADEBT) with nominal type data, and
availability of equity (AEQUI) with nominal type
data. The second latent variable is business strategy
with seven manifest variables that viewed from
focus on financial measures (FOCUF) with nominal
type data, focus on cost measures (FOCUC) with
nominal type data, focus on operational measures
(FOCUO) with nominal type data, focus on quality
measures (FOCUQ) with nominal type data, focus
on innovation (FOCUI) with nominal type data,
focus on human resources (FOCUH) with nominal
type data, and acquired written business strategy or
written business plan (PLAN) with nominal type
data. Finally, the third latent variable is business
operational which covers eight manifest variables
that refers to no employee (SIZE01) with nominal
type data, 1-5 employees used (SIZE02) with
nominal type data, 6-20 employees used (SIZE03)
with nominal type data, less than 5 years business
operate (AGE01) with nominal type data, operate 6
– 20 years business operate (AGE02) with nominal
type data, operate more than 20 years (AGE03) with
nominal type data, doing an export of its goods or
services (EXP) with nominal type data, doing an
importing of goods or services (IMP) with nominal
type data.
UNICEES 2018 - Unimed International Conference on Economics Education and Social Science
738
4 ANALYSIS
Data were obtained via descriptive analysis which
organized in frequency and percentage. From 530
Medan MSMEs surveyed data, this study finds the
proportion of MSMEs at 21 districts in Medan
which is mention in Table 1 presents.
Table 1: Medan MSMEs
Frequency Percent
Valid
Percent
Valid Micro Enterprises 439 82.8 82.8
Small Enterprises 89 16.8 16.8
Medium
Enterprises
2 .4 .4
Total 530 100.0 100.0
Most MSMEs in Medan are Micro Enterprises with
the proportion of 82.8 percent from the total
sampling. Moreover, the percentage of small
enterprises was at 16.8 percent, and only 0.4 percent
were medium enterprises.
Table 2: Type of Medan MSMEs Businesses
Frequency Percent
Valid
Percent
Small Retailer 349 65.8 65.8
Property 28 5.3 5.3
Grocery 78 14.7 14.7
Agriculture 24 4.5 4.5
Recreation and Culture
Services
39 7.4 7.4
Communication
Services
6 1.1 1.1
Transportation Services 6 1.1 1.1
Total 530 100.0 100.0
Furthermore, Table 2 shows type of Medan
MSMEs Businesses with small retailer was the
highest portion of all business types at 65.8 percent
and around 14.7 percent was Grocery took the
second places after small retailer from overall
Medan MSMEs. Moreover, recreation and cultural
services was the third place after Grocery with the
percentage of 7.4 percent. Business in property was
the fourth biggest business type at Medan with a
proportion of 5.3 percent. Agriculture placed in fifth
place with a percentage of 4.5 percent. Finally,
communication and transportation services had the
same place with the proportion of 1.1 percent.
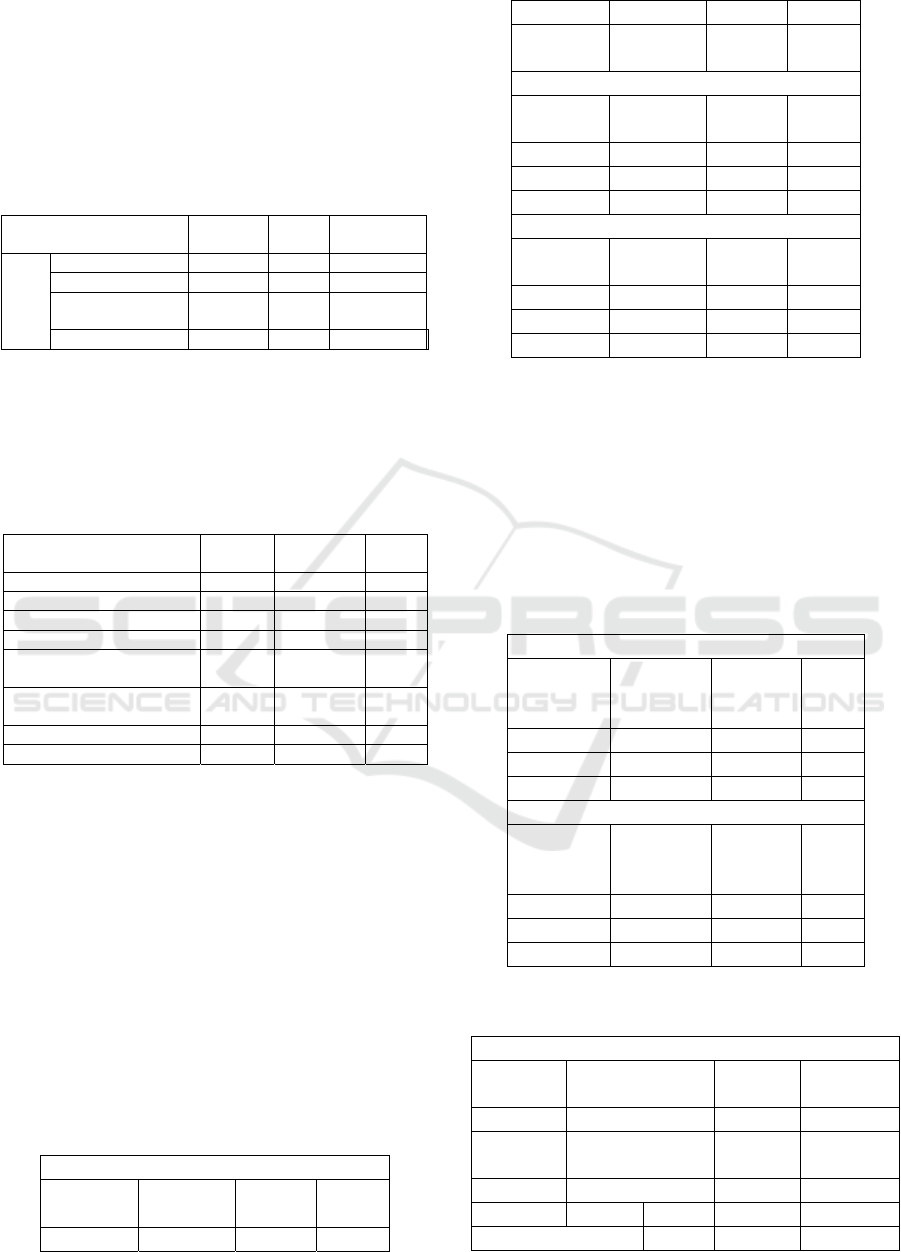
Table 3: Medan MSMEs Apply/Not Apply for
Finance in 2018
Apply for Debt and Equity (FINA)
Frequency Percent
Valid
Percent
Not Apply 386 72.8 72.8
Apply 144 27.2 27.2
Total 530 100.
0
100.0
Apply for Equity (EQUI)
Frequency Percent
Valid
Percent
Not Apply 394 74.3 74.3
Apply 136 25.7 25.7
Total 530 100.0 100.0
Apply for Debt (DEBT)
Frequency Percent
Valid
Percent
Not Apply 379 71.5 71.5
Apply 151 28.5 28.5
Total 530 100.0 100.0
Table 3 above showed that most of Medan MSMEs
did not apply for debt and equity with the proportion
of 72.8 percent and only 27.2 percent applied for
debt and equity. Furthermore, the table also showed
the percentage of 25.7 percent Medan MSMEs
applied for equity and 74.3 percent were not.
Moreover, only 28.5 percent Medan MSMEs applied
for debt and 71.5 percent were not.
Table 4:Finance Retainment of Medan MSMEs
2018
Retainment of Finance (AFINA)
Frequency Percent
Valid
Perce
nt
N
ot Retain 198 37.4 37.4
Retain 332 62.6 62.6
Total 530 100.0 100.0
Retainment of Debt (ADEBT)
Frequency Percent
Valid
Percen
t
N
ot Retain 206 38.9 38.9
Retain 324 61.1 61.1
Total 530 100.0 100.0
Table 5: Medan MSMEs Retainment of Equity in
2018
Retainment of Equity (AEQUI)
Frequency Percent
Valid
Percent
N
ot Retain 230 43.4 43.5
Retai
n
299 56.4 56.5
Total 529 99.8 100.0
Missing System 1 .2
Total 530 100.0
An Empirical Analysis of Medan Indonesia MSMES Persistence based on Capital Structure Behavior, Business Strategy, and Business
Operational: A Descriptive Study
739
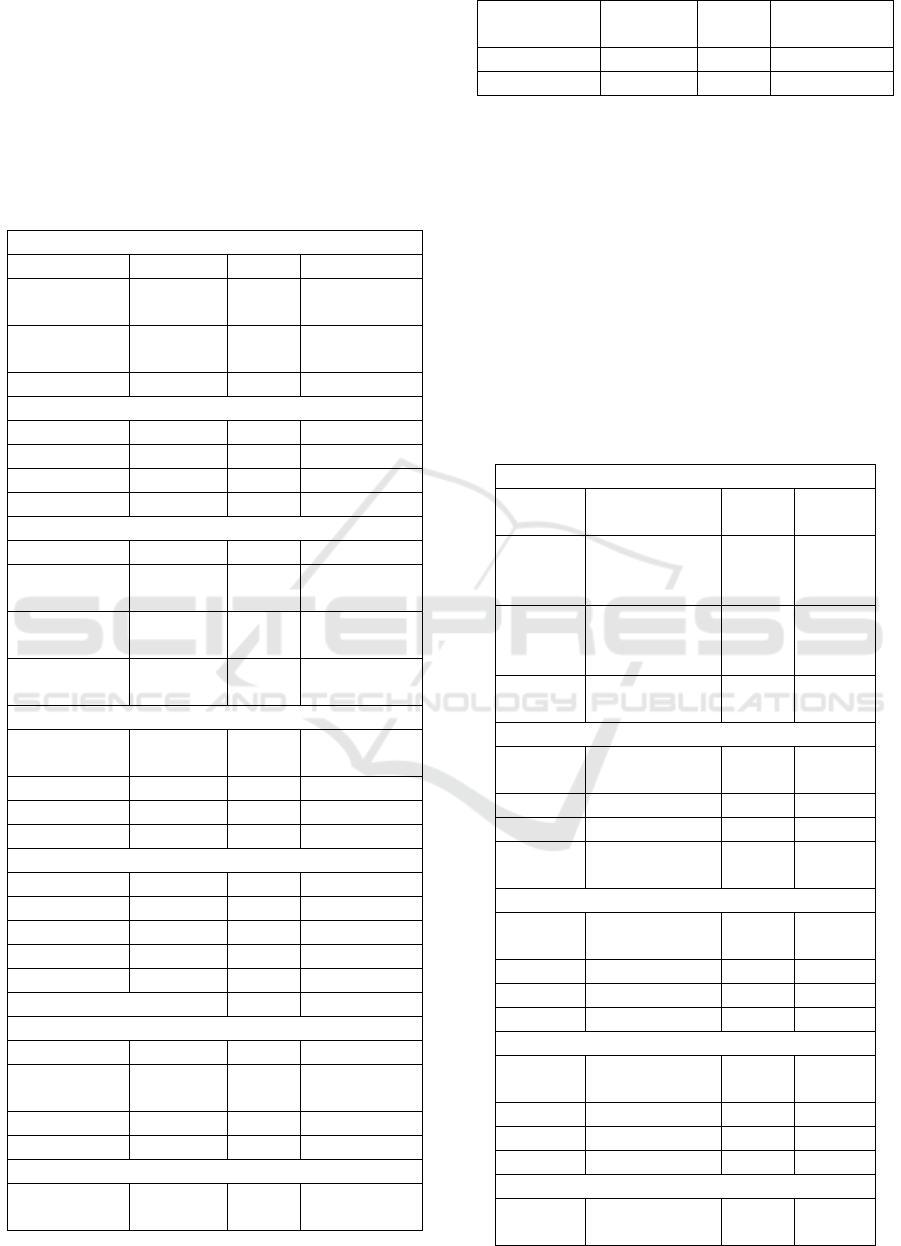
Table 4 and 5 shows the retainment of Medan
MSMEs in Debts and Equities. Table 4.4 concluded
that in 2018, 62.6 percent Medan MSMEs retain on
Finance. 61.1 percent showed that Medan MSMEs
had retainment in debt and 56.4 percent retainment
in equity based on table 5.
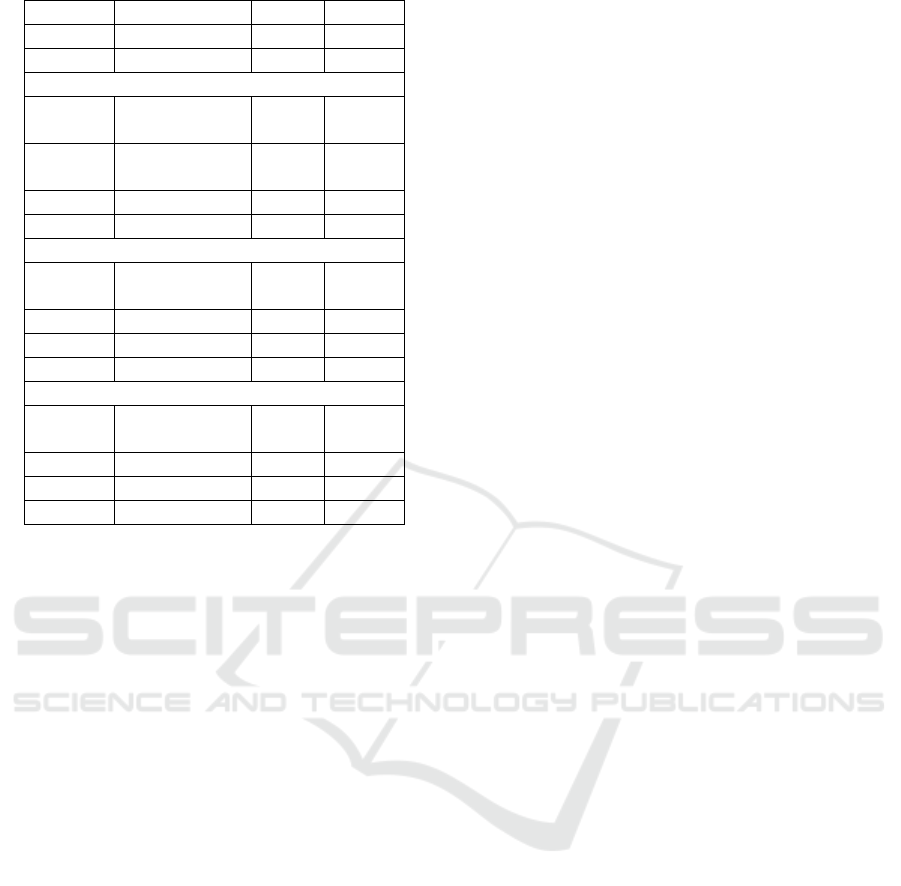
Table 6: Medan MSMEs Persistence based on
Business Strategy 2018
Focus on Financial Measures (FOCUF)
Frequency Percent Valid Percent
N
ot Focus 202 38.
1
38.1
Focus 328 61.
9
61.9
Total 530 100.0 100.0
Focus on Cost (FOCUC)
Frequency Percent Valid Percent
N
ot Focus 212 40.0 40.0
Focus 318 60.0 60.0
Total 530 100.0 100.0
Focus on Operational Process (FOCUO)
Frequency Percent Valid Percent
Not
Focus
273 51.
5
51.5
Focus 257 48.
5
48.5
Total 530 10
0.0
100.0
Focus on Product Quality (FOCUQ)
Frequ
ency
Per
cent
Valid
Percent
Not Focus 188 35.5 35.5
Focus 342 64.5 64.5
Total 530 100.0 100.0
Focus on Innovation (FOCUI)
Frequency Percent Valid Percent
N
ot Focus 232 43.8 43.9
Focus 297 56.0 56.1
Total 529 99.8 100.0
Missing System 1 .2
Total 530 100.0
Focus on Human Resources (FOCUH)
Frequency Percent Valid Percent
Not
Focus
381 71.9 71.9
Focus 149 28.1 28.1
Total 530 100.0 100.0
Acquired Business Plan (PLAN)
Frequency Percent
Valid
Percent
Not
Acquired
308 58.1 58.1
Acquired 222 41.9 41.9
Total 530 100.0 100.0
The descriptive measures of Business Strategy at
Medan MSMEs show at Table 6. It shows that more
than fifty percent Medan MSMEs had business
strategy that is based on Innovation, Product quality
improvement, cost measures, and finance measures
with each proportion of these showed 56 percent, 64
percent, 60 percent, and 61.9 percent respectively.
However, acquired business plan, focus on human
resources, focus on operational process had been
identified less acquired in Medan MSMEs business
strategy which each measure showed 41.9 percent,
28.1 percent, 48.5 percent respectively.
Table 7: Medan MSMEs Operational Characteristics
2018
No Utilize Employees (SIZE01)
Frequency Percent
Valid
Percent
Utilize
Employee
s
154 29.1 29.1
N
o
Utilize
Employee
376 70.9 70.9
Total 530 100.0 100.
0
1-5 Employees Used (SIZE02)
Frequency Percent
Valid
Percent
No 178 33.6 33.6
Yes 352 66.4 66.4
Total 530 100.0 100.
0
6-20 employees used (SIZE03)
Frequency Percent
Valid
Percent
No 421 79.4 79.4
Yes 109 20.6 20.6
Total 530 100.0 100.0
Operate Less than 5 years (AGE01)
Frequency Percent
Valid
Percent
No 221 41.7 41.7
Yes 309 58.3 58.3
Total 530 100.0 1000
operate 6 – 20 years (AGE02)
Frequency Percent
Valid
Percent
UNICEES 2018 - Unimed International Conference on Economics Education and Social Science
740
No 421 79.4 79.4
Yes 109 20.6 20.6
Total 530 100.0 100.0
Operate more than 20 years (AGE03)
Frequency Percent
Valid
Percent
No 489 92.
3
92.3
Yes 41 7.7 7.7
Total 530 100.0 100.0
Doing an export (EXP)
Frequency Percent
Valid
Percent
No 508 95.8 95.8
Yes 22 4.2 4.2
Total 530 100.0 100.0
Doing Import (IMP)
Frequency Percent
Valid
Percent
No 463 87.4 87.4
Yes 67 12.6 12.6
Total 530 100.0 100.0
Table 7 represents Medan MSMEs operational
characteristics in 2018 from utilizing employees
until doing import of goods and services. Table 7
revealed that most Medan MSMEs Operational
characteristics were no utilizing of employees, using
employees in a number from 1 – 5 employees, and
operate less than 5 years which each proportion of
these showed 70.9 percent, 66.4 percent, and 58.3
percent.
5 RESULTS
Explanation of the research questions one and two
are describing the persistence in doing business of
Medan MSMEs based on capital structure behavior.
The result showed that 72.8 percent in 2018 Medan
MSMEs did not apply for new capital such as debts
and equities. Moreover, data from finance
retainment indicates that the proportion of retain in
finance was at 62.6 percent which indicate most of
Medan MSMEs used their own retain on earning for
operating their business. Furthermore, debts retained
were at 61.1 percent which was higher than retain on
equities at 56.4 percent. Therefore, this empirical
evidence of persistence through analysis of
descriptive statistics shows that Medan MSMEs
capital structure behavior were highly consistent
with packing order theory.
Medan MSMEs persistence on doing business
based on Business strategy was showed by
answering the third research question. The result
showed that financial measures, focus on cost, focus
on product quality, and focus on innovation are the
main characteristics of Medan MSMEs business
strategy.
The last answer of the research question is
describing the finding of Medan MSMEs persistence
in doing business based on Business Operational
Characteristics. It showed that Medan MSMEs
operational were mostly characterized by the used of
small number of employees that account from using
1-5 employees and operate less than 5 years..
6 CONCLUSIONS
This research reveals fascinating fact that the
characteristics of Medan MSMEs persistence in
doing business based on capital structure is highly
consistent with packing order theory rather than
static trade-off theory. Moreover, financial
measures, focus on cost, focus on product quality,
and focus on innovation are the main characteristic
persistence in doing business based on business
strategy. Furthermore, the used of small number of
employees that account from using 1-5 employees
and operate less than 5 years are the most
characteristics of persistence in doing business based
on business operational characteristics.
This study is descriptive in nature and restricted
to the micro, small, and medium (MSMEs) in
Medan, Indonesia only. Therefore, future
researchers are suggested to obtain more in-depth
interviews with longer period in observing MSMEs
through panel data which could leads more robust
result and could bring more clarity in MSMEs
literature and government policies.
REFERENCES
Adomako, S., Danso, A., Uddin, M. & Ofori-Damoah, J.
O.-D., (2016). Entrepreneurs’ Optimism, Cognitive
Style and Persistence. International Journal of
Entrepreneurial Behavior & Research, 22(1), pp. 84-
108.
Ahn, S., Yoon, J. & Kim, Y. J., (2017). Technology
Management, R&D Investment, and Small and
Medium-Sized Enterprise Growth. Singapore, IEEE
Computer Society.
Burgstaller, J. & Wagner, . E., (2015). How do family
An Empirical Analysis of Medan Indonesia MSMES Persistence based on Capital Structure Behavior, Business Strategy, and Business
Operational: A Descriptive Study
741

ownership and founder management affect capital
structure decisions and adjustment of SMEs?:
Evidence from a bank-based economy. The Journal
of Risk Finance, 16(1), pp. 73-101.
Charles, T., (2018). Describe the Three Levels of Strategy
for a Single-Business Company. [Online] Available
at: https://smallbusiness.chron.com/describe-three-
levels-strategy-singlebusiness-company-23508.html
[Accessed 4 December 2018].
Daskalakis, N., Balios, D. & Dalla, V., (2017). The
behaviour of SMEs’ capital structure determinants in
different macroeconomic states. Journal of
Corporate Finance, Volume 46, pp. 248-260.
Deschryvere, M., (2013). R&D, firm growth and the role
of innovation persistence: an analysis of Finnish
SMEs and large firms. Small Business Economics, 1
December.
KOSSYVA, D., SARRI, K. & GEORGOPOULOS, N.,
(2014). CO-OPETITION: A BUSINESS
STRATEGY FOR SMES IN TIMES OF
ECONOMIC CRISIS. South-Eastern Europe Journal
of Economics, pp. 89-106.
Lacoma, T., (2018). The Key Elements of Business
Success From an Operating Perspective. [Online]
Available at: https://smallbusiness.chron.com/key-
elements-business-success-operating-perspective-
21234.html [Accessed 4 December 2018].
Leonard, K., (2018). Five Types of Business-Level
Strategies. [Online]
Available at: https://smallbusiness.chron.com/five-types-
business-level-strategies-781.html [Accessed 4
December 2018].
Ma´n˜ez, J. A., Rochina-Barrachina, M. E., Sanchis-
Llopis, A. & Sanchis-Llopis, J. A., (2015). The
determinants of R&D persistence in SMEs. Small
Business Economics, p. 505–528.
Matias, F. & Serrasqueiro, Z., (2017). Are there reliable
determinant factors of capital structure decisions?
Empirical study of SMEs in different regions of
Portugal. Research in International Business and
Finance, Volume 40, pp. 19-33.
Parnell, J. A., Long, Z. & Lester, D., (2015). Competitive
strategy, capabilities and uncertainty in small and
medium sized enterprises (SMEs) in China and the
United States. Management Decision, 53(2), pp.
402-431.
Ross, S., (2018). What is capital structure theory?.
[Online] Available at:
https://www.investopedia.com/ask/answers/031915/
what-capital-structure-theory.asp [Accessed 3 12
2018].
Serrasqueiro, Z. & Caetano, A., (2015). Trade-Off Theory
versus Pecking Order Theory: capital structure
decisions in a peripheral region of Portugal. Journal
of Business Economics and Management, 16(2), pp.
445-466.
Serrasqueiro, Z. S. & Nunes, P. M., (2008). Performance
and size: empirical evidence from Portuguese SMEs.
Small Business Economics, p. 195–217.
Shopify Inc [CA], (2018). Business Operations. [Online]
Available at:
https://www.shopify.com/encyclopedia/business-
operations [Accessed 4 December 2018].
Sternad, D., Krenn, M. & Schmid, S., (2017). Business
excellence for SMEs: motives, obstacles, and size-
related adaptations. Total Quality Management &
Business Excellence.
Sui, S. & Baum, M., (2014). Internationalization strategy,
firm resources and the survival of SMEs in the
export market. Journal of International Business
Studies, 45(7), p. 821–841.
Suttle, R., (2018). Different Types of Business Strategies.
[Online] Available at:
https://smallbusiness.chron.com/different-types-
business-strategies-4634.html [Accessed 4
December 2018].
Tarver, E., (2018). Which financial principles help
companies choose capital structure?. [Online]
Available at:
https://www.investopedia.com/ask/answers/052215/
does-tradeoff-model-or-pecking-order-play-greater-
role-capital-budgeting.asp [Accessed 4 December
2018].
Tatoglu, E. et al., (2015). How do supply chain
management and information systems practices
influence operational performance? Evidence from
emerging country SMEs. International Journal of
Logistics: Research and Applications.
Triguero, A., Co´rcoles, D. & Cuerva, M. C., (2013).
Persistence of innovation and firm’s growth:
evidence from a panel of SME and large Spanish
manufacturing firms. Small Business Economics, 1
December.
WIKIPEDIA, (2018). Medan. [Online] Available at:
https://en.wikipedia.org/wiki/Medan [Accessed 4
December 2018].
Xiang, D. & Worthington, A., (2015). Finance-seeking
behaviour and outcomes for small- and medium-
sized enterprises. International Journal of
Managerial Finance, Volume 11, pp. 513-530.
Xiang, D., Worthington, A. C. & Higgs, H., (2015).
Discouraged finance seekers: An analysis of
Australian small and medium-sized enterprises.
International Small Business Journal, p. 689–707.
UNICEES 2018 - Unimed International Conference on Economics Education and Social Science
742

Yadav, V. et al., (2018). The impact of lean practices on
the operational performance of SMEs in India.
Industrial Management & Data Systems.
Zeidan, R. M., Galil, K. & Shapir, O. M., (2017). Do
Ultimate Owners Follow the Pecking Order
Theory?. [Online]
Available at:
https://papers.ssrn.com/sol3/papers.cfm?abstract_id=
2747749 [Accessed 4 December 2018].
Zoppa, A. & McMahon, R. G., (2002). PECKING
ORDER THEORY AND THE FINANCIAL
STRUCTURE OF MANUFACTURING SMEs
FROM AUSTRALIA’S BUSINESS
LONGITUDINAL SURVEY. [Online] Available at:
www.flinders.edu.au/sabs/business-
files/research/papers/2002/02-01.pdf [Accessed 4
December 2018].
An Empirical Analysis of Medan Indonesia MSMES Persistence based on Capital Structure Behavior, Business Strategy, and Business
Operational: A Descriptive Study
743
