
Accounting Anxiety in Accounting Education: A Case Study on
Accounting Undergraduate Students in Universitas Negeri Medan
Choms Gary Ganda Tua Sibarani
1
, Andri Zainal
1
and Ulfa Nurhayani
1
1
Faculty of Economics, Universitas Negeri Medan, Medan -Indonesia
Keywords: Accounting Anxiety, Accounting Students, Factors Analysis
Abstract: Extant studies highlight that accounting anxiety is as an individual fear or fear of accounting in terms of
understanding accounting concepts, applying economic events by completing the accounting cycle,
preparing final accounts, interpreting, analyzing, and communicating financial information useful for
decision-making purposes. this study to ascertain whether there is a difference between accounting and non
accounting educational students Unimed accounting and what factors influence it. Seen from the
independent sample t test found that T test table is 2,0024 and the sig value is 0, 30 <0, 05 which means that
there are differences in accounting anxiety. then there are 4 factors that affect accounting anxiety that is
cognitive anxiety, anxiety, confidence, and doubt seen from result of factor analysis test. The population in
this study are students of Accounting Education and Non-Education Accounting Student, Faculty of
Economics Unimed of batch 2015 that were engaged in academic year of 2017/2018. The sampling
procedure used a Purposive Random Sampling. The sample in this study consisted of 60 samples taken
summed up from 30 samples representing each department as respondent.
1 INTRODUCTION
Accounting in general has been widely known as a
discipline that studies measurement, reporting or
assurance providers regarding financial information
that will help managers, investors, tax authorities
and other decision makers in policy making. who
can provide financial and non-financial effects in
companies, organizations and government
institutions. Mastery of the competencies in question
makes accountants as one of the professions that
have bright career prospects in the professional
world. So that helped make the accounting
department as one of the most popular study
programs by the majority of high school (SMA)
graduates. This can also be seen from the graph of
specialization of study programs at Universitas
Negeri Medan (UNIMED) which places the
Accounting and Accounting Education study
programs in the top 10 (ten) study programs of
favorite choice of high school graduates in the last
five years.
However, mastering the competencies related to
accounting at the tertiary level has its own
challenges and obstacles that must be a serious
concern for policy makers in increasing the added
value of graduates. Zakiah (2013) specifically
criticizes that accounting education that has been
taught at high ranking tends to be impressed as a
mechanism-oriented knowledge in general, which is
inversely proportional to the practices actually faced
in the world of work later. Identical conditions are
also found in the teaching and learning process in
classrooms where relative students perceive
accounting knowledge as a difficult science with
mastery and memorizing demands for accounting
accounting techniques that make student accounting
competencies less optimal (Franco and Roach ,
2017; Duman et al., 2015; Buckhaults and Fisher,
2011; Malgwi, 2004).
The need to find the best and practical
formulation to make accounting as a fun discipline
both in theory and practice is a central implication in
this study. The complexity of accounting science
coupled with the dynamics of racing against time in
learning process materials related to accounting
without realizing it makes PBM static and
procedural for students and lecturers. Analysis of
accounting anxiety to these two objects (students
Sibarani, C., Zainal, A. and Nurhayani, U.
Accounting Anxiety in Accounting Education: A Case Study on Accounting Undergraduate Students in Universitas Negeri Medan.
DOI: 10.5220/0009496201050112
In Proceedings of the 1st Unimed International Conference on Economics Education and Social Science (UNICEES 2018), pages 105-112
ISBN: 978-989-758-432-9
Copyright
c
2020 by SCITEPRESS – Science and Technology Publications, Lda. All rights reserved
105

and lecturers) becomes important and
comprehensive to be studied in depth so that it can
make a significant contribution to improving the
output of alumni who have added value, especially
in facing the demands of the workforce. In addition,
in a more general and sustainable context, by
identifying and analyzing anxiety accounting
educators can also provide input for relevant policy
making to improve pedagogical and professional
competence of accounting lecturers and accounting
education, especially in the UNIMED environment.
Reviewed from an epistemological point of view;
The structure and method of this research refers to
the Processing Efficiency Theory which is the basis
for thinking in associative and comparative testing
between accounting anxiety and academic
performance in accounting students and educators in
the UNIMED environment.
Implementation of standard lectures / PBM at
UNIMED based on the Indonesian National
Qualifications Framework (KKNI) which is directed
to improve student competence through six ways
called 6 (six) tasks, namely: routine assignments,
textbook reviews, academic journal reviews (critical
journal report), idea engineering, mini research and
project since the 2016/2017 academic year also
brought important issues in this study, This is due to
relatively different preparations in the pre and post
implementation of learning process under KKNI
standards what is meant is particularly good among
UNIMED's lecturers and accounting students so that
it also influences the accounting anxiety profile in
the two study objects in question. However, as far as
the proposer team's knowledge is concerned, there
have been no relevant studies in analyzing the
effectiveness of the standard implementation of IQF-
based lectures on accounting anxiety among students
and accounting lecturers.
This study focuses on the analysis of accounting
anxiety (Accounting Anxiety) and the application of
the KKNI-based lecture standard on UNIMED
accounting education students based on an empirical
study of the Perspective of the Processing Efficiency
Theory aimed at:
(1) explore factors relevant to accounting anxiety
among students in accounting education study
programs;
(2) reviewing accounting anxiety profiles among
students in accounting study programs and
accounting education;
(3) analyze differences in accounting anxiety
among students in accounting study programs and
accounting education; and
Accounting Anxiety: Definition and Impact on
Academic Performance of Students and
Accounting Educators
Prior studies have highlighted the role of anxiety as
one of the main obstacles in achieving individual
academic performance (see Franco and Roach, 2017;
Duman et al., 2015; Buckhaults and Fisher, 2011;
Malgwi, 2004 and; Ameen et al., 2002). Although
there is not yet one standard definition of accounting
anxiety - given that the majority of empirical
literature and studies are dominated by research in
the field of computer anxiety - but does not deny the
fact that users (accounting), especially at the level of
higher education also experience anxiety conditions
that are identical with conditions on computer
anxiety and similar anxiety in other fields of science
such as mathematics, chemistry, and language
(Malgwi, 2004). When the intended accounting user
is a student and educator / lecturer experiencing
anxiety in learning process, it will have a negative
impact on their academic performance related to the
field of accounting science.
Epistemologically, this phenomenon is
specifically reflected in processing efficiency theory
by Eysenck and Calvo (2002). Processing efficiency
theory articulates anxiety as a concern that comes
from two interrelated forms of anxiety: emotional
state anxiety and innate anxiety (anxiety trait) which
has implications for decreased motivation in
completing a job and aversive behavior. According
to Eysenck and Calvo (2002), decreasing motivation
in completing tasks that are sometimes followed by
unpleasant behavior activities will ultimately have a
direct impact on the decline in individual
performance which confirms a significant
correlation between anxiety and performance.
In this study, the definition of accounting anxiety
that is relevant to the theory of processing efficiency
refers to the terminology developed by Malgwi
(2004). The terminology in question defines
accounting anxiety as fear and / or concern of
individuals involved in accounting science in terms
of understanding accounting concepts, completing
the accounting cycle, interpreting, analyzing, and
communicating financial information that is useful
for decision-making purposes. In addition, Malgwi
(2004) argues that accounting anxiety also includes
conditions of fear and / or concern in the use of
applicable accounting software, taking part in public
accountant certification (CPA) and other accounting
concentration certifications that describe anxiety.
accounting for professional accountants. Concern
about failure to achieve the ideal level of
professional competence caused by failure and
negligence in achieving these professional
certifications is one form of accounting anxiety
experienced by educating accountants.
UNICEES 2018 - Unimed International Conference on Economics Education and Social Science
106

Based on the premise that has been described in
the previous paragraph, this research underlines
accounting anxiety and its role in academic
performance / performance which is viewed from
the perspective of students (Franco and Roach,
2017; Duman et al., 2015; Malgwi, 2004) and
accounting educators (Ameen et al., 2002). Through
an integrative study of accounting anxiety from two
perspectives: students and educators can provide
comprehensive and complementary studies in
reducing the negative impact of accounting anxiety
in real terms. Thus, with a decrease in accounting
anxiety, especially in PBM, it will provide a
significant stimulus to academic achievement on
both sides.
Accounting Anxiety and Performance of PBM
Pre and Post Implementation of Standards for
Lectures based on IQF at UNIMED
Quoted from the official UNIMED page
(https://www.unimed.ac.id/2016/09/13/unimed-
susun-standar-perkuliahan-kurikulum-kkni/) the
implementation of the KKNI-based lecture standards
has begun since the odd semester lecture process for
new students in the 2016/2017 academic year. The
special character of this KKNI-based lecture
standard involves aspects of knowledge, skills and
attitudes. As stated by the UNIMED Chancellor,
Prof. Dr. Syawal Gultom, M.Pd., through the
implementation of lecture standards based on the
KKNI. student competence will be fostered through
six ways called 6 (six) tasks, namely; routine
assignment, critical book report, critical journal
report, idea engineering, mini research and project.
The legal basis in the drafting of the lecture plan
designed refers to Permenristekdikti Number 44 of
2015. In article 12 it is stated that the semester
lecture plan is established and developed by
lecturers independently or jointly in the expertise
group of a field of science and / or technology in the
study program. The design of the lecture standard
for this KKNI curriculum will be the reference for
all lecturers in designing, implementing and
evaluating the lecture process carried out in the
class. This is intended to accelerate advanced
campus performance which must have lecture
standards with special autonomy to the lecturers to
arrange according to the characteristics of their
respective studies. If there are already standards for
planning, implementing, and evaluating, the lecturer
can only develop it to be carried out in lectures.
These six tasks become a new pattern in the lecture
process that will be applied by lecturers in the odd
semester of the 2016/2017 academic year. The
UNIMED Chancellor reaffirmed that there is no
single subject that is not appropriate when applied to
these six tasks. Logical and practical justification of
the application of the six tasks basically because all
subjects must have a source / literature, in the form
of books, journals and related research results.
Furthermore, the implementation of the standards
of lectures based on IQF provides a special
challenge for students and educators in the
UNIMED environment. In particular, this demand
has relatively had an impact on the increase in
significant academic anxiety compared to the
previous application of lecture standards that were
conventionally focused on students (student learning
center / SCL). However, there is no scientific study
that can provide empirical evidence of this
hypothesis. Thus, the initiative to investigate the
effect of accounting anxiety on the implementation
of the IQF-based lecture standards for each student
and accounting education at UNIMED will provide
meaningful PBM evaluations to improve the
implementation of the IQF-based lecture standards
on an ongoing basis in the intended scientific field.
2 METHODOLOGY
2.1 Research Method
This study uses research methods using a
quantitative approach and the type of research is
explanative which is comparative, this method is
used to explain differences and factors that influence
the variables contained in the study (Sugiyono,
2007).
Factor analysis is an analysis that aims to find
the main factors that most influence the dependent
variable from a series of tests conducted on a series
of independent variables as a factor. Especially for
Factor Analysis, the following assumptions must be
met:
1. Correlation between Independent variables. The
correlation or correlation between independent
variables must be strong enough, for example
above 0.5.
2. Partial Correlation. The magnitude of the partial
correlation, the correlation between the two
variables by considering the other variables,
must be small. In SPSS detection of partial
correlations is given through the Anti-Image
Correlation option.
3. Testing all correlation matrix (correlation
between variables), measured by the Bartlett
Test of Sphericity or Measure Sampling
Adequacy (MSA). This test requires a
significant correlation between at least a few
variables.
4. In some cases, the assumption of normality of
the variables or factors that occur should be
fulfilled.
Accounting Anxiety in Accounting Education: A Case Study on Accounting Undergraduate Students in Universitas Negeri Medan
107

2.2 Population and Samples
The population and sample in this study were
Accounting Education students and Non-Accounting
Education students, Unimed Faculty of Economics
for the 2015 academic year 2017/2018 in the even
semester. The reason researchers conducted research
in the 2015 class because according to the 2015
scholarship students had taken accounting courses as
a whole so the researchers wanted to know the level
of anxiety about the accounting subject. The
sampling method is done by using Purposive
Random sampling. The sample in this study 60
samples taken from 30 samples representing each
department as respondents to be given a
questionnaire (questionnaire).
3 RESEARCH METHOD
Descriptive Statistics from Questionnaire
Table 1: Questionnaire
No Indicators Accounting
Education
Students of
2015
Accounti
ng
Students
of 2015
1 Learning accounting
provides an interesting
challenge
4,2333 4,1667
2 Learning accounting can
improve my competence
as a student and
prospective worker in
the future
4,1333 3,9000
3 I don't like learning
accounting because the
lessons are not fun and
difficult for me
3,7667 3,7333
4 I feel the difficulty in
understanding the
accounting system is
working / functioning
3,9667 3,7667
5 I think learning to
understand accounting
can make me a
p
roductive individual
3,6333 3,6333
6 I feel uncertain about
my ability to present,
analyze, translate
financial reporting.
3,9000 3,6000
7 I am very excited to
present, analyze and
translate accounting
reports
3,4000 3,2000
8 I'm sure I'm not
sure that I will be able
to study the accounting
syste
m
3,8000 3,6667
9 I am confident with
myself, that I can study
and study accounting I
will get accounting
expertise
4,0000 3,8667
10 I think everyone will be
able to activate the
application of
3,9000 3,8000
accounting information
systems if they have
motivation and practice
what they have learned.
11 Learning accounting
will give new skills, the
more you practice the
b
etter the results.
4,4000 4,1000
12 I began to worry about
using accounting
software, I would
become dependent on
the software and lose
my analytical skills.
3,7667 3,4333
13 I am sure that the more I
practice with accounting
software, the more I will
get used to using it as I
do now using software
3,6000 3,3667
14 In my opinion, I will be
able to complete my
competence with the
demands of the
accounting profession /
accounting education
p
rofession.
3,6333 3,4000
15 I am worried that if I
apply the wrong
accounting principles, I
will be able to cause the
resulting financial
statements to be wrong
3,4667 3,2667
16 I am hesitant to use
accounting software for
fear of making a
mistake and I cannot
correct the erro
r
3,1000 3,2333
17 People who can
understand transactions
- adjusting journal
accounting transactions
in completing an
accounting cycle are
smart people
3,4333 3,4667
18 If I get a chance I will
study and practice the
use of accounting
software.
3,4667 3,7333
Difference in Accounting Anxiety Test
Data Normality Test
The purpose of the data normality test is to
determine the distribution of data in the accounting
anxiety variable that will be used in this study.
If the significance value is <0.05, the data is not
normally distributed
If the significance value is> 0.05, the data is
normally distributed
UNICEES 2018 - Unimed International Conference on Economics Education and Social Science
108
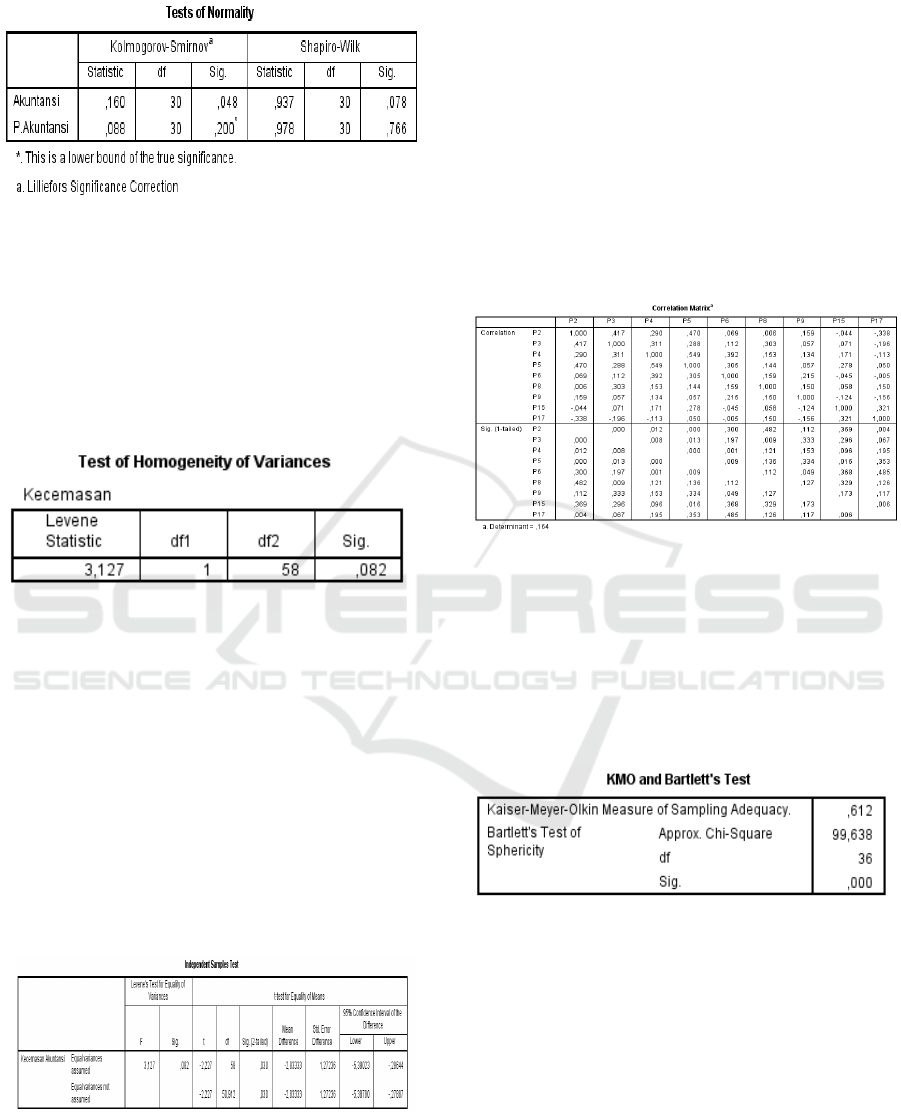
Table 2: Data Normality Test
From the results of the table above seen from
Shapiro-wilk significance value> 0.05, it can be said
that the data is normally distributed.
Homogeneity Test
To test the homogeneity of the data is used to
determine whether variant 2 is the same or different
population.
/
Table 3: Homogeneity Test
If the significance value > 0.05, the data used is
homogeneous. After the data is normally distributed
and homogeneous then conducted an Independent
Sample T Test to see the differences in accounting
anxiety of accounting education students with
accounting non-education.
Independent Sample T-Test
In this study the aim is to compare two sample
groups, each of which is different so that there are
indications to direct researchers to use statistical test
methods, namely Independent Sample T-Test
(Ghozali, 2009).
Table 4: Independent Sample T-Test
Basic Decision Making in T Test
H0 is accepted and H1 is rejected if the value of
t-counts < t-table or if the value of sig > 0.50
H0 is rejected and H1 is accepted if the value of
t-counts > t-table or if the value of sig < 0.50
Based on the results of the analysis found that
there are differences in accounting anxiety between
students of Accounting Education with Non-
Education Accounting, seen from the 2-tailed sig
value in the Independent Sample T Test of 0.030
which means <0.05.
After finding the difference, the researcher
continued the research to examine the factors that
influence the accounting anxiety, namely by using
the factor analysis test below.
Factor Analysis
Table 5: Factor Analysis
Correlation matrix is considered to be
interrelated when the determinant is close to 0. The
determinant results are close to 0. The calculation
results show a value of 0.164. This value is close to
0, with the correlation matrix between the
interrelated variables.
We tested the assumption of factor analysis one
by one before the factor analysis test is carried out.
Table 6: KMO and Bartlett’s Test
Correlations between independent variables, in
factor analysis, must be> 0.5 with significance
<0.05. The significance of the research is 0,000.
From the results above obtained KMO value of
0.612 which means greater than 0.5. Meanwhile, the
significance generated from Bartlett's Test of
Sphericity is 0,000. With the results above, it can be
said that the variables and samples used allow for
further analysis.
Accounting Anxiety in Accounting Education: A Case Study on Accounting Undergraduate Students in Universitas Negeri Medan
109
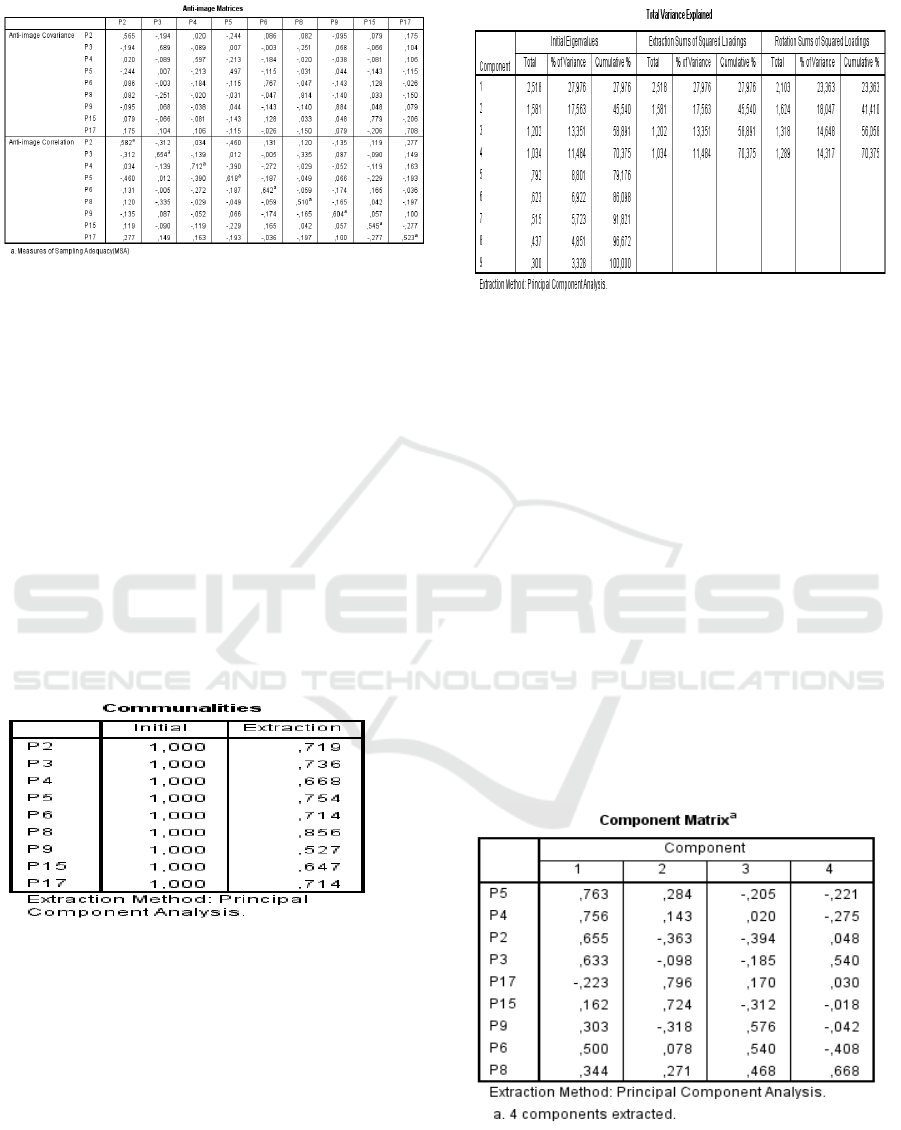
Table 7: Correlations between independent variables
Furthermore, to see the partial correlation can be
observed Anti-Image Matrices table. The value
considered is MSA (Measure of Sampling
Adequacy). MSA values range from 0 to 1, with the
following conditions: (Santoso, 2006: 20)
1. MSA = 1, variables can be predicted without
errors by other variables.
2. MSA> 0.5, the variables can still be predicted
and can be analyzed further.
3. MSA <0.5, variables cannot be predicted and
cannot be analyzed further, or excluded from
other variables.
Based on the results of the MSA above, all
independent variables can be further analyzed
because each value is> 0.5.
Factors Grouping
Table 8: Factors Grouping
This research effort is to determine whether
independent variables can be grouped into one or
several factors. The purpose of the variable
explanation by the factor is how much that will later
be able to explain the variable. For this reason, you
should see the Communalities table. The result is a
factor capable of explaining the variable because the
average explanation is above 50% then the fixed
factor will be determined.
Possible Factors Formed
In order to determine how many factors that might
be formed can be seen in the Total Variance
Explained table.
Table 9: Total Variance Explained
Components range from 1 to 9 representing the
number of independent variables. Pay attention to
the Initial Eigenvalues column which we determine
the value of SPSS 1. The variance can be explained
by factor 1 is 2,518 / 9 x 100% = 27,976. Factor 2 is
1,581 / 9 x 100% = 17,563. factor 3 is 1,202 / 9 x
100% = 13, 351%. While factor 4 is 1,034 / 9 x
100% = 11,484. And, the total of the four factors
will be able to explain the variables of 27,976% +
17,563% + 13,351% + 11,484% = 70,375%. Thus,
because the value of Eigenvalues is set to 1, the total
values to be taken are those> 1 namely components
1, 2, 3, and 4.
Factors Loading
After we know that the maximum factor that can be
formed is 4, then we determine each independent
variable will be in factors 1, 2, 3 or 4. How to
determine it is to look at the Component Matrix
table as follows:
Table 11: Factors Loading
UNICEES 2018 - Unimed International Conference on Economics Education and Social Science
110
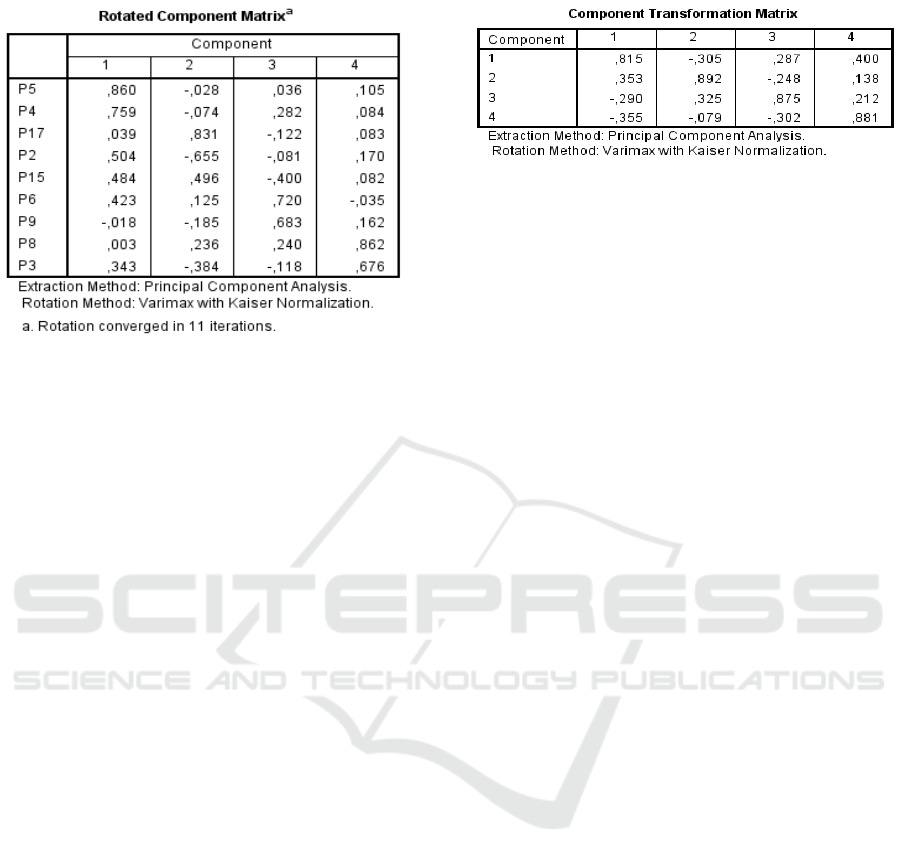
Table 12 :Rotated Component
In determining input variables to certain factors
follows the magnitude of the correlation between
variables with factors, namely to the large
correlation. Seen in the Rotated Component Matrix
table, thus the member factors and variables are:
Factor 1:
a. I feel the difficulty in understanding the
accounting system is working / functioning.
b. I think learning to understand accounting can
make me a productive individual
Factor 2:
a. I am worried that if I apply the wrong
accounting principles, I will be able to cause the
resulting financial statements to be wrong.
b. Learning accounting can improve my
competence as a student and prospective worker
in the future.
c. People who can understand transactions -
adjusting journal accounting transactions in
completing an accounting cycle are smart
people.
Factor 3:
a. I feel uncertain about my ability to present,
analyze, translate financial reporting.
b. I am confident with myself, that I can study and
study accounting I will get accounting expertise.
Factor 4:
a. I don't like learning accounting because the
lessons are not fun and difficult for me.
b. I'm sure I'm not sure that I will be able to study
the accounting system.
Table 13 : Component Transformation Matrix
As the final step of determining factors, you can
see the following Component Transformation Matrix
table: Factors 1, 2, 3 and 4 have a correlation of >
0.5 which means that they are quite strong. Thus it
can be said to be appropriate to summarize the 9
independent variables.
It has been obtained that there are 4 factors
formed, namely Factor 1, Factor 2, Factor 3 and
Factor 4.
Factor 1 contains variables in the form of
cognitive anxiety. Observing from a cognitive
perspective, it is appropriate to recognize that
anxiety can have an adverse or negative effect on
student learning and performance. Students have
varying degrees of anxiety because they are different
when asked to use them, for example computers to
perform tasks (Burket et al. 2001).
Factor 2 contains the anxiety variable. The
creation of anxiety consists of various problems and
mostly depends on the subject matter. Emphasis is
placed on accounting educators to embrace the use
of technology to make accounting and technology
more comparable. For example, previous research
on computer anxiety was associated with various
types of learning styles (Bozionelos 1997).
Therefore, in order to improve student performance,
various types of training or private tutoring are
needed to reduce computer anxiety (Broome and
Havelka 2002).
Factor 3 contains variables that are self-
confidence. Confidence is the ability of individuals
to understand and believe in all their potential so that
they can be used in the face of adaptation to their
environment.
Factor 4 contains a doubtful / doubtful variable
which in the Big Indonesian Dictionary (KBBI)
means that in a state of uncertainty (in making
decisions, making choices) or in doubt.
4 CONCLUSIONS
Based on the results of the analysis it can be
concluded that there are significant differences in
accounting anxiety among students of education and
Non Accounting Education Medan State University.
Accounting Anxiety in Accounting Education: A Case Study on Accounting Undergraduate Students in Universitas Negeri Medan
111

It was seen in the independent sample T test that it
was found that the T test table was 2.0024 and the
sig value was 0, 30 <from 05.05.
Then the result is that there is a significant
difference in accounting anxiety among students in
Accounting Education and Non Accounting
Education at UNIMED. There are 4 factors that
affect accounting anxiety:
1. Cognitive Anxiety
2. Anxiety
3. Self Confidence
4. Doubt
Future studies are suggested to explore more
deeply and add other variables, for example:
previous experience, GPA, gender, and so on. And
also researchers who use qualitative are advised to
dig deeper about the substance of research material
related to accounting anxiety itself.
ACKNOWLEDGEMENT
The researcher would like to thank the Accounting
Education students and Non-Accounting Education
students, Unimed Faculty of Economics who
supports the study.
REFERENCES
Ameen, E. C., Guffey, D. M., & Jackson, C. (2002).
Evidence of teaching anxiety among accounting
educators. Journal of Education for Business, 78(1),
16-22.
Buckhaults, J., & Fisher, D. (2011). Trends in accounting
education: Decreasing accounting anxiety and
promoting new methods. Journal of Education for
Business, 86(1), 31-35.
Duman, H., Apak, İ., Yücenurşen, M., & Peker, A. A.
(2015). Determining the anxieties of accounting
education students: A sample of Aksaray University.
Procedia-Social and Behavioral Sciences, 174, 1834-
1840.
Eysenck, M. W., & Calvo, M. G. (2002). Anxiety and
performance: The processing efficiency theory.
Cognition & Emotion, 6(6), 409-434.
Franco, A., & Roach, S. S. (2017). Factors That Determine
Accounting Anxiety Among Users of English as a
Second Language Within an International MBA
Program. International Journal of Learning,
Teaching and Educational Research, 16(1).
Malgwi, C. A. (2004). Determinants of accounting anxiety
in business students. Journal of College Teaching
and Learning, 1(2), 81-94.
Zakiah, F. (2013). Pengaruh Kecerdasan Intelektual,
Kecerdasan Emosional dan Kecerdasan Spiritual
terhadap Pemahaman Akuntansi. Diunduh dari:
repository.unej.ac.id
Sugiyono (2007). Metode Penelitian Kuantitatif, Kualitatif
dan R&D. Bandung: Afabeta.
Broome, T., D.Havelka. (2002). Determinants of
Computer Anxiety in Business Students. The
Review of Business Information System, Vol. 6,
Number 2.
Ghozali, Imam. (2009). Aplikasi Analisis Multivariate
dengan Program IBM SPSS 21 Update PLS Regresi.
Semarang: Badan Penerbit Universitas Diponegoro.
Bozionelos, N. (1997) Psychology of Computer Use:
XLV. Cognitive Spontaneity as a Correlate of
Computer Anxiety and Attitudes toward computer
Use.
UNICEES 2018 - Unimed International Conference on Economics Education and Social Science
112
