Determinants of Educational Access in Indonesia
Wawan Hermawan
1
, Fitrawaty
2
, Indra Maipita
2
, Haikal Rahman
2
and Anhar Fauzan Priyono
1
1
Department of Economics, Universitas Negeri Medan, Medan, Indonesia
2
Faculty of Economics, Universitas Negeri Medan, Medan, Indonesia
Keywords: Net Enrollment Ratio (NER), Mean Years of Schooling (MYS), Inequality.
Abstract: Indonesia’s economy continues to expand, as indicated by its positive economic growth. Economic growth is
expected to positively affect human resource quality in Indonesia through the improvement of net enrollment
ratio (NER) in education. In this study, the econometric model utilized for determining education access in
Indonesia relied on Susenas data between 2011 and 2015 and several macro data. The analysis result shows
there is significant effect of per capita income and the Indonesian government’s expenditure on education and
income inequality on the NER at all education levels, whereas the mean years of schooling (MYS) are solely
influenced by the government’s expenditure on education and the ages for secondary school (junior and senior
high).
1 INTRODUCTION
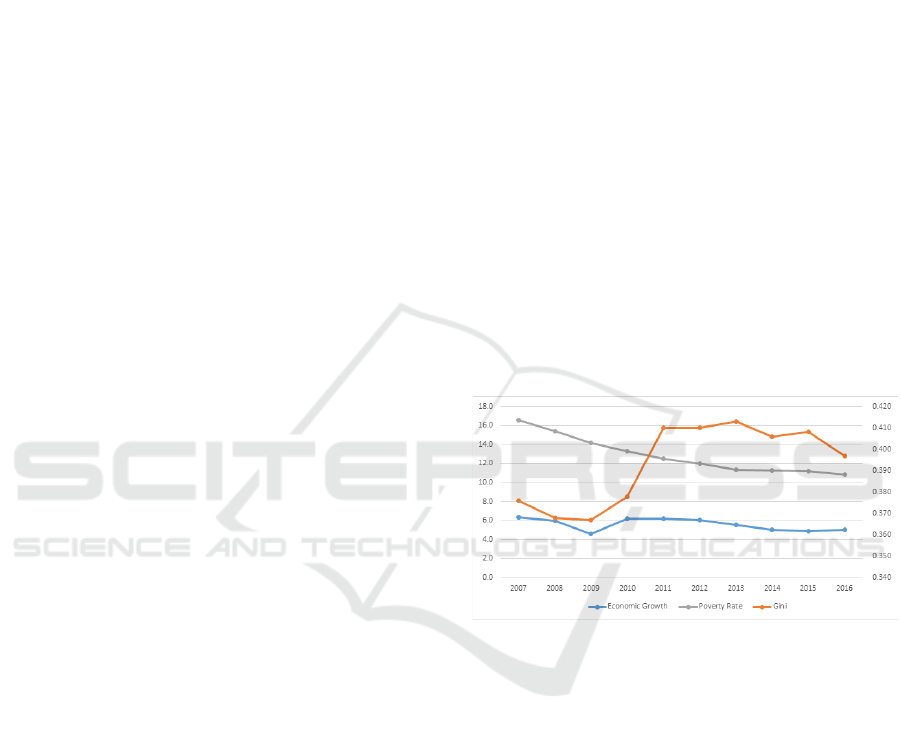
Indonesia’s economic growth seemed to slow down
from 2007 to 2016. The figure reached 5.3% in 2007
before eventually decreasing to 5% in 2016. The
progress of Indonesia’s economy was affected
adversely by many factors, including international
economic conditions. However, the poverty rate
(percentage of people living in poverty) gradually
decreased between 2007 and 2016. This effort of
developing the economy by reducing the poverty rate
was a success. Conversely, income inequality
distribution as shown by the GINI index was a cause
for concern regardless of the economic development
of Indonesia. Income inequality got worse from 2011
until 2013, but then there was a decrease in income
inequality from 2014 to 2016.
Figure 1 reflects developments in Indonesia’s
economic growth, level of poverty and income
inequality from 2007 until 2016. The chart shows that
there is high-income inequality when poverty is
higher than 10%. This is bound to happen when
poverty per capita per month in 2016 was 364.527
IDR for urban areas and 34.647 IDR for rural areas.
It means there are more people living in poverty when
the need is higher than the poverty level.
Source: Adapted from Central Bureau of Statistics.
Figure 1: Economic Growth, Poverty Rate, and Income
Inequality in Indonesia Year 2007-2016.
The success of economic growth in Indonesia can
be identified from how economic growth related to
the improvement of human resource quality. One of
the economic development purposes is to make
human as a resource and acknowledge human as a
subject, not an object (Human Centered
Development). Education is fundamental in shaping
better human skills as a form of the core ideas of
development. The main objective of development is
sustainable education and health care (Todaro, and
Smith, 2012). Education plays an important role in
developing a country because it is an investment to
improve human resource skill, physical strength, and
adaptation ability in utilizing techniques for operating
machine tools used in industry (World Bank, 1996).
92
Hermawan, W., Fitrawaty, ., Maipita, I., Rahman, H. and Priyono, A.
Determinants of Educational Access in Indonesia.
DOI: 10.5220/0009494900920098
In Proceedings of the 1st Unimed International Conference on Economics Education and Social Science (UNICEES 2018), pages 92-98
ISBN: 978-989-758-432-9
Copyright
c
2020 by SCITEPRESS – Science and Technology Publications, Lda. All rights reserved
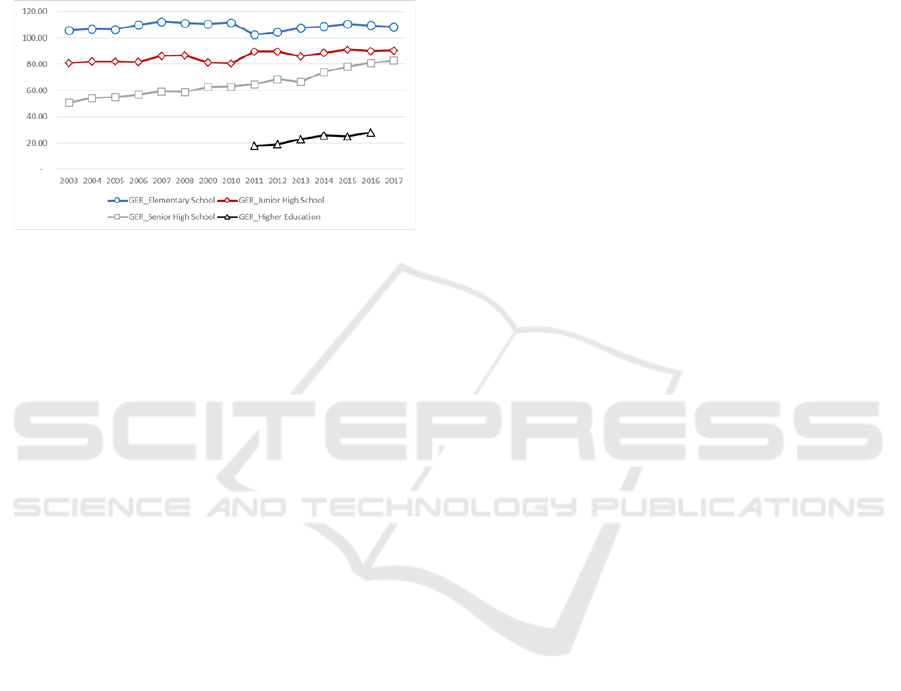
After more than 40 years of development,
Indonesia displays its impressive improvement in
several indicators of education. In general, there was
an increase in the enrollment ratio for elementary and
secondary schools shown in Figure 2. Generally, the
enrollment ratio increased from 2003 until 2017 with
gross enrollment ratio (GER) for elementary school
grew from 105.80 to 108.5 in that period.
Source: Adapted from the Central Bureau of Statistics.
Figure 2: Gross Enrollment Ratio (GER) Year 2003-2017.
While the gross enrollment ratio (GER) for junior
high school was 81.10 in 2003 and 90.23 in 2017.
This trend was different from the enrollment ratio for
senior high school and higher education in 2003-2017
which had an average number of 65.16 and 23.16
respectively. Data for higher education was not
available enough like others. Although the number is
considered low, the trend goes upward consistently.
However, the mean years of schooling (MYS) within
aged 15 and above increased from 7.24 years in 2004
to 7.92 years in 2011.
Meanwhile, the challenges and problems in
Indonesia’s education are still about achievement
inequality in the education sector. This inequality
happens in several forms including number of gender
(male and female), place of living (rural and urban
areas), and poverty level (the lowest 20% of people
with low income, and the highest 20% of people with
high income). Fahmi and Satriatna (2013) stated that
the gap of achievements in education according to the
place or living (rural and urban areas) indicated that
people living in urban areas were more likely to be
superior in academic achievement compared to those
living in rural areas.
Yusuf (2014) also said that there was a decrease
in the gap of literacy based on gender between in 1992
and in 2010 which finally reached 5% gap. However,
the net enrollment ratio of junior high school for
people living in urban areas is always higher than
those living in rural areas. At the start of the study,
the gap between net enrollment ratios was wide with
around 30% while at the end of the study, the gap was
only 5%. Further, the inequality in the net enrollment
ratio for people living in urban and rural areas who
enter university decreased but still considered high.
Finally, the average years of schooling for people
living in urban and rural areas showed only a slight
change.
2 LITERATURE STUDY
The possibility of a nation’s economic growth is
highly affected by national resources, including
human capital, physical capital, or resource
endowment. Harbison (1973) stated that human
capital is the underlying basis of national assets.
Physical capital and resource endowment are factors
of production which are passive while human capital
is an active resource. People are subjects that always
actively collect capital needed for economy; exploit
natural resources; build social organizations,
economy, and politics; and execute national
development. A country will never grow when the
human capital quality is not fully and effectively used
for improving national economic development and
management.
Schultz (1961) argued that a society should invest
in its members through providing expenses for the
needs of education, training, research, and health to
optimize human resource productivity. Human
capital is a machine for economic development (Azid
and Khan, 2010). Education is the basis of human
capital quality, the higher the educational attainment,
the higher the quality and productivity of human
capital. Every person has their own path and time in
achieving proper educational attainment and health
sustainability as the measuring criteria for human
capital quality. High educational attainment and good
healthy life are defined as something requiring high
cost for certain society. It means not all people can
get the same level of educational attainment and
healthy life. Educational attainment is influenced by
various factors as have been discussed and published
in many academic journals.
Many researchers have mentioned the variables
affecting education like income per capita ,
population growth rate, government expenditure on
education, total and urban population, which all are
significant variables for adult educational attainment
in many developing countries (Mazumdar, 2005).
Meanwhile, Faguet and Sánchez (2008) proposed
more various variables to identify those variables’
effect on education. They include per capita
expenditure of public education, government
expenditure on education, growth in regional
Determinants of Educational Access in Indonesia
93

expenditure, student–teacher ratio, politics,
household demography, and socioeconomic status.
Poverty significantly impacts on people’s lives,
not only for those living in poverty but also for people
living in prosperity. Poverty is both individual and
social problem which means every nation should
work together defeating poverty. The best way to
escape poverty is through education (Maipita, 2014,
2016). Empirical evidence shows that better access to
education for lower socioeconomic status is pivotal in
saving a nation from poverty. Poverty can be caused
by: (a) low quality of human resource caused by low
level of education, (b) difficult and limited access of
capital ownership, (c) low technological competence,
(d) inefficient use of resources, and (e) high
population growth (Sharp et al., 2000). Many
research results imply that economic growth can
improve per capita income that will finally lead to the
decrease of poverty ratio (Dollar and Kraay, 2001;
Field, 1989).
3 RESEARCH METHOD
This study followed a model built according to the
main literature from Rajkumar and Swaroop (2008)
and some complementary articles including from
Anyanwu (2007); Checchi (1999); Flug et al. (1998);
Pritchett and Filmer (1999); and Psacharopoulos
(1994). A model of educational data results is
developed into two categories, enrollment ratio and
years of schooling. Both were assumed to be the main
indicators of education besides many other variables.
The categories used for enrollment ratio were
Elementary School (ES), Junior High School (JHS),
and Senior High School (SHS), as the score results of
education. The first model was the determinant of
enrollment which was divided into three levels of
education: ES, JHS, and SHS in net enrollment ratio
(NER). The second model was the determinant of
mean years of schooling (MYS). The independent
variables taken from the result of literature studies
were per capita income; government expenditure on
education; GINI coefficient; and age from people
aged 7-12 years old (Elementary School age), 3-15
year old (Junior High School age), and 16-18 years
old (Senior High School age).
The data used in this study was from the Susenas
2011-2015. The macro economic and fiscal data were
collected from the Central Bureau of Statistics and the
Ministry of Finance, Directorate General for Fiscal
Affairs of the Republic of Indonesia. Unit analysis
was done at the provincial level annually.
Additionally, the econometric model was formed
from panel and time series data during 2011-2015,
and cross section data for provinces in Indonesia.
To analyze the significant relationship between
independent and dependent variables from regression
econometric model, hypothesis testing on the
parameters of population regression function was
conducted. This hypothesis testing covered single
parameter significance test and overall test on the
population regression function. T-test was used for
hypothesis testing in parameters of a single
population while the significance of overall
regression was tested using f-test (Wooldridge,
2009). To identify whether there was
multicollinearity, Variance Inflation Factor (VIF)
was utilized. Then the white test was employed for
analyzing Heterocedasticity.
4 RESULT AND DISCUSSIONS
In this section, the estimation results for each
equation are discussed. The model is estimated by
using the Fixed Effect for 29 provincial data and 5
years of observation from 2011 to 2015. There are 5
provinces that are not included in the estimation
because the data is not available. The five provinces
are: Riau Islands Province, Jakarta Special Capital
Region Province, Gorontalo Province, West Sulawesi
Province and West Papua Province. The 29 provinces
are considered to be sufficient to represent Indonesia.
Hence, the analysis can still be done.
The Fixed Effect model was chosen because it has
the ability to make model specifications for each
variable from the data cross-section. This is to
provide an in-depth analysis of each province in the
model. This makes it easy to determine which
provinces have a greater impact, having different
roles based on coefficient signs.
One of the key indicators of educational
performance is school enrollment and mean years of
schooling. Table 1 is the result of estimation for
elementary school, junior high school (NER_JHS)
and senior high school (NER_SHS) school
enrollment and the estimation results for mean years
of schooling (MYS) as the dependent variable and all
in percent units. Independent variables consisting of
Per Capita Income (PCI) in natural logarithms,
government expenditure on education (GOV_Ed) in
percent units against the GRDP of each province.
GINI variables remain in index units and age
variables. The elementary school age (AGE712),
junior high school age (AGE1315) and senior high
school age (AGE1618) are all in percent units of the
population.
UNICEES 2018 - Unimed International Conference on Economics Education and Social Science
94
The models in equations 2 through 4 are estimated
using AR ( 2) to get a better estimation result.
Equation 1 does not use AR (auto regressive), so the
estimation results are satisfactory. Table 1 provides
an overview of the four similarities in determining
school enrollment and determining the mean years of
schooling estimated.
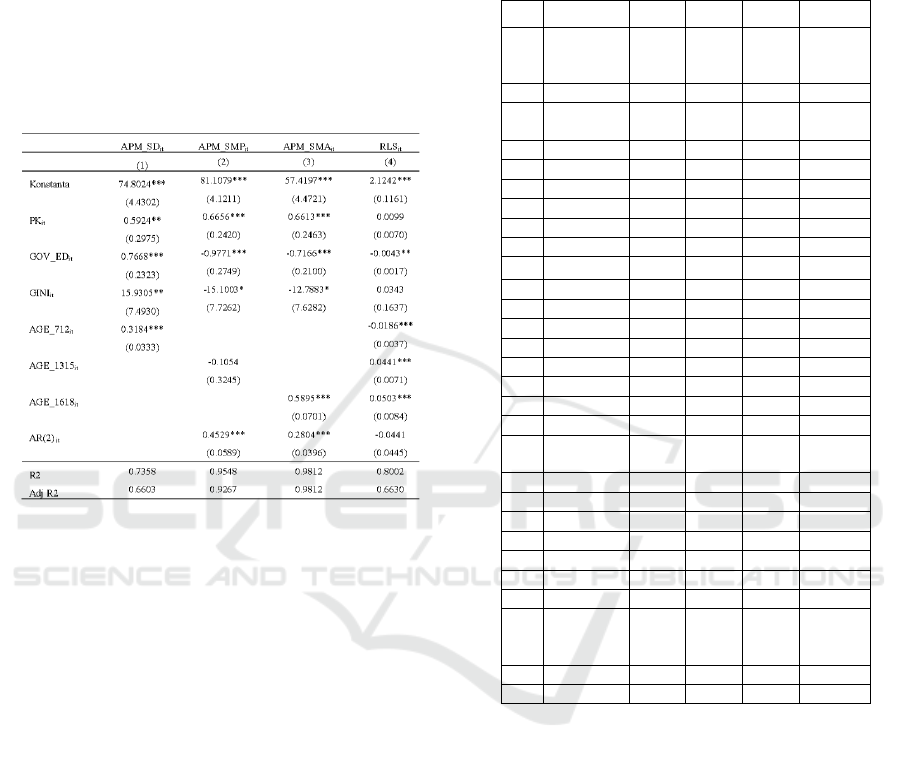
Table 1: Estimation Results Using Fixed Model Effect for
the Equation of School Enrollment Rate Determinants and
Mean Years of Schooling Determinants.
Notes:
In parentheses shows the standard error
* shows the significance level at alpha 10%
* * shows the significance level at alpha 5%
** * shows the significance level at alpha 1%
School enrollment at the elementary, junior high
and senior high school levels in Indonesia is equally
affected by per capita income level. The higher the
level of per capita income, the higher the level of
school enrollment from elementary, junior high and
senior high school levels. While it is viewed as
coefficient, the per capita income at the junior high
school level has a greater influence when compared
to elementary and senior high schools. One percent
increase in per capita income will increase junior high
school enrollment by 0.67%, while equalization in
elementary school enrollment is only 0.59% and
0.66% at the senior high school level.
The per capita income variable for school
enrollment rates from the elementary school level is
effective in Aceh Province with a coefficient of 4.3.
This figure is obtained by doing model specifications
for per capita income (PCI). The figure 4.3 shows the
high level of elasticity for increasing welfare can
increase elementary school enrollment. The highest
elasticity for junior high school enrollment is Central
Kalimantan, Bali and North Sulawesi, while for
senior high school enrollment, the highest per capita
income is West Sumatra, South Sumatra and Aceh.
Table 2: The per capita income variable coeficiente.
No
Prov
ES
JHS
SHS
MYS
1
Aceh
4.33
-
10.6
1
7.01
0.14
2
Sumut
2.06
3.16
3.38
-0.22
3
Sumbar
2.85
3.39
19.5
7
0.22
4
Riau
0.30
0.56
2.70
0.05
5
Jambi
0.76
1.31
5.14
-0.01
6
Sumsel
-4.20
0.76
7.32
0.76
7
Bengkulu
-0.02
0.44
-2.70
0.02
8
Lampung
0.92
-2.69
0.36
0.18
9
Babel
0.36
-0.88
-3.52
-0.03
10
Jabar
-1.89
-0.48
-1.53
-0.21
11
Jateng
-2.30
0.09
2.83
0.12
12
Yogya
-0.21
-7.17
-3.41
-0.23
13
Jatim
-0.65
-4.31
-8.53
-0.09
14
Banten
2.30
1.52
1.88
0.56
15
Bali
-0.26
4.29
2.99
0.12
16
NTB
-0.14
-1.09
-3.27
0.33
17
NTT
1.21
2.79
5.96
-0.03
18
Kalbar
1.53
-1.56
6.05
0.49
19
Kalteng
1.31
13.0
9
5.88
0.16
20
Kalsel
3.47
-0.23
1.71
0.02
21
Kaltim
0.76
-0.18
-0.11
0.01
22
Kalut
-5.59
-6.96
-8.13
-0.19
23
Sulut
-1.68
4.09
1.28
0.00
24
Sulteng
0.42
3.05
0.08
0.29
25
Sulsel
3.48
1.04
-0.96
0.01
26
Sultra
1.89
0.93
1.97
0.00
27
Maluku
-4.40
-8.79
-
11.0
2
-0.01
28
Malut
-0.64
-4.49
0.62
-0.05
29
Papua
0.10
-0.13
-0.04
0.06
Source: Processed Data.
Government expenditure on education variables
has a positive influence on school enrollment only at
the elementary level. At the junior and senior high
school level, it has a negative influence. This is
certainly in contrast to the concept of increasing
school enrollment with an increase in the budget for
education at the junior and senior high school level.
All variables have a statistically significant effect on
the greatest level of trust, which is 99%. The mean
years of schooling equation also shows the negative
influence of the government expenditure on
education variable. This shows the ineffectiveness of
education spending to increase school enrollment.
The model specification for the government
expenditure on education variables shows that not all
provinces have a negative influence. This shows that
Determinants of Educational Access in Indonesia
95

several provinces can actually increase school
enrollment by issuing budgets for education. Aceh is
one of the provinces showing the effectiveness of
education spending to increase school enrollment.
Income inequality variables have a significant
influence on school enrollment at the elementary,
junior high and senior high school level. Increasing
GINI ratios or inequality worsen will have an impact
on increasing school enrollment at the elementary
level, while for junior and senior high schools it
shows the opposite effect. Higher inequality actually
decreases school enrollment rates for junior and
senior high schools.
Table 3: The Government Expenditures on Education
Variable coefficients.
No
Prov
ES
JHS
SHS
MYS
1
Aceh
1.79
0.66
0.54
-0.01
2
Sumut
-2.06
-7.35
-6.15
0.05
3
Sumbar
4.39
-0.43
1.19
-0.13
4
Riau
0.34
-4.33
-7.37
-0.45
5
Jambi
5.66
4.12
20.85
0.51
6
Sumsel
4.8
-3.88
-12.02
-0.07
7
Bengkul
u
2.31
0.10
3.70
0.10
8
Lampun
g
0.85
0.95
1.98
0.10
9
Babel
3.22
23.22
11.16
0.02
10
Jabar
-9.32
-5.67
-16.70
-2.02
11
Jateng
-3.46
-3.44
-9.35
0.28
12
Yogya
2.65
-2.06
0.70
0.06
13
Jatim
-5.95
-7.63
-20.93
0.26
14
Banten
-0.07
0.43
-2.76
-0.14
15
Bali
-0.88
-1.39
-2.31
0.23
16
NTB
0.17
-0.41
-0.60
-0.03
17
NTT
0.47
-1.76
-0.71
0.01
18
Kalbar
0.06
-3.19
0.62
-0.08
19
Kalteng
1.80
-3.22
-1.58
-0.31
20
Kalsel
3.94
-1.26
0.88
0.25
21
Kaltim
5.65
-5.72
-3.13
0.00
22
Kalut
1.24
-0.73
0.32
-0.03
23
Sulut
7.81
-10.78
-6.39
-0.35
24
Sulteng
-1.23
-4.12
-1.70
0.25
25
Sulsel
-5.03
-2.60
-3.96
0.03
26
Sultra
-1.44
-1.56
-3.08
-0.01
27
Maluku
1.05
-2.37
-1.67
0.00
28
Malut
0.22
0.95
-0.23
-0.02
29
Papua
-16.03
-16.73
-11.68
-0.17
Source: Processed Data.
Table 4: Income inequality for education variables
coefficient.
No
Prov
ES
JHS
SHS
MYS
1
Aceh
81.41
-294.56
442.85
-0.51
2
Sumut
33.94
-66.06
-89.44
-2.80
3
Sumbar
6.79
-22.68
-103.59
-2.00
4
Riau
47.80
0.81
-26.97
3.91
5
Jambi
-123.67
15.35
208.08
2.92
6
Sumsel
-30.06
74.24
32.46
0.77
7
Bengkul
u
-37.75
-187.14
-318.21
-2.56
8
Lampun
g
46.99
19.14
-101.48
-4.88
9
Babel
-18.35
-157.77
58.98
-3.23
10
Jabar
-14.40
-54.21
-200.84
2.55
1
11
Jateng
187.17
4.26
-98.84
-55.09
12
Yogya
15.04
148.12
399.58
5.18
13
Jatim
49.22
41.08
178.00
-0.35
14
Banten
34.52
19.98
53.81
-1.86
15
Bali
59.40
50.06
4.35
-2.42
16
NTB
25.23
37.83
111.29
3.72
17
NTT
-5.44
-826.17
477.88
-4.96
18
Kalbar
2.44
-54.97
0.88
0.91
19
Kalteng
9.16
-41.01
-29.26
0.79
20
Kalsel
12.65
-82.83
-64.94
3.93
21
Kaltim
-11.15
9.22
-119.81
-4.22
22
Kalut
58.98
13.30
55.38
-1.16
23
Sulut
22.31
-33.53
-
15.33
-2.06
24
Sulteng
23.39
-189.57
38.64
6.93
25
Sulsel
-47.22
6.83
-101.37
-1.35
26
Sultra
-131.47
-195.05
-386.10
-0.68
27
Maluku
-68.20
-113.02
-174.92
0.83
28
Malut
-114.05
89.68
-31.31
-0.02
29
Papua
3.49
-83.99
9.19
2.42
Source: Processed Data.
Especially for the equation one or elementary
school enrollment rate, the age of elementary school
students or around the age of 7 to 12 years has a
positive influence on elementary school enrollment.
With more residents ages 7 to 12 years old,
elementary school enrollment is increasing. For
junior high school level, junior high school age or
around 13 to 15 years old will have a negative impact
even though it does not have a statistical effect. If the
percentage of junior high school age increases, then
the junior high school enrollment rate will decrease.
For the senior high school level, it has a positive and
statistically significant effect.
Per capita income for equation two (junior high
school level) has a greater influence when compared
to equation one (elementary school level) and
equation 3 (senior high school level). Variable per
capita income for school enrollment rates from the
elementary school level is effective in Aceh Province
with a coefficient of 4.3. The highest elasticity for
junior high school enrollment is Central Kalimantan,
UNICEES 2018 - Unimed International Conference on Economics Education and Social Science
96

Bali and North Sulawesi. While for senior high school
enrollment, the highest per capita income is West
Sumatra, South Sumatra and Aceh.
Government expenditure on education variables
has a positive influence on school enrollment only at
the elementary school level. At the junior and senior
high school level, it has a negative influence.
Income inequality variables have a significant
influence on school enrollment at the elementary,
junior high and senior high school level. Increasing
GINI ratios or worsening inequality will have an
impact on increasing school enrollment at the
elementary school level, while for junior and senior
high schools it shows the opposite effect.
Age among elementary school students or around
the age of 7 to 12 years has had a positive influence
on elementary school enrollment. The more residents
ages 7 to 12 years, the more elementary school
enrollment. For junior high school level, junior high
school age or around 13 to 15 years old will have a
negative impact even though it does not have a
statistical effect. If the percentage of junior high
school age increases, then the junior high school
enrollment rate will decrease. For the high school
level, it has a positive and statistically significant
effect.
For the mean years of schooling modeled on
Equation Four in Table 1, per capita income does not
have a significant effect on the mean years of
schooling, although it has a positive sign.
Government expenditure on education also does not
encourage the increasing the mean years of schooling,
and even decreases with the increase of the
government expenditure for education. Income
inequality variables or GINI have no significant
effect. From elementary, junior high and senior high
school age variables, only the senior high school age
does not affect the mean years of schooling.
Per capita income has no significant effect on the
mean years of schooling. Government expenditure on
education also does not encourage the increasing the
mean years of schooling, and even decreases with the
increase of the government expenditure on education.
Income inequality variables or GINI have no
significant effect. From elementary, junior high and
senior high school age variables, only the senior high
school age does not affect the mean years of
schooling.
5 CONCLUSIONS
Per capita income at the junior high school level has
a greater influence compared to elementary and
senior high school. Per capita income variables for
school enrollment rates from the elementary school
level are effective in Aceh Province with a coefficient
of 4.3. The highest elasticity for junior high school
enrollment is Central Kalimantan, Bali and North
Sulawesi, while for senior high school enrollment, the
highest per capita income is West Sumatra, South
Sumatra and Aceh.
Government expenditure on education variables
has a positive influence on school enrollment only at
the elementary level. At the junior and senior high
school level it has a negative influence.
Income inequality variables have a significant
influence on school enrollment at the elementary,
junior high and senior high school level. Increasing
GINI ratios or worsening income inequality will have
an impact on increasing school enrollment at the
elementary school level. While for junior and senior
high schools, it shows the opposite effect.
Age among elementary school students or around
the age of 7 to 12 years has had a positive influence
on elementary school enrollment. The more residents
ages 7 to 12 years, the more elementary school
enrollment. For junior high school level, junior high
school age or around 13 to 15 years old will have a
negative impact even though it does not have a
statistical effect. If the percentage of junior high
school age increases, then the junior high school
enrollment rate will decrease. For the high school
level, it has a positive and statistically significant
effect.
Per capita income has no significant effect on the
mean years of schooling. Government expenditure on
education also does not encourage the increasing the
mean years of schooling, and even decreases with the
increase of the government expenditure on education.
Income inequality variables or GINI have no
significant effect. From elementary, junior high and
senior high school age variables, only the senior high
school age does not affect the mean years of
schooling.
REFERENCES
Anyanwu, J. C. and Erhijakpor, A. E. O. (2007). Education
Expenditures and School Enrolment in Africa:
Illustrations from Nigeria and Other SANE Countries.
Economic Research Working Paper, No. 92.
Azid, T, and Rana E. A. K. (2010). Who Are the Children
Going to School in Urban Punjab (Pakistan)?
International Journal of Social Economics 37(6):442–
65.
Checchi, D. (1999). Inequality in Incomes and Access to
Education: A Cross-Country Analysis. Retrieved
Determinants of Educational Access in Indonesia
97

October 18, 2014 (https://air.unimi.it/retrieve/handle/
2434/15297/85963/Inequality in Incomes and
Access.pdf).
Dollar, D, and Kraay, A. (2001). Growth is Good for the
Poor. World Bank Policy Research Working Paper
2587, Washington, D. C. World Bank.
Faguet, J. P., and Fabio S. (2008). Decentralization’s
Effects on Educational Outcomes in Bolivia and
Colombia. World Development 36(7):1294–1316.
Fahmi, M., and Ben S. (2013). Development in Education
Sector: Are the Poor Catching Up? Working Paper at
the Center for Economics and Development Studies,
Padjadjaran University (6).
Fields, G. S.(1989). Changes in Poverty and Inequality in
the Developing Countries, Mimeographed Paper.
Flug, K., Spilimbergo, A. and Wachtenheim, E. (1998).
Investment in Education: Do Economic Volatility and
Credit Constraints Matter? Journal of Development
Economics 55(2):465–81.
Harbison, F. H. (1973). Human Resources as the Wealth of
Nations, New York: Oxford University Press.
Maipita, I. (2014). Mengukur Kemiskinan dan Distribusi
Pendapatan. Yogyakarta: UPP STIM YKPN.
Maipita, I., Hermawan, W., Fitrawaty., Soetjipto, B. E.
(2016). The Impact of Middle Class Spending on
Economic Growth and Industry in Indonesia.
International Journal of Economic Research, 13(2):
813-828.
Pritchett, L., and Filmer, E. (1999). What Education
Production Functions Really Show: A Positive Theory
of Education Expenditures. Economics of Education
Review 18:223–39.
Psacharopoulos, G. (1994). Returns to Investment in
Education: A Global Update. World Development
22(9).
Rajkumar, A. S, and Vinaya S. (2008). Public Spending and
Outcomes: Does Governance Matter? Journal of
Development Economics 86(1):96–111.
Schultz, T. W. (1961). Investments in Human Capital. The
American Economic Review, 51(1):1–17.
Sharp, A. M., Register, C. A., Grimes, P. W. (2000).
Economics of Social Issues 14th edition, New York:
Irwin/McGraw-Hill.
Todaro, M. P., and Stephen C. S. (2012). Economic
Development Eleventh Edition. 11th.
Wooldridge, J. M. (2009). Introductory Econometrics: A
Modern Approach. South-Western.
World Bank. (1996). World Development Report: From
Plant to Market. World Bank Publications.
Yusuf, A. A. (2014). Has Prosperity Been For All?
Revisiting the Trend of Various Dimensions of
Inequality in Indonesia. International NGO Forum on
Indonesian Development.
UNICEES 2018 - Unimed International Conference on Economics Education and Social Science
98
