
Computational Fluid Dynamic Simulation of Clearance Effect and
Velocity in Liquid Mixing System
Bayu Triwibowo
1
, Astrilia Damayanti
1
, Anwaruddin Hisyam
2
,
Dessy Ratna Puspita
1
, Dwiana Asmara
Putri
1
1
Department of Chemical Engineering,Universitas Negeri Semarang,Semarang, Indonesia
KampusUNNES Sekaran Gunungpati, Semarang 50229, Indonesia
2
Faculty of Chemical and Natural Resources Engineering, Universiti Malaysia Pahang, Lebuhraya Tun Razak,
26300, Kuantan, Pahang Darul Makmur, Malaysia
Keywords: Stirred Tank , CFD, MRF, LES, axial pressure.
Abstract: Stirred tank is one of the most important process-support tools in the industrial world, either in the food,
pharmaceutical, oil or gas industries. The stirring process in a stirred tank involves miscible liquid stirring,
gas dispersion or immiscible liquid into the liquid phase, suspension of solid particles, heat and mass
transfer and chemical reactions. This research aims to study the characteristic of the stirring process by
simulating the stir-equipped tank with water fluid that will be validated by experimentation that has been
done. The stirring process is done by simulating computational fluid dynamics (CFD) using multiple
reference frame (MRF) simulation method, modeling large eddy simulation (LES) flow turbulence and
stirring speed variable. The stages in the simulation of the stirring process include pre-process, solving and
post process. The simulation results have been validated by experiments conducted by Ivan Fort et al. The
erosion at the bottom of the tank is predicted by observing the axial pressure distribution shown by the
observation point..
1 INTRODUCTION
Stirred tanks are widely used for mixing of two
miscible fluids in the chemical, food and process
industries (Zadghaffari et al, 2008). In the various
applications, stirred tanks are required to fulfill
several needs like suspension of solid particles,
dispersion of gases into liquids, heat and mass
transfer, etc.
Agitation of solid-liquid system will caused
erosion in apparatus wall stirred tank. Erosion on
solid-liquid system have been studied by researcher
such as CFD simulation and experimental analysis
of erosion in a slurry tank test rig (Azimian and
Bart, 2013) dan Slurry Erosion in Complex Flows :
Experiment and CFD (Graham, Lester & Wu, 2009).
Azimian et al (2013) have reported that hydro-
erosion occurs in practice in two ways, one is the
erosion by cavitations of liquid and on the other
hand is the erosion by solid particles entrained in
liquid flow known as slurry erosion.
Erosion rate is generally considered as the main
function of influence particle rate, velocity and
impact angle, so that the distribution of erosion rate
depend on those factor. If the erosion is not equally
distributed may cause tools damages. The uniform
distribution will be achieved if the characteristic of
erosion rate for geometrical agitated tank
modification has known as a basic of engineering
technology (Graham et al, 2009). The rate of erosion
distribution can be determined from erosion model,
which can be a very useful tool for prediction..
Computational modeling has always been
presented as an option for the hydrodynamic
analysis of such systems as it is far inexpensive and
enables the study of detailed description of
multiphase flow. CFD modelling, however, can only
be applied after proper validation (Wadnerkar et al.,
430
Triwibowo, B., Damayanti, A., Hisyam, A., Puspita, D. and Putri, D.
Computational Fluid Dynamic Simulation of Clearance Effect and Velocity in Liquid Mixing System.
DOI: 10.5220/0009012604300434
In Proceedings of the 7th Engineering Inter national Conference on Education, Concept and Application on Green Technology (EIC 2018), pages 430-434
ISBN: 978-989-758-411-4
Copyright
c
2020 by SCITEPRESS – Science and Technology Publications, Lda. All rights reserved
2012). Therefore, CFD can be used to achieve
characteristic of axial pressure distribution at stirred
tank wall to predict the erosion rate. In an attempt to
find a suitable computation technique for the
hydrodynamics simulations, Fradette et al. (2007)
assessed the accuracy of Shear-Induced Migration
Model (SIMM) to capture the particle suspending
phenomenon and particle migration in solid-liquid.
Fort et al (2009) studied about the distribution of the
local dynamic axial pressures along the flat bottom
of a pilot plant cylindrical mixing vessel equipped
with four radial baffles and stirred with a four 45°
pitched blade impeller pumping downwards. A set
of pressure transducers is located along the whole
radius of the flat bottom between two adjacent
baffles. The radial distribution of the dynamic
pressures indicated by the pressure transducers will
be determined in dependence on the impeller off-
bottom clearance and the impeller speed.
2 EXPERIMENTAL METHOD
This research simulated mixing of liquid system in
stirred tank conducted from an experiment by Fort et
al. (2009) with pitched blade turbine. Simulations
carried out by ANSYS academic license which the
method uses Large Eddy Simulation (LES) and
Multiple Reference Frames (MRF) to describe
turbulence flow in a stirred tank
The experiment uses a stirred tank fullgrid 3-D
(360
o
) to get a flow pattern that approaches the
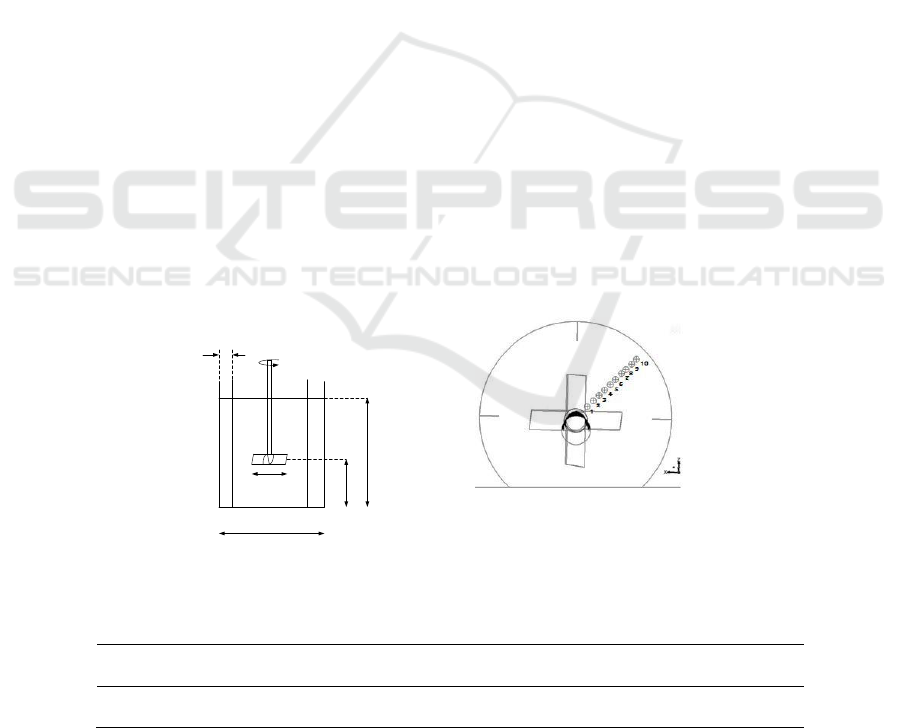
actual conditions. The mixing simulation were
conducted in a flat bottomed cylinder stirred vessel
with inner diameter T= 0.49 m, agitated by a 4-blade
45
o
pitched blade turbine (PBT) of diameter
D=(2/5)T. This vessel is equipped with four radial
baffles (b = 0.1 T), as illustrated in Figure 1 and
Table 1. The height of liquid was set at H=T and
impeller off-bottom clearance were T/4 and T/3 with
rotational speed 284 and 412 rpm. Materials used in
the simulation of liquid system is water with room
temperature. In this research to observe the axial
pressure distribution at the bottom of the stirred
tank, 10 observation points need to be made, as
illustrated in Figure 2. The figure is adapted from
Fort et al (2009) with configuration and point
distance shown in Table 2.
(a) (b)
Figure 1: (a) Configuration Tank, (b) Bottom View of Observation Point.
Table 1: Configuration Tank.
Tank
Diameter
Impeller
Diameter
Baffle
(B
w
)
Liquid Height (H)
Lebar
blade (W
b
)
Tinggi
hub
0.49 m
0.5 T
0.1 T
H=T
0.1 T
0.11 T
D
Bw
C
H
T
Computational Fluid Dynamic Simulation of Clearance Effect and Velocity in Liquid Mixing System
431
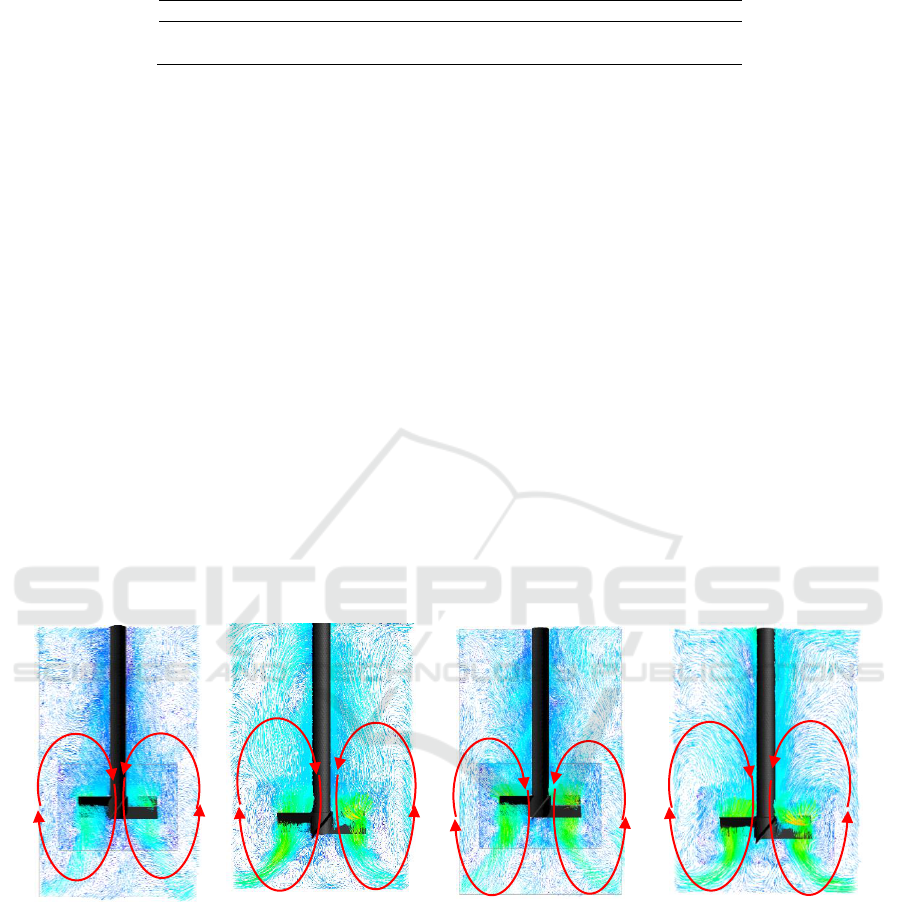
Table 2: Distance of Each Point in Bottom Vesel.
3 RESULT AND DISCUSSION
Flow Pattern
Flow patterns distribution in a stirred tank are very
important to know the circulation flow during the
mixing process which will leads to an impact on
mixing optimization. Observation of the flow pattern
distribution is done by observing the flow direction
that occurs during the mixing process produced by
impeller. Simulated vector plots of the flow
produced by the PBT using MFR and LES models
are presented in Figures 3. Figure 2. shows the
velocity vector due to flow turbulence that occurs
during the mixing process because of the friction
between the fluid and the tank wall. Variation of
rotational speed affects the vector velocity produced.
The high rotational speed and the longer mixing
time would increase turbulance flow.
Based on Figure 2 also shows that the flow
pattern generated from the simulation is in
accordance with the flow pattern of the literature
(Wallas, 1990). However, for hydrodynamic fluid
with various of Clearance has slightly different flow
pattern (Mukhaimin et al., 2016). Clearance of T/4
can reach a maximum speed in the area of the tank
that makes liquid easier to elevate from the bottom
of the tank than T/3.
Axial Pressure Distribution
At the beginning, it is necessary to check the validity
of the CFD code and the numerical method
performed. In order to achieve the objective, we
refer to the experimental work presented by Fort et
al. [2].With the same geometry (i.e. a baffled
cylindrical vessel with a flat bottom), variations of
the axial pressure along the vessel bottom are
predicted and presented on Figure 3 and Figure 4.
For purpose of validation, simulation results have
been compared to experimental data for different
clearance and rotational speed in the tank that shown
below.
(a) (b) (c) (d)
Figure 2: Flow Pattern (a) 284 rpm at Clearance T/3 (b) 284 rpm at Clearance T/4 (c) 412 rpm at Clearance T/3 (d) 412
rpm at Clearance T/4.
Point
1
2
3
4
5
6
7
8
9
10
Distanc
e (cm)
4
6.2
8.2
10.2
12.2
14
16.2
17.7
19.7
21.5
EIC 2018 - The 7th Engineering International Conference (EIC), Engineering International Conference on Education, Concept and
Application on Green Technology
432
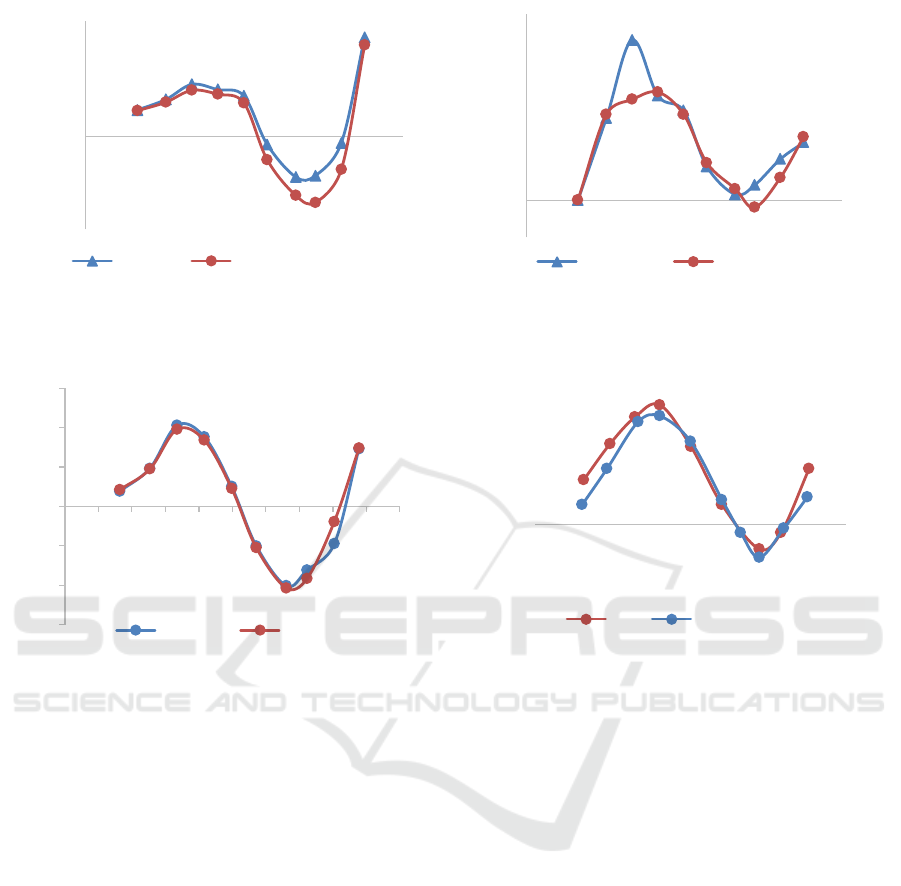
(a) (b)
Figure 3: Data Axial Pressure Distribution at Clearance T/3 (a) Simulation Data (b) Experimental Data.
(a) (b)
Figure 4: Data Axial Pressure Distribution at Clearance T/4 (a) Simualtion Data (b) Experimental Data.
Figure 3. shows data of axial pressure
distribution at clearance T/3, the simulation data
showed that at R 0.57 to 0.8 axial pressure to Y
negative axis direction in both impeller speed, where
point at Y negative axis direction indicates an
erosion. At impeller speed 412 rpm given axial
pressure to Y negative axis direction bigger than
impeller speed 284 rpm. Meanwhile, the experiment
data shows that at impeller speed 284 rpm doesn’t
show any axial pressure to Y negative axis direction
but have trend close to y negative axis direction
between R 0.6 to 0.7, but impeller speed 412 rpm
showed one point to Y negative axis direction at R
0.7. Based on the results, by increasing the impeller
rotational, the speed of the turbulence flow and axial
pressure distribution increases.
Figure 4. shows data of axial pressure
distribution at clearance T/4 for simulation and
experiment data. Simulation data shows that both
impeller have 4 point at R 0.57 to 0.8 where axial
pressure distribution to Y negative axis direction and
experimental data shows 3 point at R 0.6 to 0.8 of
axial pressure distribution to y negative axis
direction. Those point to Y negative axis direction
shows that axial pressure distribution suppress to the
vessel bottom and indicate erosion point. Triwibowo
et al (2017) showed its all caused turbulence flow at
stirred tank of static pressure in wall tank have
sthocastic direction.
Based on Figure 3 and Figure 4, axial pressure
distribution data of simulation data and experimental
data shows good agreement. Meanwhile, trend
simulation data of axial pressure distribution at
clearance T/4 result is much more similar to the
experimental data rather than clearance T/3. The
difference values between simulation data and
experiment data result motivated us to improve the
utilizations of CFD model. Some factors that were
assumed in present calculation must be corrected in
future study include time step size, number of
iterations etc.
-0.2
-0.15
-0.1
-0.05
0
0.05
0.1
0.15
0.2
0.25
0 0.1 0.2 0.3 0.4 0.5 0.6 0.7 0.8 0.9 1
Pax
R
284 rpm 412 rpm
-0.01
0
0.01
0.02
0.03
0.04
0.05
0 0.1 0.2 0.3 0.4 0.5 0.6 0.7 0.8 0.9 1
Pax
R
284 rpm 412 rpm
-0.3
-0.2
-0.1
0
0.1
0.2
0.3
0 0.1 0.2 0.3 0.4 0.5 0.6 0.7 0.8 0.9 1
Pax
R
412 rpm 284 rpm
-0.03
-0.01
0.01
0.03
0.05
0 0.1 0.2 0.3 0.4 0.5 0.6 0.7 0.8 0.9 1
Pax
R
284 412
Computational Fluid Dynamic Simulation of Clearance Effect and Velocity in Liquid Mixing System
433

4 CONCLUSION
The models of simulation using MRF and LES used
in the present CFD simulation demonstrated an
alternative method for experimental method. The
effect of clearance showed that clearance T/4 can
reach a maximum speed which allow the liquid to
elevate much more easier from the bottom of the
tank, compare to T/3. Besides that, simulation data
of axial pressure distribution at clerance T/4 closer
to experiment data. Reasonable agreement between
experimental and simulation results was obtained.
The satisfactory comparisons indicate the potential
usefulness of this CFD approach as a computational
tool for designing stirred tank.
REFERENCES
Azimian, M & Bart, H., 2013. “CFD Simulation and
Experimental Analysis of Erosion in a Slurry
Tank Test”, EPJ Web of Conferences, Vol. 45,
pp. 1-8.
Fort, I., Hasal, P., Apglianti, A., & F. Magelli.
2009. “Axial Force at the Vessel Bottom
Induced by Axial Impellers”. Acta Polytechnica.
Vol. 48, No. 4, pp. 45-50.
Fradette, L., Thome, G, Tanguy, P.A., & Takenaka,
K.., 2007. “Power and Mixing Time Study
Involving a Maxblend Impeller with Viscous
Newtonian and Non-Newtonian Fluids”. Journal
of Chemical Engineering Research and Design,
Vol. 85, pp. 1514-1523.
Graham, L.J.W., Lester, D., & Wu, J., 2009. “Slurry
Erosion in Complex Flows: Experiment and
CFD. Seventh International Conference on CFD
in the Minerals and Process Industries CSIRO,
Melbourne, Australia 9-11 December 2009.
Triwibowo, B, Megawati, Puspita, D.R., & Putri, D.
A., 2017. “Simulasi Distribusi Shear Stress pada
Dasar Tangki Sistem Pengadukan Berbasis
Computational Fluid Dynamics (CFD)”. Jurnal
Kompetensi Teknik, Vol 9, pp. 20-28.
Wadnerkar, D., Utikar, R., Tade, M., and Pareek, V.
2012. “Simulation of solid-liquid flow in stirred
tanks at high solid loading, in Solnordal, C.B. et
al (ed), Ninth International Conference on CFD
in the Minerals and Process Industries, Dec 10-
12 2012, pp. 1-7. CSIRO, Melbourne: CSIRO.
Zadghaffari, R., Moghaddas, J.S., Ahmadlouydarab,
M., & Revstedt, J., 2009. “A mixing study in a
double-Rushton stirred tank”. Computers &
Chemical Engineering, Vol. 33, Issue 7, pp.
1240-1246.
EIC 2018 - The 7th Engineering International Conference (EIC), Engineering International Conference on Education, Concept and
Application on Green Technology
434
