
Geographic Information System Development Engineering Faculty of
Manado State University
Yeremia Brian, Quido Kainde, and Trudi Komansilan
Universitas Negeri Manado, North Sulawesi, Indonesia
Keywords: Geographic information systems, Waterfall, Manado State University
Abstract: The development of technology is very rapidly give a very big influence on the media recognition and
information systems, this study aims to Facilitate users to get more information about the introduction Faculty
of Engineering State University of Manado, Analysis conducted among others by doing research on the
products to be made and perform the data collection to Obtain the information needed. Result and
development of geographic information system media has been made and tested its usage. The Achieved
results are expected to provide convenience for the user, in Obtaining more complete information.
1 INTRODUCTION
Manado State University (UNIMA) is a public
university located in the province of North Sulawesi.
UNIMA is located in a mountainous area of Minahasa
District, 800 meters above sea level and about 40 km
from Manado, the provincial capital. Having a 270ha
area to make UNIMA as a university that has a very
wide area, campus Unima has 7 Faculties and many
buildings supporting the activities of the faculties,
staff and students, and the Faculty of Engineering is
one of the faculty in between.
Having a large area and has many of the building
and the room became a pretty big problem for most
of the students and staff and faculty, information
concerning the building and the room - the room
contained in the scope of the Faculty of Engineering
Unima.
Of the students, especially students of the first
semester or freshmen, difficult to find a room lectures
are very common in because of the lack of media
information that can provide information to be
obtained, as well as lecturer of general courses
(lecturers from other faculties) which is difficult to
determine the room lectures will used for lectures.
With the development of science and technology,
particularly in the field of Geographic Information
Systems, the authors are interested if this can be a new
breakthrough or innovation in overcoming the lack of
media recognition Unima Engineering Faculty in
particular regarding the introduction of the concept of
serving more complete information.
A system has the characteristics or specific traits,
which have components (component), the limit
system (boundary), the environment outside the
system (environments), interface (interface), the
input (input), keluatan (output), processing (process )
and goals (objectives) or destination (goal) (Hartono,
1999).
A system consists of various elements which
are complementary in achieving the goals or targets.
The elements are complementary are included in the
system are often called subsystems. The subsystem
must always relate to and interact with relevant
communications secar so the system can work
effectively and efficiently.
From every perspective, the system can be
classified as follows: Hartono, 1999
1. Abstract systems and physical systems
Abstract system is a system of thought or ideas
looks physically. While the physical system is a
system that is physically can be seen.
2. Certain systems (deterministic) dantak course
(probabilistic)
Certain systems (deterministic) system was in
operation predictable. While the system is
indeterminate (probabilistic) system the
conditions of the future is unpredictable
contains elements of probability.
3. Closed systems and open systems
398
Brian, Y., Kainde, Q. and Komansilan, T.
Geographic Information System Development Engineering Faculty of Manado State University.
DOI: 10.5220/0009012103980402
In Proceedings of the 7th Engineering International Conference on Education, Concept and Application on Green Technology (EIC 2018), pages 398-402
ISBN: 978-989-758-411-4
Copyright
c
2020 by SCITEPRESS – Science and Technology Publications, Lda. All rights reserved

Closed system is a system that is not related to
external environment. While the open system is
a system-related and affected by the external
environment.
4. Natural systems and artificial systems
Natural system is a system that occurs through
natural processes, not through natural processes.
While the artificial system is a system that
designed by humans,
Data is the description of objects, events,
activities, and transactions that do not have a meaning
or not directly affect the value pemakai.Data can be
formatted, text, image, audio and video (Kadir, 2003).
Formatted data is data with a particular format. For
example, the data stating the date or hour,
ataumenyatakan currency values. The text is a series
of letters, numbers, and symbols in particular (Eg "+"
and "$") that the combination does not depend on
each item individually tesk Examples are newspapers.
Image (image) is the data in the form of images.
The image can be in the form of graphs, photographs,
x-rays, and other ataupungambar signature.
Audio is data in the form of sound. Music
instruments, voices or sounds of animals, splashing
water, heartbeats are some examples of audio data.
Video expressed sejumblah datan in the form of
moving images and bias-equipped with the sound.
Video can be used to capture an event or activity.
Information is data that has been processed so as
to reduce the confusion about the circumstances or an
event. While the data word itself is the fact that the
actual reality.
Information can also be defined as a result of
processing data in a form that is more useful and more
meaningful to the recipient a portrait of an events
(event) real (fact) that is used for decision making.
(Hartono, 1999). Within the scope of information
systems, information has characteristics as described
below: (Davis, Gordon B, 1989)
1. Right or wrong, this can relate to reality or not.
When the recipient of the information is wrong
to believe, the same result as correct.
2. New. Information may be completely new and
fresh for the recipient.
3. Additional. Information can renew or give a new
addition to the information already exists.
4. Corrective. Information data into a corrective on
one of the previous information.
5. Confirmation. Information can reinforce the
already existing information. This is still useful
because it enhances the perception of the
recipient for the correctness of this information
open. One real example is OPEN MOVIE
filmed Blender Institute.
1.1 Information Quality
The quality of the information (quality of
information) depends on three factors, namely
accuracy (accurate), timeliness (timeliness), and
suitability (relevance). (Hartono, 1999)
a. Accuracy
Information should be free from mistakes and not
biased or misleading. Accurate information can be
also be interpreted must clearly reflect the intent.
b. Punctuality
The information that came at the recipient should not
be too late. The information is already using will not
have value because information is the cornerstone of
decision making so that when information is delayed
then the decision becomes incompatible with the state
c. Conformity
Such information has benefits for the wearer.
Suitability for each person is different depending on
the way of view and treat information that has been
acquired.
It is known that the information is very important
for management in decision making. Information can
also be obtained from the system information
(information system) or also called Processing system
or information processing system or information-
generating system.
1.2 Information Systems
The information system can be defined as a system
within an organization that is a combination of
people, facilities, technology, media, procedures and
controls are shown to get the lines of communication
is important, process the transaction type certain
routine, giving a signal to management and the more
of the events of internal and external are important
and provide an information base for decision-making
astute (Hartono, 1999 GIS can present a real world
(real world) on the monitor as sheet maps can
represent the real world on paper. However, SIG has
the power more and flexibility of the sheet of paper.
map is a graphical representation of the real world,
objects are presented on a map called the element of
a map or map features (examples are rivers, parks,
gardens, roads, etc.). Since the map organize based on
those elements of the locations. SIG menyimp an all
elements of descriptive information as attributes in
the database. Then, SIG to form and store it in tables
(relational) thus, these attributes can be accessed
through the locations of the map elements and
instead, the elements of the map can also be accessed
melaluiatribut-attribute. (Prahasta Eddy 2005).
Geographic Information System Development Engineering Faculty of Manado State University
399
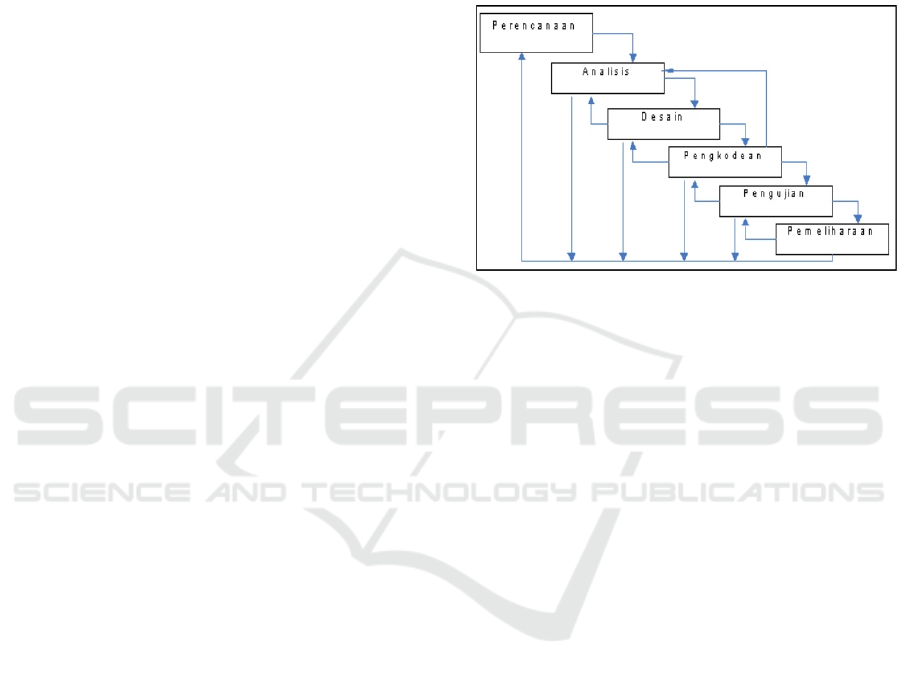
2 METHOD
System development method used is the Waterfall
method that consists of 6 phases:
a. planning
b. analysis of needs
c. Design (Design)
d. Coding (coding)
e. Testing (Testing)
f. Maintenance
In this development methodology only reached
the stage of testing (Testing) only.
2.1 Sequential Linear Systems
Development Method (Waterfall
model)
Method development system linear sequential or who
is often called the life cycle of a classic or waterfall
model (waterfall model) provides an approach to
system development systematic sequence, begins the
phase of system planning, analysis, design, code, test
and maintenance (Pressman, 2003 ). Figure 1 shows
the waterfall model.
1. Planning or engineering
In this phase of the identification system, the user
needs study and a feasibility study system both
technically and secarateknologi and scheduling
system development.
2. Software requirement analysis
In this phase the collection of identified needs and
is focused on systems that will be used include the
domain identification information, tinkah
behavior of the system, to work and interface
system. The need for the system is documented
and consulted again for the user.
3. Design
In this phase focused on the process data structure
design, system architecture, interface
representations and program algorithms.
4. Coding
Once the design process is completed, the results
should be d terjemahnak into the form of a
computer program which will then be amended
and produce a system that can d use.
5. Testing
Testing is done to find mistakes that allow
occurred in the coding process and to ensure that
input is restricted provide maximum results and in
accordance with future user needs.
6. Maintenance
Marked with the delivery of software to the user
to operate. In the operational period, the software
enables masi event of a fault or failure in
implementing its functions, the software is still in
need of the process (maintenance) from time to
time in line with developments in the research
object at first.
Figure 1: Waterfall Model.
2.2 Data collection technique
Data to be collected in this study consisted of two:
qualitative and quantitative data.
Qualitative data is data on the geographic
information system development process in the form
of criticism and suggestions from media experts,
students and lecturers.
Quantitative data is the main data is data geography,
dann Building rooms in the Faculty of engineering
.
3 RESULTS AND DISCUSSION
This study originated from the observation made in
the Faculty of Engineering Unima is directly in view
of the recognition process in the Faculty of Unima
techniques. Based on the observations that have been
done, researchers found recognition that is given to
the students of the first semester is lacking, especially
in the field of geographic information and other
information so that the impact on the slow adjustment
mahsiswa early half or could be in katakana new
students to the system and the order of geographic
faculty which is environment merekauntuk new gain
knowledge. From the results of this observation, the
lack of recognition means that can provide
information to the students of the first semester. Thus
the need for additional means of introduction which
utilize advanced technology to facilitate the provision
EIC 2018 - The 7th Engineering International Conference (EIC), Engineering International Conference on Education, Concept and
Application on Green Technology
400

of information to students. That is by making the
introduction program which contains more complete
information and is easy to use using Arc view and
Adobe Flash. However memgingat Arc view and
Adobe Flash in its use is quite complicated
researchers tried mebuatnya easy to use yet has more
information.
3.1 Stage Design
At this stage the design Storyboard made. Storyboard
an overall picture of the application that will be
created. Here is the storyboard that would serve as
guidelines in making this application
3.2 Stages Collection of materials
To this end the researchers to collect all the materials
that will be used in the making of this program.
Starting from the information and images as well as
software and hardware.
a. Information
To make this program the researchers collected
information about the geographical location,
information on uses of the room, the data and the
student data lecturer in the Faculty of engineering.
When finished creating storyboards, researchers
compiled information that will be used in the making
of the program.
b. Picture
To supply the pictures, taken from every corner of
the existing building within the scope of the Faculty
of techniques including pictures of the room that will
be used for modeling to be used in the program, and
in the edit mengunaka Arc View, Adobe Photoshop,
and Skechup Pro.
c. Software-Hardware
Software used in the process of making this
program has the following specifications:
- Arc View
- Adobe Flash Professional CS6
- Adobe Photoshop CS6
- Skechup Pro 2016
- Make Skechup 2016
Based on the above data, the hardware required to
make this program are:
- Processor: Intel® Core ™ i3
- RAM: 4.00 GB
- Hard disk: 1 TB
3.3 Stage Creation
Before the programs are made in advance to prepare
the material that will be used in the manufacturing
process such as information engineering faculty
program, taking pictures of the building, the room,
and the position of the building that has been edited
using ArcView, Skechup, Adobe Photoshop CS6.
After that the process be using the program Adobe
Flash Professional CS6. Here PrintScreen
manufacture geographic information system program
that has been created.
4 CONCLUSIONS
From the results of research and discussion above,
the conclusions obtained are as follows:
Geographic information system development
engineering faculty had a very nice benefit to make it
easier to get information that is within the scope of
the engineering faculty of the UNIMA. With this
program students and lecturers get more complete
information and help as a means that is easier to use
to get
Based on the quality of existing programs,
weaknesses and limitations of existing research, it can
be given some suggestions utilization and further
development of the program as follows:Can increase
program usage areas in geographic areas of UNIMA.
Giving more in-depth information in any outline in
the program.
Geographic Information System should be
developed further because in this program show only
a small area of Manado State University.
REFERENCES
Abdul Kadir, 2003, Concepts and Practical Guide
Database, Andi, Yogyakarta.
Abdul Kadir, 2003, Introduction to Information
Systems, Andi, Yogyakarta.
Adobe Flash CS3. Jakarta: PT.Elexmedia
Komputindo.
Aryawiguna1404205025.wordpress.com/2015/09/09
/sejarah-google-sketchup-
as well-acquainted with the name-and-function-tool-
google-sketchup-
Connolly, T, Begg, C. (2002). Database systems:
APracticalApproach toDesign,
for-beginners.
Geographic Information System Development Engineering Faculty of Manado State University
401

Gordon B. Davis, the basic framework manejemen
information systems, characteristics of structured
Hartono, Jogiyanto, 1999. Analysis and Design of
Information Systems: a structured approach to the
theory and practice of business applications,
Indonesia. Andi. Jakarta.
Information.
Jogiyanto Hartono, 2000. Information Systems,
Introduction to System and integrated elements.
Jogiyanto. HM 2005, "General Form System. Andi,
Yogyakarta.
Jogiyanto. HM 2005, "Information Cycle. Andi.
Yogyakarta.
Jogiyanto. HM 2005. Information Systems. Andi.
Yogyakarta.
McLeod Jr., R. 2005. Management Information
Systems Volume 1.
Nugroho, Bunafit and Mahar Fauji, 2011. Creative
Arts Animation with
Turban, Efraim et al. 2003. Introduction to
Information Technology, 2nd Edition. John Wiley
& Sons, Inc. New York. USA.
Turban, Efraim et al. 2005. Introduction to
Information Technology, 3rd Edition. John Wiley
& Sons, Inc. New York. USA.
EIC 2018 - The 7th Engineering International Conference (EIC), Engineering International Conference on Education, Concept and
Application on Green Technology
402
