
Electric Power Generation Optimization With Markowitz Model
Ticoh, J. D
1
, Laloan, C. F
2
1
Department of Electrical Engineering Education, Universitas Negeri Manado, Sulawesi Utara, Indonesia
2
Department of Economics Education, Universitas Negeri Manado, Sulawesi Utara, Indonesia
Keywords: Power Generation, Optimization, Efficient Frontier, Markowitz Model.
Abstract: Factors of economic growth, the growth of the population and the global warming issue require that electricity
providers must be able to provide electrical power energy with a high-reliability factor. The duration of
extinguishing and how often blackouts are a measure of the reliability of an electric power system.
Diversification of the types and sources of electrical energy as a way to ensure the availability of electrical
energy in the form of parallel work of power generation systems. The existence of a variety of constraints on
each generation system so that a special method is needed to be able to regulate the operation
variation/scheduling to provide electricity for consumers. This journal discusses the optimization method of
the portfolio of electric energy generation systems using the Markowitz model. This model provides an
optimum value for the variation of the power plant system at each time indicated by an efficient frontier curve.
Every optimum combination of plants that might be on the frontier efficient curve line.
1 INTRODUCTION
Diversification is the act of spreading investment into
several forms of investment projects and if it is
appropriate to choose the characteristics of each
project, the effects of the portfolio will reduce the
overall risk. ( Acemoglu,1997)
This portfolio is essentially a combination or
combination or set of assets / projects, both in the
form of real assets and financial assets owned by
companies / investors, formed to reduce risk.
Markowitz, 1952 and Bodie, 2009).
In the process of forming this portfolio must go
through an investment process consisting of a policy
determination process, investment analysis, portfolio
formation, portfolio performance evaluation, and
portfolio revision process.(Chandra, 2017)
At least there are two things that underlie this:
first if one is wrong in planning and decision making
will have severe and long consequences for the
company, considering the number of funds spent is
quite large and tied for a long time, and secondly if
there is wrong in estimating their needs, for example,
investment is too large (over investment) there will be
burdens which should not be necessary. Conversely,
if the investment is too small (under investment) the
company will lack production capacity. (Sovic, 2016;
Brook, 2016; Hult, 2017)
From the description above shows how
important the management process is to risk, its
relationship with how to avoid, prevent and reduce or
in other words the process of maximizing
opportunities and minimizing failure. For this reason,
it is very necessary to seek, build, implement realistic
best strategies, and allocate limited resources into the
most productive areas. This is a very challenging task
for executives of any company in any industry and
even more challenging for executives who manage
business portfolios.
Electricity generation nowadays presents a greater
number of challenges related to reliability,
sustainability and security of supply. The use of
renewable resources in power generation has been
adopted in most OECD (Organization for Economic
Cooperation and Development) countries as an
answer to the climate change problems originated by
the burning of fossil fuels in the traditional thermal
plants to supply the ongoing increase in electricity
demand. (Eusébio et al., 2015).
In terms of the economic model, the electricity
industry has evolved from a vertically integrated
state-owned monopoly company (not subjected to the
Ticoh, J. and Laloan, C.
Electric Power Generation Optimization with Markowitz Model.
DOI: 10.5220/0009009702730279
In Proceedings of the 7th Engineering International Conference on Education, Concept and Application on Green Technology (EIC 2018), pages 273-279
ISBN: 978-989-758-411-4
Copyright
c
2020 by SCITEPRESS – Science and Technology Publications, Lda. All rights reserved
273

normal rules of competition) to a liberalized market
where generators and consumers have the opportunity
to freely negotiate the purchase and sale of electricity.
Usually the liberalization of the electricity market
allows entry of independent power producers with
long term contracts and the creation of active
wholesale and retail markets came in a later stage.
Nowadays the actual economic situation affects all
the participants in the sector, consumers, producers
and “prosumers”, many hypotheses to decrease the
bill to pay for electricity are considered, such as
different energy suppliers, control load programs,
load forecasting, smart-grid, smart-metering and
smart-box.
In terms of the economic model, the electricity
industry has evolved from a vertically integrated
state-owned monopoly company (not subjected to the
normal rules of competition) to a liberalized market
where generators and consumers have the opportunity
to freely negotiate the purchase and sale of electricity.
The energy sector is in transition to a flexible and
sustainable energy system based on renewable
energy sources. This complex transition is affecting
multiple levels in the sociotechnical system. One
driver of the transition is climate change that
enforces the policy push from the macro level to
change the way energy is produced, delivered, and
used. As part of the energy system evolution, the
role of the end user in the energy sector is
undergoing profound changes, and consumers are
increasingly being empowered to participate
actively in the production and use of energy.
(mesaric et all, 2017: Kotilainen, 2018)
The small passive consumer evolves to an active
player, participating in the generation of electricity
and the provision of network services. In this context,
both aggregators and companies can bring their
customers, consumers, producers, consumers and
traders to market (Lampropoulos et al., 2010) (Stern,
1999)
With the new paradigm of the distributed generation
of electrical models allows the medium, small
consumers and producers to integrate the satisfaction
of the power system because they adopted opposed to
the traditional power system, composed by medium
and large power plants. (Markovis, 2013)
The optimization method of the portfolio of electric
energy generation systems using the Markowitz
model is the main objective in this research.
2 METHOD
This research is a descriptive research which
describes the determination of the optimal Portfolio
model with the Markowitz model chosen from the
many efficient portfolio alternatives that can provide
a certain level of return in accordance with the risk
dared to be borne by the manager, the optimal
combination is shown on Markowitz's efficient curve.
Figure 1 shows the efficient curve where P1 until P10
are possible portfolio combinations, Markowitz states
that efficient frontiers are all efficient portfolios that
may be from a combination of risk and return P2, P3,
P4, P5, P6. According to Markowitz (Xu et al, 2017),
the key why investors / companies only need to look
at some portfolios is located in the efficient set
theorem, which states that (Sharpe et al, 2005):
Manager will choose an optimal portfolio from a
number of portfolios that: 1) Offering maximum
expected return for various levels of risk and 2) Offer
minimum risk for various levels of expected return.
Figure 1: Markowitz efficiency curve
Concept of Expected Value is one method of how we
Figure 1: Markowitz efficiency curve
combine probability quantitatively with investment
opportunities, while the risk in an investment project
is shown by the size of the expected rate of return that
deviates from the actual rate of return where the
greater the deviation means the higher the level of
risk. Standard deviation (SD) as a measurement of the
variability of distribution based on this statistical
science. The optimal Portfolio model with the
Markowitz model chosen from the many efficient
portfolio alternatives that can provide a certain level
of return in accordance with the risk dared to be borne
EIC 2018 - The 7th Engineering International Conference (EIC), Engineering International Conference on Education, Concept and
Application on Green Technology
274

by the manager, the optimal combination is shown on
Markowitz's efficient curve (Halim, 1995; Jogiyanto,
2003).
! " #$ %
&
' ()#$
*
+,%
&
-
.
& /0
!
*
" #$ %
&
' ()#$
*
+,%
&
-
.
& /0
(1)
where ; ! = Deviation standard;!
*
=Varians;
(CF)xi= Cash flows obtained in the case of i;
EVCF=Expected value of cash flow; P(xi) = The
probability of the occurrence of cash flows in
conditions i and ; n =Frequency of cash flows
received.
According to Markowitz the expected return of a
project portfolio is a weighted average of expected
returns for each individual project (Gao, 2003) so that
the expected value of a project portfolio is;
( ) ( )
1
i
N
pp i
i
Er E XEr
=
==
å
(2)
With Xi expressed as;
1
&
"
23.456&.7859859846&.69:86;<=>8?9
Total Invsetment Fund in Portofolio
(3)
Where:
( )
p
Er
= Expected portfolio return from the
project; Xi = Proportion of funds invested in the project I;
( )
i
Er
= Returns expected from the project I;
N=Returns expected from the project i.
Whereas to calculate the standard deviation (standard
deviation) the Markowitz model portfolio consisting
of N projects includes multiple addition actions
shown in equation (2) to N projects.
11
NN
PP ijij
ij
SD X X
ss
==
==
åå
(4)
if there are three projects in the portfolio, then the
portfolio risk equation (2) will become;
33
11
PP ijij
ij
SD X X
ss
==
==
åå
22
11 1212 1313
22
2121 2 2 2323
22
3131 3232 3 3
[
]
XXXXX
XX X XX
XX XX X
sss
ss s
sss
=+++
++ +
++
(5)
with
ij i j ij
sssr
=
and portofolio varian
11
NN
P i j ij
ij
VXX
s
==
=
åå
where ; @
A
= Portfolio deviation; 1
&
B 1
>
= Proportion
of funds invested in i & j projects; @
&
B @
>
=Standard
deviation of projects i and j;
C
&
B C
>
= Coefficient of correlation between two
random variables; @
&>
= Return covariance between
two random variables i and j.
3 RESULTS AND DISCUSSION
Table 1 shows examples of Expected Monetary Value
(EMV), standard deviations and covariance for each
generation system or customer variation.
Nowadays there are various kinds of energy
sources that are trying to be used to ensure the
availability of electricity that tends to change, such as
gas, wind, coal, oil, biomass, sunlight and much
more. Each generation system has its own character,
starting from investment, the size of the energy
potential, risk to the environment, environmental
conditions that can interfere with normal operation,
operating costs, to the load variation. (Calvo, 2017).
To reach these goals they research and develop new
technologies which could better meet the needs of
their consumers and to adjust to changes in the energy
industry. The intense changes in worldwide energy
industry are the results of a number of factors, such as
the increase in energy demand, growing
industrialization processes, and resources limitations.
Many countries and energy providers are obligated to
reconstruct their power generation mix and to develop
new possibilities for producing energy. One reason is
that their existing power plants are often old, not very
energy-efficient and not very eco-friendly (e.g.
featuring high CO2 emissions). Moreover, present
energy utilities are heavily involved to develop CO2-
free or CO2-low technologies. The construction of
power portfolios is a process where energy utilities
have to consider a number of factors and goals,
including the following: minimizing the impact on the
environment, keeping the cost of generation as low as
possible and, from a power supplier’s point of view,
achieving the best profit for a given risk level.
(Madlener).
EMV of an outcome is a combination of
profitability and risk measure (with numerical
probability) that adjusts to the value. In other words
EMV is the result of multiplication between the
Electric Power Generation Optimization with Markowitz Model
275

probability of the outcome and the conditional value
received if the outcome occurs; Standard deviation is
a statistical value that is used to determine how the
data is distributed in the sample, and how close the
individual data points are to the mean or average
sample value; and Covariance is a statistical measure
of the relationship between two random variables.
(Moore, 1983).
Table 1 shows examples of Expected Monetary
Value, standard deviations and covariance for each
generation system or customer variation.
Based on Table 1, it can be seen that 3 (three) systems
of dissemination may be developed, namely the
optimal project portfolio selected "CDH", so that the
company will be faced with the problem of funding
the project / determining the capacity of the power to
be raised, ie how many parts / variations of money
will be place it in each plant in the "CDH" project
portfolio.
Using the Markowitz theory, the problem can be
solved by forming a portfolio distribution that
consists of variations in investment weights for each
project which will also provide an expected portfolio
return and standard portfolio deviation (a variety of
efficient set theorems. For the case of the "CDH"
project portfolio, A curve can be made attainable set
or feasible set or possible combination of "CDH"
portfolios as shown in Figure 24, which consists of
1000 portfolio combinations of the project "CDH"
with a fraction / weight of each particular project
(although basically this number of attainable sets can
not countless or more than 1000 variations)
Table 1: Expected Monetary Value Standard deviation and
Covariance, (Ticoh, 2012)
Power
Pant
EMV (US$)
SD
COV(%)
C
5.889.036
13.432.690,11
228
D
11.234.202
17.703.410,90
157
H
31.666.278
62.470.393,51
197
CDH
16.297.952,20
21.532.936,78
132
by using Matlab software optimizer (listening
program in Appendix 6). Calculation of each possible
portfolio combination (attainable set portfolio) in
Appendix 7 using equation (1) to (5) each portfolio
standard deviation and expected portfolio return can
be obtained
Figure 2: Curve combination of 1000 feasible sets of
project portfolio "CDH" by using the help of Optimizer
Matlab .
So that from this efficient frontier theorem (figure
1), a number of portfolios that meet both conditions
are expressed as efficient set or efficient frontier, in
which efficient portfolios are located, and according
to Markowitz the combination under the curve can be
ignored. Based on this, the portfolio is at the efficient
frontier for the "CDH" project portfolio.
Below is listening program with matlab to
produce 1000 combinations of 3 projects “CDH”.
%%%%%%%%%%%%%%%%%%%%%%
%%%%%%%%%%%%%%%%%%%%%%
%%%%%%%%%%
% Filename JanneD_Ticoh.M
% OPTIMALISASI PORTOFOLIO " ":
% Plotting an Efficient Frontier
%%%%%%%%%%%%%%%%%%%%%%
%%%%%%%%%%%%%%%%%%%%%%
%%%%%%%%%%
%
% Specify the expected returns, standard
deviations, and
% correlation matrix for a hypothetical 3-asset
portfolio.
%
returns = [5902995 11252120 31700830];
STDs = [13425504.28 17698112.37
62454711.32];
correlations = [ 1 0 0
0 1 0
EIC 2018 - The 7th Engineering International Conference (EIC), Engineering International Conference on Education, Concept and
Application on Green Technology
276
0 0 1 ];%
% Convert the standard deviations and
correlation
% matrix into a variance-covariance matrix.
% covariances = corr2cov(STDs ,
correlations);
%
% Compute and plot the efficient frontier for
% 100 portfolios along the frontier.
%
portopt(returns , covariances , 20)
%
% Randomly generate the asset weights for
1000
% portfolios starting from the MATLAB initial
state.
%
rand('state' , 0)
weights = rand(1000 , 3);
%
% Normalize the weights of each portfolio so
that the sum = 1.
%
total = sum(weights , 2);
total = total(:,ones(3,1));
weights = weights./total;
%
% Compute the expected return and risk of each
portfolio.
%
[portRisk , portReturn] = portstats(returns ,
covariances , weights);
%
% Now plot the returns and risks of each
portfolio
% on top of the existing efficient frontier for
comparison.
%
hold on
plot (portRisk , portReturn , '.r')
title('Mean-Variance Efficient Frontier and
Random Portfolios')
hold off
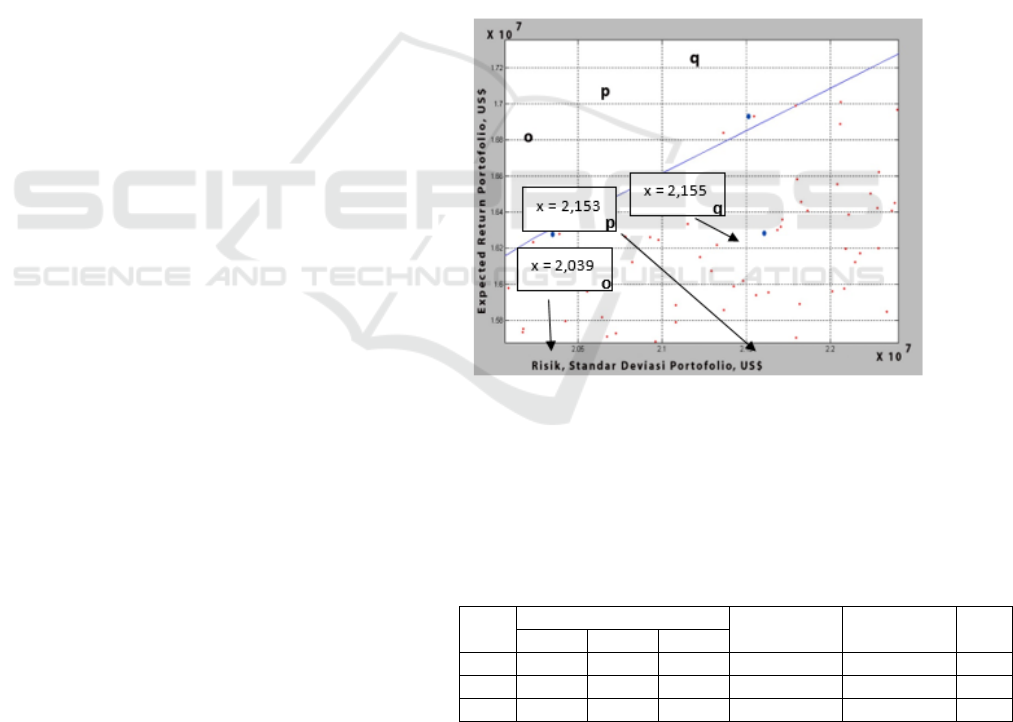
If the company has an investment policy to fund all
projects in the "CDH" portfolio, then the portfolio for
the company lies in the "p" point in Figure 3 clicked
from Figure 2. This "CDH" portfolio has the expected
value and a standard deviation of US $ 16,297,952.20
and US $ 21,532,936.78 .
According to the efficient frontier theorem, it is
inappropriate to choose a portfolio that is not at the
efficient frontier or in other words the portfolio is not
included in an efficient portfolio. This is clear
because when compared with the "CDH" portfolio
which is at the frontier efficient frontier around the
point "o" and "q" is more efficient than the portfolio
at the point “p”.
Figure 3: Location of the "CDH" project portfolio in the
sample of 1000 portfolio combinations in Figure 2. If the
company decides to fund the three projects in its overall
portfolio "CDH"
Table 2: Comparison of the "CDH" portfolio if the company
decides to fund the entire project and "CDH" portfolio that
is at the efficient frontier if the company wants to fund a
project with a certain weight
Porto
folio
Project weight
Portofolio Risk
Portofolio
Return
COV
(%)
C
D
H
“o”
0,118
0,6054
0,2766
20.390.176,19
16.277.380,26
125
“p”
0,28
0,4
0,32
21.532.936,78
16.297.952,20
132
“q”
0,0074
0,7129
0,2797
21.547.188,01
16.931.232,28
127
Based on this analysis, then to get an optimal
portfolio, the company must choose one of the
optimal portfolios from a number of portfolios that
Electric Power Generation Optimization with Markowitz Model
277
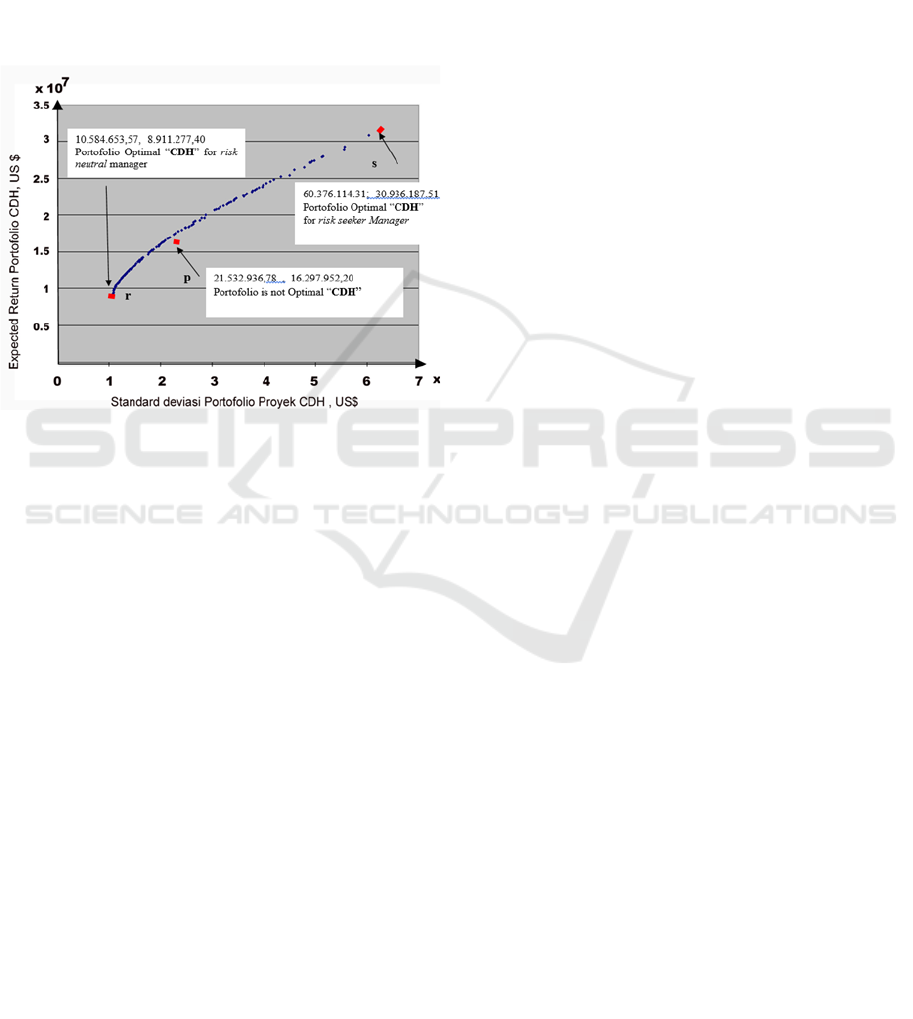
are in figure 4 efficient frontier. This is very
important for the company because if the company
has limited investment funds, then the company can
make the policy to invest funds with optimal variation
and can provide opportunities for parties from outside
the company to invest in each project in the "CDH"
portfolio. According to the efficient set theorem,
companies can choose the optimal portfolio "CDH"
that is located along the efficient frontier, depending
on how the company prefers risk.
Figure 4: Various optimal portfolios of "CDH" based on
investor preferences on the efficient frontier curve
4 CONCLUSIONS
The electricity industry has evolved from a
vertically integrated state-owned monopoly company
(not subjected to the normal rules of competition) to
a liberalized market where generators and consumers
have the opportunity to freely negotiate the purchase
and sale of electricity.
With the shift in the paradigm of electricity
supply, producers are faced with variations in the
choice of generation systems and character loads /
customers that are always dynamic.
Risks and Expected Economic returns are to be a
measure for producers to choose a combination /
portfolio of power plant systems to be operated.
By using the Markowitz efficient curve portfolio,
the optimal portfolio combination can be
determination. The optimal Portfolio model with the
Markowitz model chosen from the many efficient
portfolio alternatives that can provide a certain level
of return in accordance with the risk dared to be borne
by the manager.
Producers who dare to face risks will choose a
portfolio combination that is on the rightmost
efficient curve, and if you want to avoid risk the
producer will choose a portfolio combination that is
left most on the efficient curve
REFERENCES
Acemoglu, D., & Zilibotti, F. (1997). Was
Prometheus unbound by chance? Risk,
diversification, and growth. Journal of political
economy, 105(4), 709-751.
Bodie, Z. (2009). Investments. Tata McGraw-Hill
Educatio
Brook, M., 2016. Estimating and tendering for
construction work. Routledge.
Chandra, P. 2017. Investment analysis and portfolio
management. McGraw-Hill Education.
Calvo-Silvosa, A., Antelo, S.I. and Soares, I., 2017.
Energy planning and modern portfolio theory: A
review. Renewable and Sustainable Energy
Reviews, 77, pp.636-651.
Dhrymes, P.J., 2017. Portfolio Theory: Origins,
Markowitz and CAPM Based Selection. In
Portfolio Construction, Measurement, and
Efficiency (pp. 39-48). Springer, Cham.
Eusébio, E., de Sousa, J., & Neves, M. V. 2015, April.
Risk analysis and behavior of electricity portfolio
aggregator. In Doctoral Conference on
Computing, Electrical and Industrial Systems (pp.
365-373). Springer, Cham.
Hult, G.T.M., Morgeson, F.V., Morgan, N.A.,
Mithas, S. and Fornell, C., 2017. Do managers
know what their customers think and
why?. Journal of the Academy of Marketing
Science, 45(1), pp.37-54.
Kotilainen, K. and Saari, U.A., 2018. Policy
Influence on Consumers’ Evolution into
Prosumers—Empirical Findings from an
Exploratory Survey in
Europe. Sustainability, 10(1), p.186.
Lampropoulos, I., Vanalme, G. M., & Kling, W. L.
(2010, October). A methodology for modeling the
behavior of electricity prosumers within the smart
grid. In Innovative Smart Grid Technologies
Conference Europe (ISGT Europe), 2010 IEEE
PES (pp. 1-8). IEEE.
Madlener, R. and Glensk, B., Use of Modern
Portfolio Theory to Optimize the Power
Generation Mix at the Company Level: Impact of
Investments in New Renewable Energy
Technologies. In Energy Economy, Policies and
Supply Security: Surviving the Global Economic
Crisis,,. International Association for Energy
Economics.
Markowitz, H. 1952. Portfolio selection. The journal
of finance, 7(1), 77-91.
Mesarić, P., Đukec, D., & Krajcar, S. 2017. Exploring
the potential of energy consumers in smart grid
using focus group
methodology. Sustainability, 9(8), 1463.
EIC 2018 - The 7th Engineering International Conference (EIC), Engineering International Conference on Education, Concept and
Application on Green Technology
278

Sharpe, F. W., Alexander, J. G. dan Bailey, J. V.
2005. Investasi Jilid 1& Jilid 2. Edisi Ke-6.
Jakarta: PT Indeks Kelompok Gramedia.
Ticoh, J.D., 2010. Optimalisasi Portofolio Proyek
dengan Menggunakan Kurva Efisien Markowitz.
Ed Vokasi. Jurnal Pendidikan Teknologi dan
Kejuruan, 1(1), pp.36-57.
Slovic, P., 2016. The perception of risk. Routledge.
Xu, G., Markowitz, H., Wang, M. and Guerard, J.B.,
2017. Constructing Mean Variance Efficient
Frontiers Using Foreign Large Blend Mutual
Funds. In Portfolio Construction, Measurement,
and Efficiency (pp. 315-329). Springer, Cham.
Moore, P.G. and Moore, P.G., 1983. The business of
risk. Cambridge university press.
Electric Power Generation Optimization with Markowitz Model
279
