
Heart Disease Detection using Iridology with Principal Component
Analysis (PCA) and Backpropagation Neural Network
Leonardus Sandy Ade Putra
1
, R. Rizal Isnanto
2
, Aris Triwiyatno
3
and Vincentius Abdi Gunawan
4
1
Department of Informatics Engineering, STMIK Palangka Raya, Palangka Raya, Indonesia
2
Department of Computer Engineering, Diponegoro University, Semarang, Indonesia
3
Department of Electrical Engineering, Diponegoro University, Semarang, Indonesia
4
Department of Informatics Engineering, Palangka Raya University, Palangka Raya, Indonesia
Keywords: Iridology, Iris, Heart Disease, Principal Component Analysis and Backpropagation Neural Network.
Abstract: Heart is one of many vital organs on the human body which function is to pump blood throughout the body.
Based on the data from World Health Organization (WHO), impaired heart function is the number one
cause of death in the world. Early symptoms of heart disease commonly go unnoticed by the patients
themselves and are often neglected. According to some circles on society, heart condition checking is
assumed expensive, inconvenient, and takes a long time to do. A simpler and cheaper way to detect early
heart complication symptom is needed. The iridology method can be used as a solution to resolve the
problem above. Iridology is a method to determine abnormalities or complications that are happening on an
organ’s function by taking an image on iris as the main object of diagnosis. This research is done to make a
system using image processing, feature extraction using Principal Component Analysis (PCA) and
classification using Backpropagation Neural Network to recognize the condition of the heart’s function. The
researcher used 90 patient data with normal and abnormal heart condition. These data will be divided into
50 training data and 40 test data. Based on the test that has been done by using PCA score result variations
as many as 600, 500, 400, 300 and 200, percentages of recognition rate have been obtained. The percentages
in order are 92.5%, 90%, 85%, 75%, and 67.5%. The designed system can be used to detect early symptoms
of heart function problem by using the Iridology method with the highest recognition rate of 92.5% using
the PCA score of 600.
1 INTRODUCTION
Heart is an internal organ which function is really
important for the human’s body. The heart is very
vulnerable to have a failure on their function on
distributing blood to the whole body. According to
World Health Organization (WHO), heart
complication or Cardiovascular disease (CVD) is the
number one cause of death in the world. CVD takes
17.7 million lives each year, 31% of all global
deaths (World Health Organization, 2017). From the
10 deadliest diseases in Indonesia, the CVD disease
stands on the first rank for the cause of death (Tv,
2015). Coronary heart sufferers in Indonesia reaches
7.6 million people per year (Kematian, Jantung, &
Tinggi, 2018). The main factors that trigger heart
disease are tobacco usage, unhealthy diet program,
lack of exercise, and alcohol consumption. To some
people, heart condition checking is assumed as
something expensive, complicated, and needs a lot
of time. Therefore, a more convenient and cheaper
way to detect early symptoms of heart complication
is needed.
Iridology is a method to identify abnormalities or
disturbances which are happening on the organs of
the body by making use of colours, structures,
patterns, and fibers which can be seen on the iris
(Samant & Agarwal, 2017). Iridology has shown a
great result regarding the potential of Iridology
method on analyzing human organs (Ernst, 1999;
Samant & Agarwal, 2017; Sitorus, Purnomo, &
Wibawa, 2016; Wibawa & Purnomo, 2006). There
were some studies that made use of the iridology
method as a way to detect abnormalities on human
organs. The observation was done by Ignaz Von
Peczely on the iris of an owl. In the iris of the owl,
there are dark spots which previously did not exist.
After the owl was cured, the dark spots are gone
Putra, L., Isnanto, R., Triwiyatno, A. and Gunawan, V.
Heart Disease Detection using Iridology with Principal Component Analysis (PCA) and Backpropagation Neural Network.
DOI: 10.5220/0009009402570264
In Proceedings of the 7th Engineering International Conference on Education, Concept and Application on Green Technology (EIC 2018), pages 257-264
ISBN: 978-989-758-411-4
Copyright
c
2020 by SCITEPRESS – Science and Technology Publications, Lda. All rights reserved
257
(Frank, Ferreira, & Pellow, 2013). A study by Nils
Lilijequist was done on a patient with lymph
disorder. After the patient did some treatment, the
patient was observed once more and many changes
were found on the iris of the patient (Frank et al.,
2013). Research was also done to diabetic
retinopathy patients which used GLCM feature
extraction and Support Vector Machine (SVM)
classification method, producing the highest success
rate of 88% (Labhade, Jyoti Dnyaneshwar, L. K.
Chouthmol, 2016). Research on diabetic patients
using statistic method and 2D-DWT feature as
feature extraction and Random Forest (RF) as
classification produced a success rate of 89,66%
(Samant & Agarwal, 2017). Research on heart
disease patients using PCA and SVM produced a
success rate of 80%. (Permatasari, Novianty, &
Purboyo, 2017). Detection of diabetes on pancreas
using GLCM and Back propagation Neural Network
produced a success rate of 81,35% (Adelina, Sigit,
Harsono, & Rochmad, 2017). Research was also
done to detect stomach disorder using PCA and
Back propagation Neural Network, resulting to a
success rate of 87,5% from 40 iris images. (Dewi,
Novianty, & Purboyo, 2017).
This research is done to make a system which
can identify any heart function problems based on
the structure of the picture by utilizing image
processing, feature extraction using Principal
Component Analysis (PCA), and Classification
using the Backpropagation Neural Network.
2 RESEARCH METHOD
2.1 Iridology
Iridology is a method to recognize an organ’s
condition and the body’s system through
characteristics or signs that appear on the iris
(Aisyah & Dewi, 2016) and as an alternative
medical check up to detect disease or problem on a
specific organ through colour observation
(Permatasari et al., 2017). Usually, Iridology is also
known as iris diagnosis which on the medical world
states that each part of the body can be represented
by an area contained in the iris (Adelina et al.,
2017).
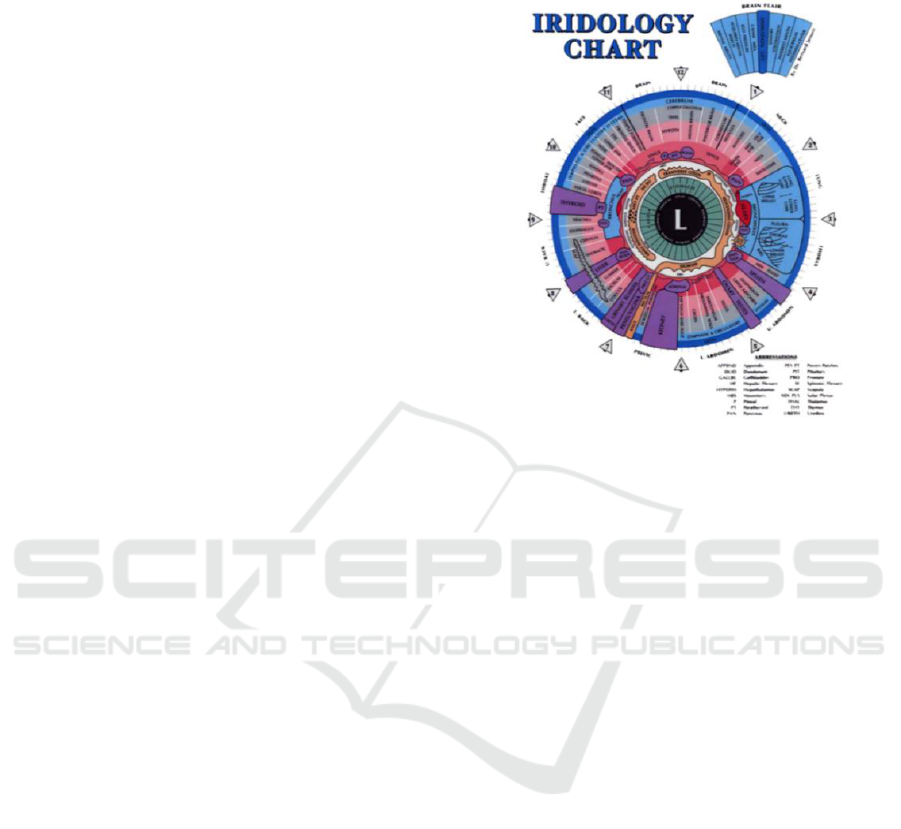
Iridology diagram documents the left and right
eye which reflects the systems and organs’ condition
based on the iris zone which was developed by Dr.
Bernard Jensen. Based on Dr. Bernard Jensen’s
chart, the heart is only on the left iris. The heart’s
position on the left iris is shown on zone 02.10 –
03.10 and can be seen on Figure 1 (“Left Eye Iris
Iridology Chart _ Iridology Chart,” n.d.).
Figure 1: Left iris ridology chart.
2.2 Image Processing
Image processing is done to separate the iris from
the pupil and sclera and then normalize the iris to the
standard dimension which can be adjusted with the
iris chart. This process needs extraction feature and
classification mechanism to conclude the correct
diagnosis. To create a process for detecting the
center of the iris and the center of the pupil, colour
images will be changed into grey images which are
segmented and transformed to the polar coordinates
(Nusantara, Herlambang, Isnanto, & Z, 2015).
2.3 Principal Component Analysis
Principal Component Analysis (PCA) (Nasseri,
Shirazi, & Sadeghigol, 2011) states mathematically
as an orthogonal linear transformation that changes
data to new coordinates system, which means that
PCA exchanges theoretically as an optimal linier
sceme. An image which is shown in a form of linier
projection in line with the eigen vector which
corresponds to the order of the eigen images from
the biggest to the smallest on covarian matrix. Each
eigen vector has one eigen point. Reduction decides
whether the eigen vector will be seen by choosing
from the biggest to the smallest. The characteristic
of data which is reduced has a small Eigen (Bishop,
2013; Duda, Hart, & Stork, 2012; Iridology, 2016;
Smith, 2002).
EIC 2018 - The 7th Engineering International Conference (EIC), Engineering International Conference on Education, Concept and
Application on Green Technology
258
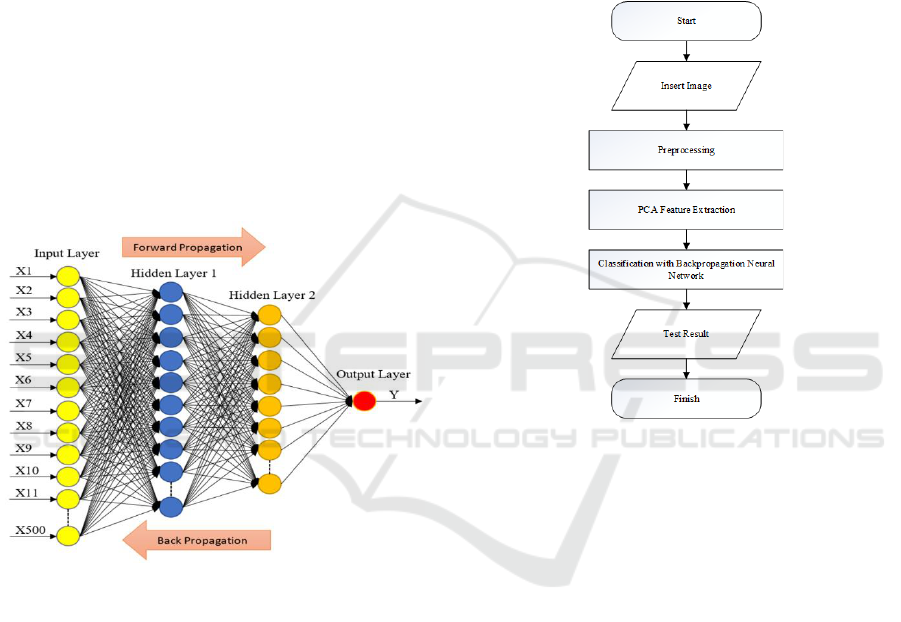
2.4 Backpropagation Neural Network
Backropagation Neural Network is one of the many
artificial representations of the human’s brain that
always tries to simulate the learning process of the
human brain (Rochmad, 2006). This algorithm does
two steps of calculation, the sophisticated
calculation can calculate the mistakes between the
actual output to target and back propagation to
spread the mistakes in order to fix the synaptic
weight on every neuron, this consists of many
layers (multiplayer network) (Aisyah & Dewi,
2016), (Saputra, Tulus, Zarlis, Sembiring, &
Hartama, 2017) can be seen on Figure 2:
1. Input layer (1 piece), consists of 1 X input
unit.
2. Hidden layer (at least 1 piece), consists of 1
hidden Y unit.
3. Output layer (1 piece), consists of 1to M
output unit.
Figure 2: Backpropagation neural network architecture.
3 RESULT AND DISCUSSION
This research used various PCA scores to identify
the effects on the heart problem recognition stage by
using iris image. The stages of this research can be
seen on Figure 3. The first step is to take a picture of
the left iris, this 1280 x 800 pixel sized picture will
go into the preprocessing process. The preprocessing
process is done to fix the quality of the image and to
seperate the part of the image which is necessary
from the part that is not. After the preprocessing
process, feature extraction will be done to the image
by using PCA. Feature extraction is needed to
simplify a data by maintaining important data
values. Feature extraction with PCA is done with
PCA score variations as many as 600, 500, 400, 300,
and 200.
The result of PCA feature extraction will be
classified using Backpropagation Neural Network in
accordance with the PCA score variation on each
images. This classification is done to group every
pixel on an image so that it can be interprated as a
specific property. The classification of the result is
in a form of information regarding the condition of
normal and abnormal heart condition.
Figure 3: Diagram of flow detection of heart problems.
3.1 Data Collection
This research used 90 datas of the left iris. The datas
are divided into two parts, 50 data as training data
and 40 data as test data.
3.2 Preprocessing
Preprocessing is needed to fix the quality of the
image and to seperate the part of the image which is
necessary from the part that is not. In preprocessing,
the image will go through a few stages before going
through the feature extraction process. The first
process on preprocessing is converting RGB type
image to grayscale type image. Afterwards, the
localization process, a process to determine the
needed location or part of the image, will be done.
The next process is the normalization process.
This process is done to change the shape of the
image from polar shape to square shape with the size
of 81 x 31 pixels. The quality of the image will be
fixed on the contrast enhancement process by using
Heart Disease Detection using Iridology with Principal Component Analysis (PCA) and Backpropagation Neural Network
259
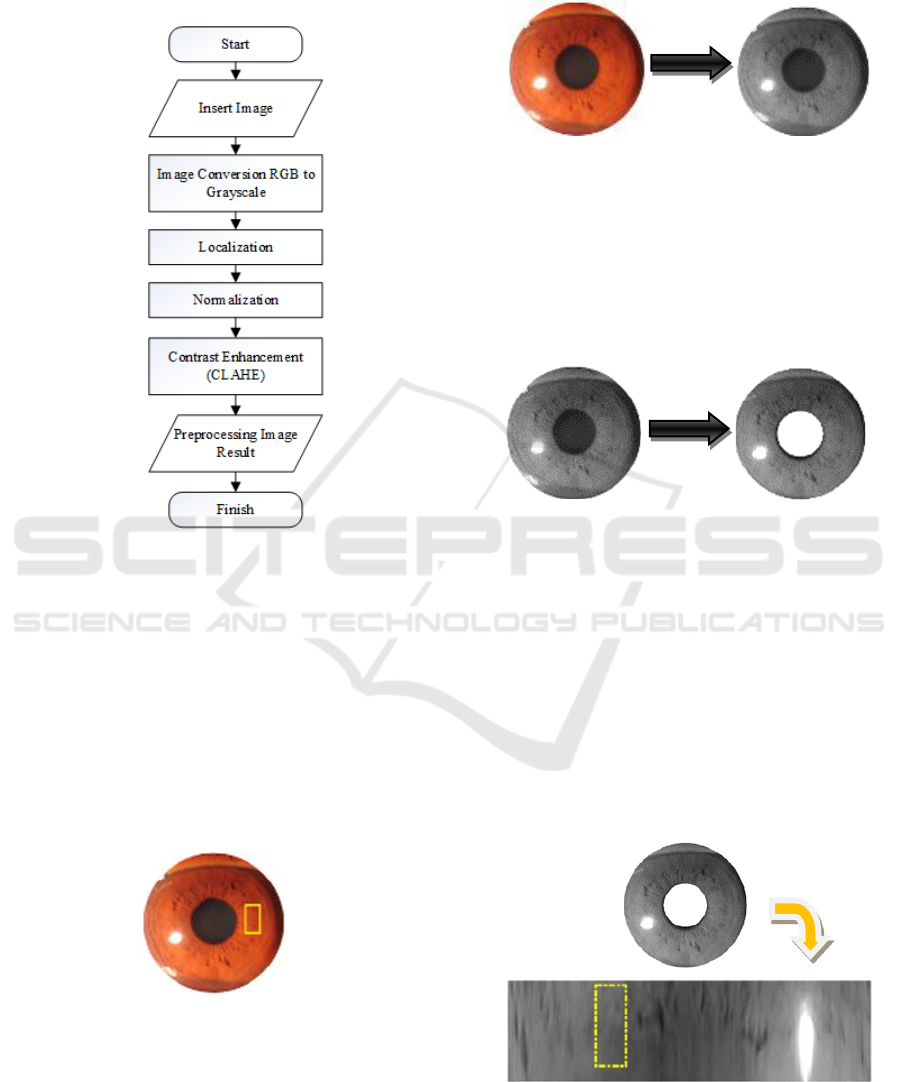
CLAHE. After the images went through every
preprocessing stages, the images are ready for
feature extraction. Figure 4 shows the flowchart of
each preprocessing stages.
Figure 4: Preprocessing stage.
3.2.1 Region of Interest (ROI)
In recognizing iris, ROI is known as a region filled
with complete information of an iris (Li, Li, & Ma,
2012). This process is done to find a part that can be
examined by separating the part (Adelina et al.,
2017). ROI is used as the iridology map (Prayitno,
Wibawa, & Purnomo, 2017), where the heart’s
location is on the left iris with the direction at 02.10
– 03.10 and can be seen on Figure 5. The lines show
ROI in the heart.
Figure 5: ROI from heart organs.
3.2.2 Image Conversion RGB to Grayscale
The first image is a RGB image, which is why a
conversion from the RGB image to grayscale image
is needed to be able to get processed on the next
step. The yellow line indicates the heart’s part on the
iris. The result of the image coversion is displayed
on Figure 6.
Figure 6: Conversion RGB to Grayscale.
3.2.3 Localization
On this step, the function of localization is to
seperate the iris from the eye image. This is done so
that the iris can be processed on the next step,
Normalization. The result of localization can be seen
on Figure 7.
Figure 7: Result of localization.
3.2.4 Normalization
Normalization is a process that changes the shape of
iris, from the polar shape to a square shape. The
square shape will make the area of the iris to the
same size. Which is why some images from the iris
with different sizes will have the same size and also
have the same characteristics with the same location
(Adelina et al., 2017). The center of the pupil is
considered as the reference point and vector radial
that passes through the iris area, which is illustrated
on Figure 8 (Jogi & Sharma, 2014).
Figure 8: Result of normalization.
EIC 2018 - The 7th Engineering International Conference (EIC), Engineering International Conference on Education, Concept and
Application on Green Technology
260
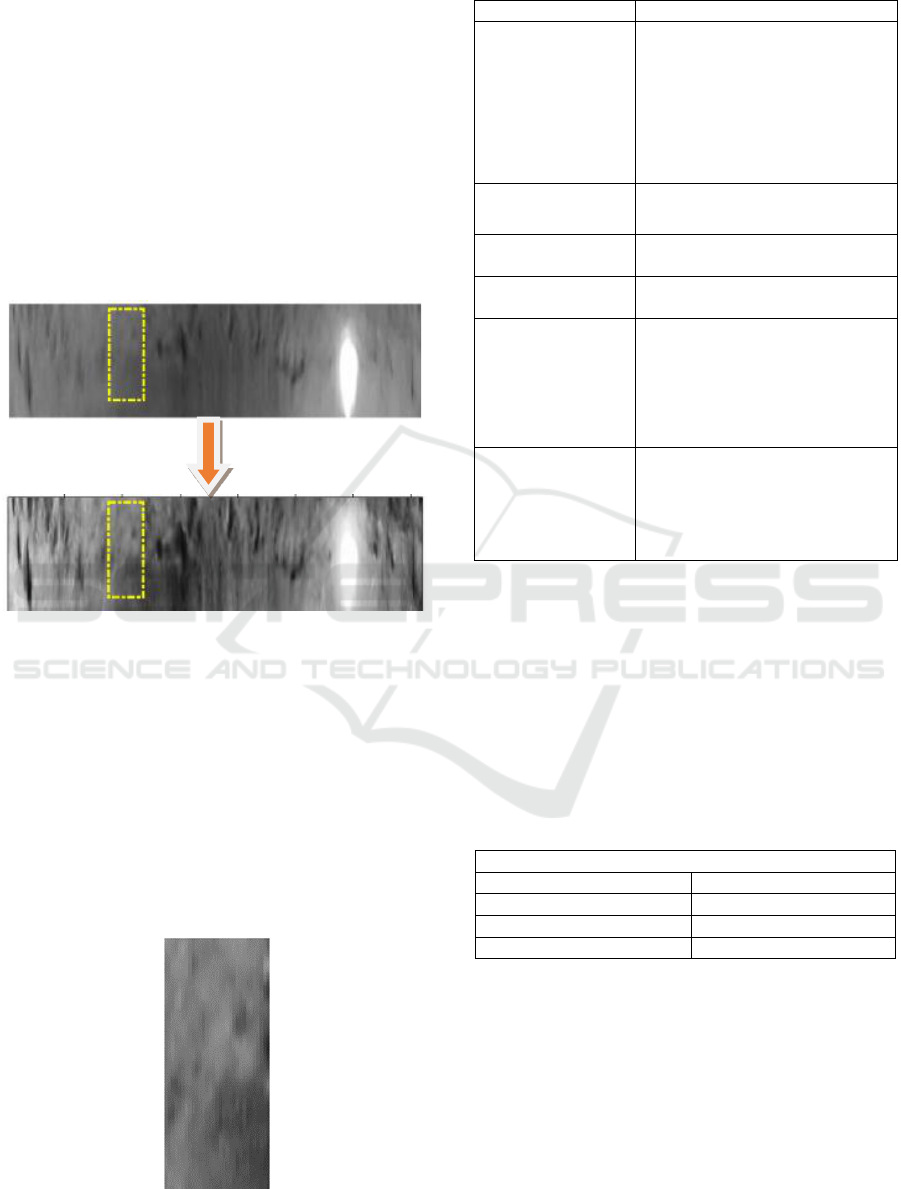
3.2.5 Contrast Enhancement
To improve the contrast of the iris image, the
histogram equalization step is needed. In the
histogram of a normalized iris, the gray level is
concentrated on the center of the gray level from 0
to 255. Contrast Limited Adaptive Histogram
(CLAHE) is used as contrast and threshold
equalization to make the next progress easier (Jogi
& Sharma, 2014). CLAHE is needed to resolve low
contrast and different lightning problems. CLAHE
can decrease or get rid of the noises that are on the
image. The result of the Histogram Equalization
using CLAHE can be seen on Figure 9.
Figure 9: Histogram equalization result using CLAHE.
3.3 Principal Component Analysis
To decrease the dimension of the database, the
function of PCA is to mantain the characteristics of
the dataset, (Liu & Wechsler, 2000) which are made
of high variations. Figure 10 shows an image of the
preprocessing result with the size of 81 x 31 pixel
which PCA value is ready to be found. Steps on how
to apply PCA can be seen on Table 1. Tables must
appear inside the designated margins or they may
span the two columns.
Figure 10: The image of the preprocessing result.
Table 1: Steps for Implementing PCA.
Steps
Explanation
Taking input
pictures (X)
Image of the preprocessing result
(81 x 31) is transposed to matrix
with each image changed to 1 x
2511.
50 data are available so the size
of the combined matrix will be
(50 x 2511).
Counting Mean 𝑿
̅
Counting the average matrix (X)
on each column.
Counting zero
mean (Z)
Zero mean = (X) - (𝑿
̅
)
Counting
covariance (C)
C = 𝒁
𝑻
∗ 𝒁
Counting eigen
vectors and eigen
value
[ v , d ] = eig (C)
eig = (Z*v)
The size of eigen value is 1 x
2511 and the size of eigen vector
is 50 x 2511.
PCA
Eigen value has been sorted
from the biggest to the smallest
and then the eigen vector will be
searched according to the score
order of the eigen value.
3.4 Principal Component Analysis
Backpropagation neural networks is used to find the
best result from the classification process. Data
image is divided into 2, for training and test. 50 data
which contain 25 normal data and 25 abnormal data
will be used as training data. This research used 2
hidden layers. The parameter which was set for this
research is on Table 2.
Table 2: Backpropagation neural network.
Parameters
Number of neurons
[10 15]
Maximum Epoch
1000
Targets
1e-6
Learning rate
0.0001
3.5 Data Testing
On the testing step, images will be classified and
produce information about the heart’s condition.
Condition in which the classifcation result is under 1
is considered abnormal or has a heart problem, while
the classification result which is above 1 is
considered normal or does not have any heart
problem. The test which was done with many score
variations can be seen on Figure 11.
Heart Disease Detection using Iridology with Principal Component Analysis (PCA) and Backpropagation Neural Network
261
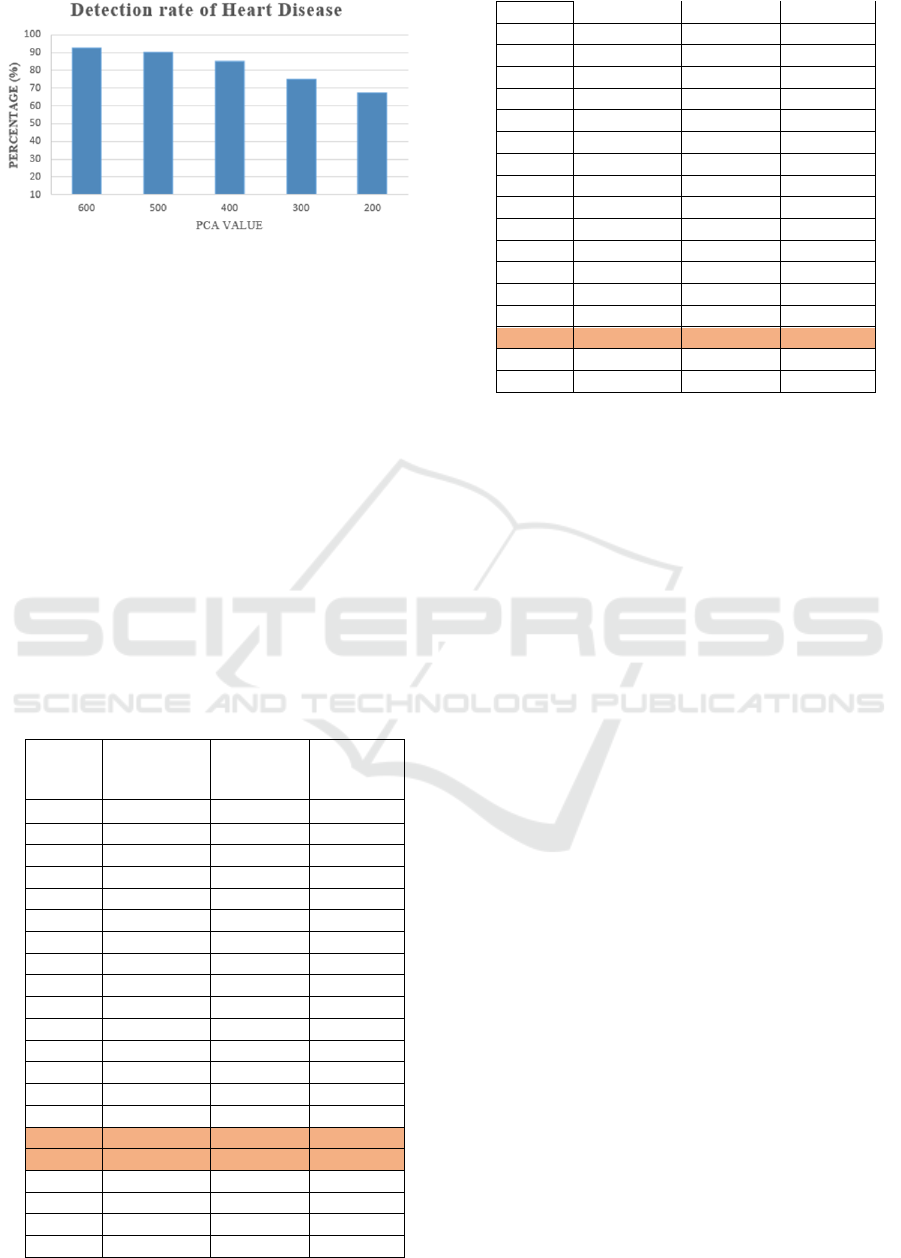
Figure 11: Detection rate of heart disease.
The usage of PCA score variations as many as
600, 500, 400, 300, and 200 is involved in this
research. The PCA score is the most important score
from the feature extraction of the original image and
as less value. The less PCA value has already
represented a valuable information from the original
image. The diagnosis level of the condition of the
heart in order are 92.5%, 90%, 85%, 75%, and
67.5%. It can be seen that the PCA score variation
affects the heart condition diagnosis system success
rate. The more PCA score that is used, the higher the
chance of success.
As an example to find out the result of the test on
this system, researcher will show the result of the
classification by using Backpropagation Neural
Network on the test system using the PCA score of
600 which can be seen on Table 3.
Table 3: Test result with the PCA score of 600.
Sample
Test Value
Expected
Test
Output
Result
1.JPG
0.403148
Abnormal
Abnormal
2.JPG
0.129456
Abnormal
Abnormal
3.JPG
0.083802
Abnormal
Abnormal
4.JPG
0.058263
Abnormal
Abnormal
5.JPG
0.66082
Abnormal
Abnormal
6.JPG
0.44757
Abnormal
Abnormal
7.JPG
0.662363
Abnormal
Abnormal
8.JPG
0.707559
Abnormal
Abnormal
9.JPG
0.837575
Abnormal
Abnormal
10.JPG
0.899931
Abnormal
Abnormal
11.JPG
0.0090691
Abnormal
Abnormal
12.JPG
0.816724
Abnormal
Abnormal
14.JPG
0.491388
Abnormal
Abnormal
15.JPG
0.656056
Abnormal
Abnormal
16.JPG
0.409854
Abnormal
Abnormal
17.JPG
2.03304
Abnormal
Normal
18.JPG
0.953222
Abnormal
Normal
19.JPG
0.513437
Abnormal
Abnormal
20.JPG
0.523197
Abnormal
Abnormal
21.JPG
4.45045
Normal
Normal
22.JPG
1.62642
Normal
Normal
23.JPG
3.49232
Normal
Normal
24.JPG
1.88061
Normal
Normal
25.JPG
3.22679
Normal
Normal
26.JPG
1.46215
Normal
Normal
27.JPG
3.53182
Normal
Normal
28.JPG
1.02171
Normal
Normal
29.JPG
1.51179
Normal
Normal
30.JPG
1.21271
Normal
Normal
31.JPG
1.20584
Normal
Normal
32.JPG
3.37536
Normal
Normal
33.JPG
1.08617
Normal
Normal
34.JPG
1.86534
Normal
Normal
35.JPG
1.48094
Normal
Normal
36.JPG
1.31759
Normal
Normal
37.JPG
1.13088
Normal
Normal
38.JPG
0.1638
Normal
Abnormal
39.JPG
1.52222
Normal
Normal
40.JPG
1.21769
Normal
Normal
From the results above shows that the main
component analysis method as feature extraction and
backpropagation neural network as classification has
better results than the method used by (Permatasari
et al., 2017) in diagnosing heart conditions through
iris.
4 CONCLUSIONS
Based on the test result of PCA score variation, it
can be seen that the score of PCA has affected the
recognition rate of early heart problem symptoms.
The more the score of PCA is, the higher the
successful rate is and it is inversely propotional with
the usage of less score.
By using image processing, feature extraction by
using PCA, and classification by using
Backpropagation Neural Network, the designed
system could work well. Tests on a few PCA score
variations as many as 600, 500, 400, 300, dan 200
has been tested on 40 test data and produced a
succesful rate of 92.5%, 90%, 85%, 75%, dan
67.5%.
Therefore the designed system can recognize
early heart function problem using the Iridology
method with 92.5% as the highest rate of success by
using the PCA score of 600.
REFERENCES
Adelina, D. C., Sigit, R., Harsono, T., & Rochmad, M.
(2017). Identification Of Diabetes In Pancreatic
Organs Using Iridology, International Electronics
Symposium on Knowledge Creation and Intelligent
Computing, Indonesia: IES-KCIC, pp 14–119.
EIC 2018 - The 7th Engineering International Conference (EIC), Engineering International Conference on Education, Concept and
Application on Green Technology
262

Aisyah, M., & Dewi, K. (2016). Stomach Disorder
Detection Through the Iris Image Using
Backpropagation Neural, (Icic), pp 1–6.
Bishop, C. M. (2013). Pattern Recognition and Machine
Learning. Journal of Chemical Information and
Modeling, Vol. 53, 049901
Dewi, A. K., Novianty, A., & Purboyo, T. W. (2017).
Stomach disorder detection through the Iris Image
using Backpropagation Neural Network. 2016
International Conference on Informatics and
Computing, ICIC 2016, Indonesia: Icic, pp 192–197.
Duda, R., Hart, P., & Stork, D. (2012). Patterns
Classification. John Wiley & Sons,.
Ernst, E. (1999). Iridology : A Systematic Review,
US National Library of Medicine National Institutes of
Health Search database, Vol 6(1), pp 7–9.
Frank, L., Ferreira, J. T., & Pellow, J. (2013). The validity
and reliability of iridology in the diagnosis of previous
acute appendicitis as evi- denced by appendectomy.
The South African Optometrist, Vol 72(3),pp 127–132.
Jogi, S. P. S. P., & Sharma, B. B. B. B. (2014).
Methodology of iris image analysis for clinical
diagnosis. 2014 International Conference on Medical
Imaging, m-Health and Emerging Communication
Systems, India: MedCom, pp 235–240.
Kematian, A., Jantung, P., & Tinggi, M. (2018). Angka
Kematian Penderita Jantung Masih Tinggi.
Labhade, Jyoti Dnyaneshwar, L. K. Chouthmol, S. D.
(2016). Diabetic Retinopathy Detection Using Soft
Computing Techniques. International Conference on
Automatic Control and Dynamic Optimization
Techniques (ICACDOT), pp 175–178.
Left Eye Iris Iridology Chart _ Iridology Chart. (n.d.).
Li, Y., Li, W., & Ma, Y. (2012). Accurate iris location
based on region of interest. Proceedings - 2012
International Conference on Biomedical Engineering
and Biotechnology, ICBEB 2012, pp 704–707.
Liu, C., & Wechsler, H. (2000). Evolutionary pursuit and
its application to face recognition. IEEE Transactions
on Pattern Analysis and Machine Intelligence, Vol
22(6), pp 570–582.
Nasseri, L., Shirazi, A. A. B., & Sadeghigol, N. (2011).
Tsallis entropy, PCA and neural network in novel
algorithm of iris classification. Proceedings of the 2011
World Congress on Information and Communication
Technologies, WICT 2011, pp 385–390.
Nusantara, R. G. A., Herlambang, P., Isnanto, R. R., & Z,
A. A. (2015). Application of Liver Disease Detection
Using Iridology with Back-Propagation Neural
Network, pp 123–127.
Permatasari, L. I., Novianty, A., & Purboyo, T. W. (2017).
Heart disorder detection based on computerized
iridology using support vector machine. ICCEREC
2016 - International Conference on Control,
Electronics, Renewable Energy, and Communications
2016, Conference Proceedings, pp 157–161.
Prayitno, A., Wibawa, A. D., & Purnomo, M. H. (2017).
Early detection study of Kidney Organ Complication
caused by Diabetes Mellitus using iris image color
constancy. Proceedings of 2016 International
Conference on Information and Communication
Technology and Systems, ICTS 2016, pp 146–149.
Rochmad, M. dkk. (2006). Osteoporosis Symptoms
Detection Through the Iris Using Image Clustering.
EEPIS, (0852-2863).
Samant, P., & Agarwal, R. (2017). Diagnosis of Diabetes
Using Computer Methods: Soft Computing Methods
for Diabetes Detection Using Iris, Vol 200(2), pp 57–
62.
Saputra, W., Tulus, T., Zarlis, M., Sembiring, R. W., &
Hartama, D. (2017). Analysis Resilient Algorithm on
Artificial Neural Network Backpropagation. Journal
of Physics: Conference Series, Vol 930(1).
Sitorus, M. A. R., Purnomo, M. H., & Wibawa, A. D.
(2016). Iris image analysis of patient Chronic Renal
Failure (CRF) using watershed algorithm. Proceedings
- 2015 4th International Conference on
Instrumentation, Communications, Information
Technology and Biomedical Engineering, ICICI-BME
2015, (October 2016), pp 54–58.
https://doi.org/10.1109/ICICI-BME.2015.7401334
Smith, L. I. (2002). A tutorial on Principal Components
Analysis Introduction. Statistics, pp 51- 52.
Tv, C. N. N. (2015). Home Nasional Internasional
Ekonomi Olahraga Teknologi Hiburan Gaya Hidup.
Wibawa, A. D., & Purnomo, M. H. (2006). Early detection
on the condition of Pancreas organ as the cause of
diabetes mellitus by real time iris image processing.
IEEE Asia-Pacific Conference on Circuits and
Systems, Proceedings, APCCAS, pp 1008–1010.
World Health Organization. (2017). Cardiovascular
Disease: World Heart Day 2017. Who.
Heart Disease Detection using Iridology with Principal Component Analysis (PCA) and Backpropagation Neural Network
263
