
Rooftop Photovoltaic System for Microgrid Design in State
Polytechnic of Ujung Pandang
Ashar AR
1,2
, Yusri Syam Akil
2
and Yusran
2
1
Politeknik Negeri Ujung Pandang
2
Hasanuddin University
Keywords: Microgrid;PV panel; green campus; State Polytechnic of Ujung Pandang
Abstract: Renewable energy sources are promised alternative energy to reduce using thermal power generation which
emitted emission gas. Solar energy is a good alternative choice for power generation in tropical country
such as Indonesia because of the geographical condition and a good duration time of sunlight every year.
The implementation of solar energy for campus electrical installation as a microgrid system to bring out the
idea of “green campus” is proposed in this paper. This microgrid system is design based on the potential of
solar energy sources and the load characteristics at the electrical engineering department building campus 2
State Polytechnic of Ujung Pandang in South Sulawesi, Indonesia. Maximum consumed energy per day in
this building during weekdays is 380 kWh. Therefore, PV panels power capacity is 108 kWp and the
number of installed PV for this system is 360 PV panels with battery capacity 10000 Ah. Based on the area
of the rooftop, needed space for installing the PV panel is 54% of the total wide area.
1 INTRODUCTION
Nowadays, looking for friendly resources of energy
becomes a big issues in all countries. The drawback
of conventional fossil fuel energy that emitted
hazardous emission gas alert people to care the
negative affect to human being and environment.
Therefore, the sources of conventional energy are
limited and some countries such Indonesia have
moved to the renewable energy sources. The big
challenge of using the renewable energy is the low
efficiency, reliability and its high initial cost.
Photovoltaic (PV) energy is one of the important
sources of renewable energy. In the recent decade,
PV has been a competitive energy source. The
efficiency of PV modules has been increased
significantly and now it is reaching 40% by the use
of new technologies (Tahri et al., 2018). Power
quality is also improved (Yusran et al., 2013).This
made the PV system become an essential system in
worldwide electrical power production.
Electrification ratio of Indonesia on December
2017 is around 95.35%, it is better than the
government target of 92.75% and electric ratio for
south Sulawesi is 99.12%. However, majority of the
power generation are thermal power plants.
Therefore, to reduce the dependency to fossil
sources, the government has set the target 23% from
the total used energy from renewable energy till
2025. Based on Electricity Supply Business Plan
(RUPTL) from PLN as utility company from
Indonesia, the target of solar power is 1047 MWp
and the realisation of solar power generation till
2018 is 94.42 MWp (ESDM, 2018). Therefore, there
are still a big challenge to fulfil the target of the
solar power generation. Campus as an educational
institution and research has a chance to build a solar
power generation in a microgrid system and there
are still small number of campus in Indonesia
provide electrical energy from renewable energy
sources. In campus, space is limited, so placement of
PV panels is usually only possible on the rooftops.
Various parameters have to be considered when
installing solar panel depend on the shape of
buildings’ roofs and regarding the received solar
irradiance. Some of the more important considered
parameters in solar potential estimation are
geographic location, surface topography and
shadowing effects from surrounding (Yuan et al.,
2016). PV power output has a strong correlation
with ambient temperature and irradiation of the
240
AR, A., Akil, Y. and Yusran, .
Rooftop Photovoltaic System for Microgrid Design in State Polytechnic of Ujung Pandang.
DOI: 10.5220/0009009202400245
In Proceedings of the 7th Engineering International Conference on Education, Concept and Application on Green Technology (EIC 2018), pages 240-245
ISBN: 978-989-758-411-4
Copyright
c
2020 by SCITEPRESS – Science and Technology Publications, Lda. All rights reserved
sunlight so the intermittency of PV power supply
can threaten microgrid integrity (Ho et al., 2013).
Studies on microgridsare generally classified into
two groups: system design and operation planning.
System design involves the selection and sizing of
the distributed energy resources, minimum
investment cost and environmental issues. The
optimal design is very important to maintain the
reliability of the system. Selection and sizing is
related with load characteristic, operation and
maintenance cost and weather conditions (Hirsch et
al., 2018). The optimal sizing is between peak load
satisfaction and minimalized investment cost.
Microgrid operation planning includes the
management of a microgrid (Sahoo et al., 2015).
Considering the role of campus as an education
and research institution, campus can be a role model
to apply renewable energy sources in microgrid
system for its electricity demand. So, the purpose of
this research is as preliminary study for microgrid
installation on the rooftop electrical department
buildings. Number of PV panels, sizing of battery
and used area for PV panel placement on the
buildings’ roof are considered in this study.
The rest of this paper is organized as: location and
solar potential in section 2 followed by investigating
the campus load characteristic in section 3. Section 4
presents the result and discussion then conclusion
are drawn in section 5.
2 METHODOLOGY
2.1 Location And Potential
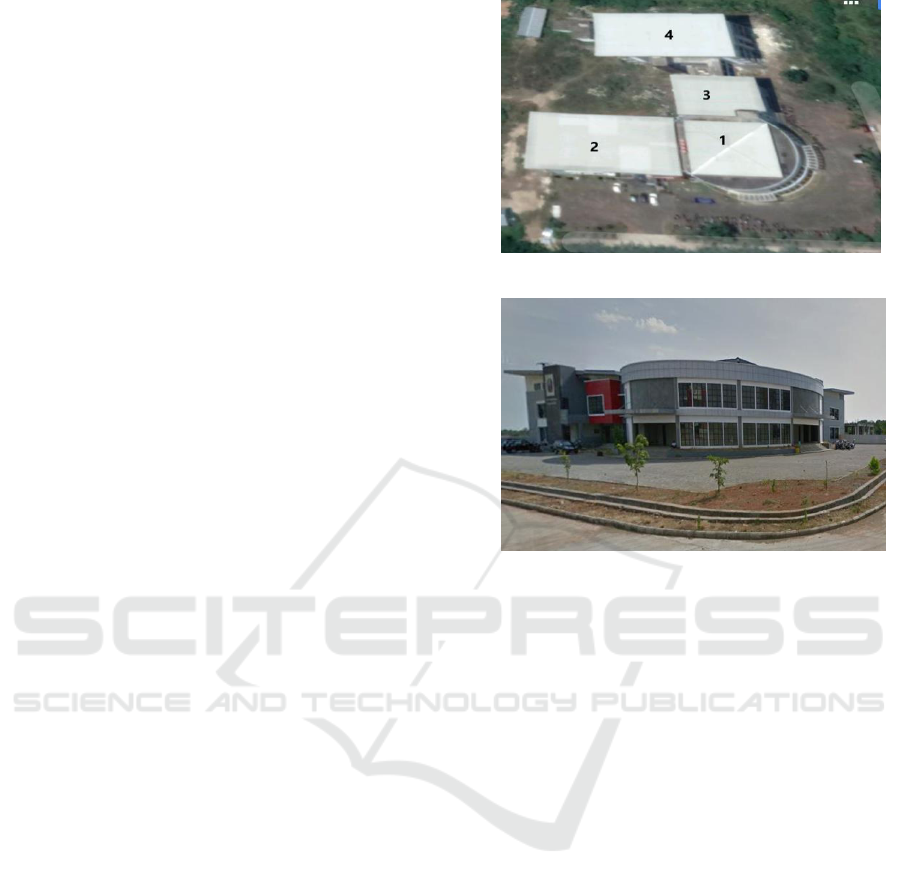
Buildings of Electrical Engineering Department,
Campus 2 of state Polytechnic of Ujung Pandang are
located in Moncongloe, Maros Regency, South
Sulawesi. The buildings location is at 5°08’40.9”S,
119°31’24.3”E. There are 4 main buildings in
Electrical Engineering Department; 1). Theatre
Building 2). Laboratory Building 3). Administration
Building and 4). Classroom Building. Those are
figured out in figure 2. The shape models of these
buildings are a little bit different. Theatre buildings
is half round. It is clearly shown in number 1 of
Figure 1. The roof shape is combination of concrete
deck roof and hipped roof. The roof shape of
building number 2,3 and 4 are shed model. From the
left side, theatre and laboratory buildings can be
shown in Figure 2. Those buildings are potential for
PV panel placement.
Figure 1: Buildings of Electrical Engineering Dept.
Figure 2: Electrical department building from left
side.
Photovoltaic energy is the transformation of
sunlight into electrical energy through PV array
panel which is depend on irradiance and
temperature. The production of this energy
fluctuates in nonlinear characteristic because of
intermittency condition and the depending on the
amount of radiation striking the surface of the PV
array and temperature of the location. Based on the
location, meteorological data can be obtained. Daily
radiation and temperature data are provided by
NASA Surface Meterology and Solar Energy
Database for monthly average values over 22 year
period. Those data are global irradiation and ambient
temperature for a year. From Figure 3, the highest
global irradiation is in September. The average
irradiation is around 5.87 kWh/m
2
/day. Basically, on
July till October is the higher irradiation during the
dry season in this area. The lower global irradiance
is in December and January because of cloudy and
rainy season in this area.
Temperature in this location is high enough. The
data are shown in Figure 4. The average temperature
is 26.38 °C. Basically, temperature influences the
behavior of solar PV because increased temperature
will increase the current of PV and the effect is the
decreasing of the maximum harvesting power from
the panel (Hedi et al., 2017). However, global
Rooftop Photovoltaic System for Microgrid Design in State Polytechnic of Ujung Pandang
241
irradiation and temperature in this location is
potential for solar photovoltaic system installation.
Figure 3: Average daily radiation.
Figure 4: Average daily temperature.
2.2 Campus Load Characteristic
Electrical Engineering Department in campus 2 is
new buildings. Majority of teaching activity is still
in campus 1 of Tamalanrea but some of laboratories
are located in campus 2. Therefore the consumed
energy is not yet really significant. The kind of loads
in these buildings are lighting lamps, electric
machines, water pumps, power electronics devices,
computers and laboratory devices. Most of big
energy comsumption is from laboratory equipments
such as electric machines. Normally, daily operation
is from 8 to 16 o’clock during weekdays (Monday to
Friday). On the weekend, the electrical load is only
lightings in the hall and parking area. Peak hour of
energy consumption is around 10 to 12 0’clock
every weekdays
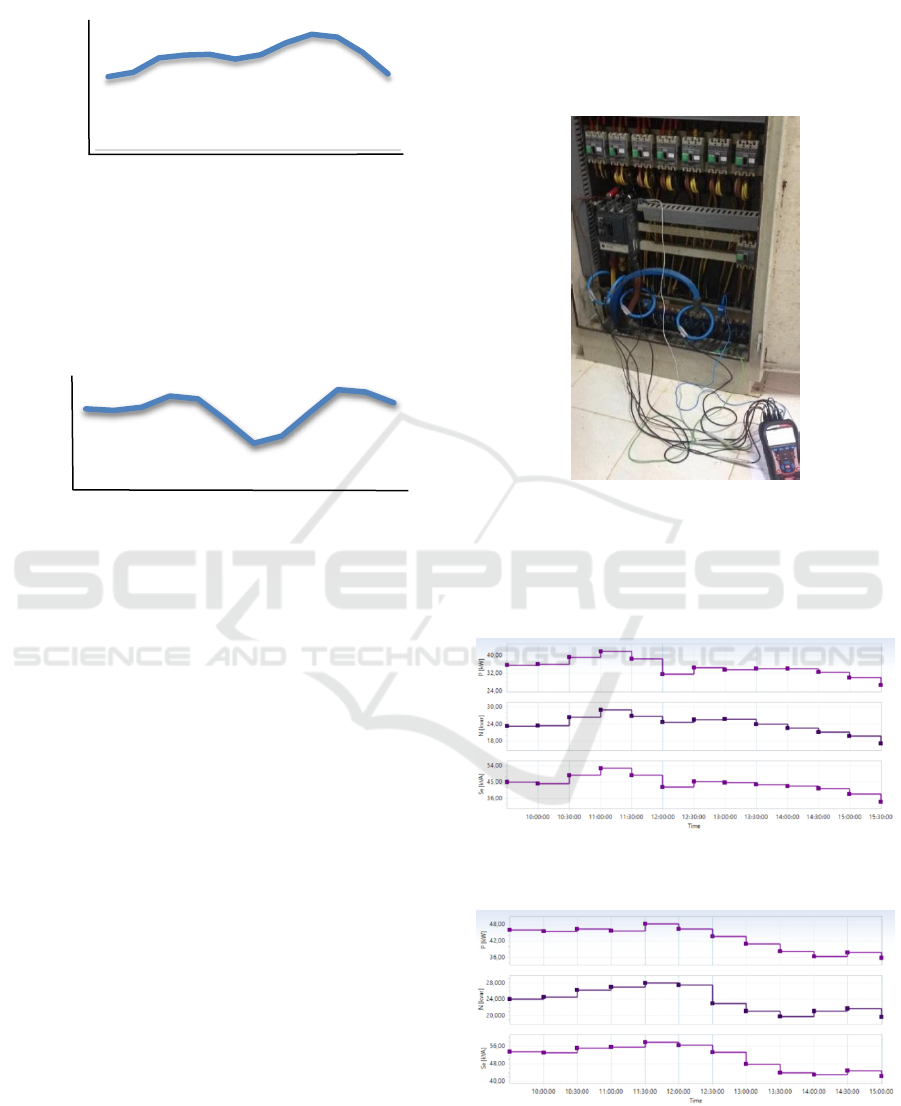
Daily load of the buildings is measured and
recorded with power quality meter METREL for 5
days from monday to friday during working hours.
Range of data is every 30 minutes. Combined power
(active, reactive and apparent power) are measured
to define the load characteristic of these building.
The instalation is in three phase R, S and T to supply
load in electrical department buildings.
Measurement device installation is took place in the
distribution panel of the buildings as shown in
Figure 5.
Figure 5: Installation of combined power measurement.
Following figures from Figure 6, Figure 7, Figure 8,
Figure 9, and Figure 10 are measured data from 12
to 16 March 2018 or Monday to Friday during
working hours.
Figure 6: Consumed power on Monday 12 March 2018.
Figure 7: Consumed power on Tuesday 13 March 2018.
0
1
2
3
4
5
6
7
8
January
February
March
April
May
June
July
August
September
October
November
December
Radiation (kWh/m2/day)
Months
25
25,5
26
26,5
27
January
February
March
April
May
June
July
August
September
October
November
December
temperature (°C)
Months
EIC 2018 - The 7th Engineering International Conference (EIC), Engineering International Conference on Education, Concept and
Application on Green Technology
242
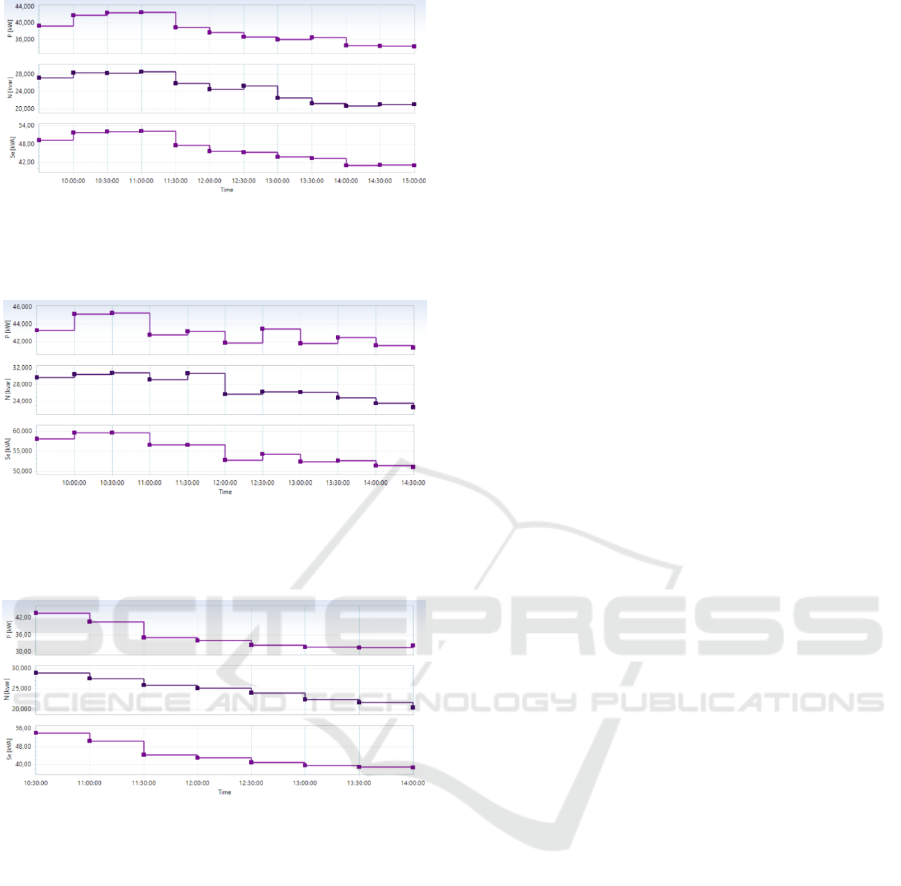
Figure 8: Consumed power on Wednesday 14 March
2018.
Figure 9: Consumed power on Thursday 15 March
2018.
Figure 10: Consumed power on Friday 16 March 2018.
From Figure 6 to 10, it is shown the condition of
consumed power in the buildings. Peak hour on
Monday is from 10.30 to 12 o’clock in which
maximum active power 41.77 kW, maximum
reactive power 29.01 kVAR and maximum apparent
power 52.69 kVA. Peak hour on Tuesday is from
11.30 to 12.30 o’clock, where maximum active,
reactive and apparent power are 47.50 kW, 27.99
kVAR and 57.92 kVA. On Wednesday, the peak
hour is from 10 to 11.30 o’clock and the maximum
active, reactive and apparent power are 42.66 kW,
28.62 kVAR and 52.26 kVA. Peak hour on
Thursday is around 10 to 11 o’clock and the
maximum active, reactive and apparent power are
45.31 kW, 30.86 kVAR and 59.65 kVA. For the last
day of research data, the peak hour is from 10 to
11.30 o’clock with maximum active power 43.64
kW, maximum reactive power 28.96 kVAR and
maximum apparent power 54.09 kVA.
The varied data and peak hour depend on the
teaching activities in campus. Most laboratory and
workshop activities are in the morning from 8 to 14
o’clock. Most of operated laboratory devices for
obtained data is from 10 to 12 o’clock. Therefore,
that is the reason why the peak hour is around that
time.
Consumed reactive power for electrical
applience is high. It is indicated that many inductive
load operated in campus. Electric machines, air
conditioner, water pumps are example of applied
inductive loads. For solar system design, only active
power will be considered because reactive power is
produced from electrical moving sources such
generator.
3 RESULT AND DISCUSSION
PV panels placement planning is on the rooftop
of Theater and Laboratory building because of better
position to the sun. The roof shape of the theater
building is combination of concrete deck roof and
hipped roof with estimated area 528 m
2
meanwhile
laboratory building roof shape is shed roof in west
facing with 10 degree inclination and wide area is
782 m
2
. So total estimated area of the two building is
1310 m
2
. However the PV panel placement area
must be smaller than the wide area of both buildings.
To design this system, choosing the PV panel
and inverter is very important. In this research,
polycrystalline 300 W
P
will be chosen because of
availability on the market and certified PV panel and
the capacity of chosen inverter is 20 kW. Table 1
provides the specification of applied PV panel.
Rooftop Photovoltaic System for Microgrid Design in State Polytechnic of Ujung Pandang
243

Table 1: PV panel specification.
Parameter
Value
Pmax
300 W
Imp
8.28 A
Vmp
36.2 V
Isc
9.27 A
Voc
43.4 V
NOTC
45±2 °C
Max. System Voltage
1000 V
Max. Series Fuse
16 A
Weight
20.65 kg
Dimension
1956 x 992 x 40mm
To calculate the power capacity of PV system
daily load supply, it can be determined using this
equation [10]:
(1)
Where:
: Power capacity of PV [kWp]
:Total energy demand per day [kWh]
: Sun hour per day [h]
: System efficiency [%]
Maximum active power consumed from all data is
47.5 kW on Tuesday and it is shown on Figure 8.
This data becomes the base to determine the load
demand. So the total consumed energy for 8 hours
(working hours) is 380 kWh. Normally, total sun
hour in Indonesia especially in South Sulawesi is 4
hour/day, the condition when the PV panel working
in maximum point to harvesting energy from sun. If
the system efficiency is 88%, then the power
capacity of PV will be:
From the table 1, capacity of the PV panel is 300
Wp so number of PV panel need is:
To determine the number of series connection of
PV panel, formula (2) can be applied:
(2)
Where;
: number of series connestion [unit]
: inverter voltage [volt]
: maximum power voltage [volt]
Maximum power voltage (V
MP
) from the PV
specification is 36.2 V and the maximum input
voltage of inverter (V
INV
) is 800 V. So number of
series connection is:
Therefore, there are 16 panel arrays in parallel
which consist of 23 PV panels in series connection.
This system is design to operate in connected
grid mode and islanded mode. Islanded mode will
handle the system in the weekend or vacation to
supply only lighting loads in campus because of
lower consumed energy. Then if the system is
islanded mode, it means need batteries. Total
capacity of battery is usually signed with C, which
means measurement of how much energy can be
store in the battery. The battery capacity is
calculated using formula as follows (Giriantari,
2016):
(3)
Where;
C
bat
: Battery Capacity [Ah
c10
]
E
C
: Total Energy Demand per day [VAh]
Usys: DC System Voltage [V
DC
]
H
aut
: Autonomous day [day]
DoD : Depth of Discharge [%]
DoD means how much energy that the battery
delivered to the load. If the battery is 100% fully
charged, it indicates the DoD of the battery is 0%
and if the battery is 100% empty, DoD is 100%. In
order to provide a longer cycle life of battery, DoD
cannot be 100%. Therefore, the DoD of this battery
storage system is 80%. DC system voltage is usually
24 V or 48 V and this system is design for 48 V. the
autonomous day is set for 1 day, so battery capacity
will be:
The battery capacity can be designed to be
10000 Ah, therefore the energy storage capacity is
480 kVAh.
EIC 2018 - The 7th Engineering International Conference (EIC), Engineering International Conference on Education, Concept and
Application on Green Technology
244

Applied inverter for this design is bidirectional
inverter because of the connection of on grid and off
grid mode.
For the placement of PV panel on the roof,
needed space on the roof is 700 m
2
or around 54% of
the total wide of the rooftop buildings. This is
available because of the total rooftop area is 1310
m
2
. However, the weight of the installed panels
should be seriously considered because of the
structural elements of building. For this design, the
weight of the panels will be 7.434 kg, so it is heavy
enough for the existing buildings which are not
constructed for PV panels on the roof.
To keep the continuity of electric supply if the
PLN utility supply is collapse or the energy from the
solar panel and battery are not enough to supply the
loads, diesel generator is set to back up the system.
Output of the diesel generator for these buildings is
80 kVA. Specification of the diesel generator can be
seen in Table 2.
Table 2: Diesel generator specification
Parameter
Value
Model
HT - 80
Output
80 KVA
Voltage
220/380 V
Current
122 Amp
Pf/Phase
0.8 / 3
Speed
1500 Rpm
Frequency
50 Hz
Rating Cont.
80%
4 CONCLUSIONS
Rooftop photovoltaic system for microgrid design
is presented in this paper and the results can be
concluded as this system for daily energy demand
380 kWh of 3 phase connected system in Electrical
Engineering Department, Campus 2, State
Polytechnic of Ujung Pandang needs 360 PV panels
to supply the loads. The power capacity of the PV
panels is 108 kWp with installed battery capacity
10.000 Ah. Roof space needs 54% of the total
existing roofs for installed PV panels. To keep the
continuity power supply, diesel generator with 80
kVA capacity is set to back up the system.
Campus as a role model to develop microgrid
system to response the government policy of applied
renewable energy sources as an environmentally
impact consideration to reduce the thermal power
generation. Microgrid system design in campus is
very important as the basic knowledge to develop
microgrid system.
To explore the potential of renewable energy in
this location, future research will be developed a
microgrid system with considering wind turbine as a
hybrid power generation. Wind speed in this
location is considerable to harvest electrical energy.
REFERENCES
C. T. T. Ho, R. Yan, T. K. Saha, S. E. Goodwin. (2013)
“Design Microgrid for a Distribution Network: A Case
Study of the University of Queensland”, IEEE, pp 1-5
ESDM.
https://www.esdm.go.id/assets/media/content/content-
rasio-elektrifikasi.pdf
Giriantari, IAD., Irawati., R. (2016) “Smart Microgrid
System with Hybrid System Supply: Udayana
University Pilot Project Design”, ICSGTEIS, Vol 16
(3), pp 8-12
Hedi,T. Mourad., E. (2017) “MPPT controllers for PV
array panel connected to grid”, 18th International
Conference on Science and Techniques of Automatic
Control and Computer Engineering-STA 2017,
Monasir, Tunisia, pp 505-510
Hirsch, A., Parag, Y., Guerrero, J. (2018) “Microgrids: A
Review of Technologies, Key Drivers, and
Outstanding Issues”, Renewable and Sustainable
Energy Review, Vol 90, pp 402 – 411
Sahoo, A. K., Abhitharan, K. P., Kalaivani, A., Karthik, T.
J. (2015) “Feasibility Study of Microgrid Installation
in an Educational Institution with Grid Uncertainty”,
4th International Conference on Eco-friendly
Computing and Communication System, ICECCS
Tahri, F., Tahri, A., Oozeki., T. (2018) “Performance
evaluation of grid-connected photovoltaic systems
based on two photovoltaic module technologies under
tropical climate conditions”, Energy Conversion and
Management, Vol 165, pp 244 – 252.
Yuan, J., Farnham, C., Emura, K. S. Lu. (2016) “A
Method to Estimate the Potential of Rooftop
Photovoltaic Power Generation for a Region”, Urban
Climate, Vol 17, pp 1 – 19
Yusran, Ashari M, and Soeprijanto A. (2013)
“Optimization Scheme of Distributed Generation
Installation Growth Considering Network Power
Quality”, Journal of Theoretical and Applied
Information (JATIT), Vol 53(1), pp 30-39, ISSN
1992-8645, E-ISSN : 2339-1553
Rooftop Photovoltaic System for Microgrid Design in State Polytechnic of Ujung Pandang
245
