
Overload Effect on National Road Overlay Planning in North
Kalimantan
Adi Lazuardi Perdana
1
, Ari Setyawan
2
, Budi Yulianto
2
1
Student of Master Program of Civil Engineering, University of Sebelas Maret, Surakarta, Indonesia.
2
Lecturer of Department of Civil Engineering, University of Sebelas Maret, Surakarta, Indonesia.
Keywords: Overloading, Service life,Pd T-05-2005-B, SDPJL, Kenpave
Abstract: The issue in the community that causes damage to the road was by trucks carrying fresh fruit bunches (FFB)
of oil palm. The purpose of this study is to know the effect of overload on the service life, knowing the overlay
thickness, thickness due to overloading and determining the effective thickness from the method used. This
study was conducted by surveying overloaded FFB transport trucks. The location of research was on Tanjung
Selor Road Section, limited to Bulungan in Sta 16 + 000 to Sta 18 + 000. Analysis of overload data uses
overload scenarios, while for planning the overlay layer thickness uses deflection method Pd T-05-2005-B
and Bending Pavement Design Software (SDPJL). Both methods are mechanically evaluated by the Kanpave
program to determine the efficient overlay thickness. The results showed that the ESAL
overload
>
ESAL
Standard
.Based on the analysis of the high load on service life since the road was opened, there was a
reduction in service life, an overlay thickness of 4.86cm with Pd T-05-2005-B method, 4cm with SDPJL
method. Based on analysis of overload on planning occurred an increase in each scenario where d
Overload
>
d
Planning
. The mechanical results from the Kenpave program showed that the load repetition that was close to
the design load was the Pd T-05-2005-B method of 130,606,838.49 ESA, thus planning the Overlay thickness
with the Pd T-05-2005-B method was more efficient than the SDPJL method.
1 INTRODUCTION
In Indonesia the movement of goods and services is
dominated by the modes of land transportation by
using Trucking vehicles because it can be done door-
to-door with the right time, exact quantity, quality,
and exact receiver. In addition, transportation costs
are the largest cost component in the logistics cost
structure. No less than 60% of the total cost is the cost
of transportation.
With the increasing economic growth of a region
and the lack of supervision, some transport services
are willing to carry relatively large quantities of
goods to reduce transportation costs in a travel
process at once, making it more cost effective to
transport. This will have a negative impact on road
pavement conditions due to overloading repeated
loads.
Repeated loads caused by heavy vehicles will
have an impact on the degradation of the highway
bending structure of the road which further leads to a
decrease in the hardness of the pavement support
because it always receives a voltage greater than the
standard load.
If this condition continues to occur it will result in
the occurrence of road damage early because the load
received has been reached before the age of the
planned road at the time of the initial design.
Any vehicle of a certain weight that crosses a
road, will contribute to the destruction of the road.
Overload contributes a power of 4 (four) to the road
destructive factor or Vehicle damage factor (VDF).
The increase in damaged power of road is much
greater than the percentage of the burden that is
violated.
So this cause is considered to be the most
responsible cause for road damage. This condition
may be made possible by changes in vehicle
dimensions and weight across the road when
compared to the dimensions and weight of the vehicle
used in the planning.
Therefore, this study conducts more cargo survey
of fresh palm fruit bunch (FFB) vehicles using more
load scenarios, calculates Equivalent Single Axle
Load (ESAL), Age of service. In this research, the
Lazuardi Perdana, A., Setyawan, A. and Yulianto, B.
Overload Effect on National Road Overlay Planning In North Kalimantan.
DOI: 10.5220/0009008802170222
In Proceedings of the 7th Engineering International Conference on Education, Concept and Application on Green Technology (EIC 2018), pages 217-222
ISBN: 978-989-758-411-4
Copyright
c
2020 by SCITEPRESS – Science and Technology Publications, Lda. All rights reserved
217

overlay thickness planning process with PdT-05-
2005-B deflection method, the software design
method of flexible pavement stretching (SDPJL),
comparing the thickness value of overlay due to more
load with thickness of planning, knowing the
thickness of the effective overlay layer with using
kenpave mechanical program of both methods used.
2 METHOD
The research location is in National road North
Kalimantan, Bulungan precisely located on the
boundary roads Bulungan Tanjung Selor Sta 16 + 000
to Sta 18 + 000.
Obtained primary data by surveying the damage
to roads and fruit bunches weighing and measuring
tailgate loading and unloading at the site of FFB.
Secondary data is supportive data obtained from
the Planning and Monitoring Unit of the National
Road North Kalimantan.
Once the data is acquired then the next stage
analysis of both the analysis and planning
overloading Overlay, phases as follows:
The first stage manage the resulting data fruit
bunches weighing, measuring the volume of the
container box FFB and Volume tailgate using the
formula Density =
. So of the relationship
between the volume of the truck with a cargo of oil
palm FFB can be obtained. Furthermore, oil palm
FFB Freight transported by trucks is assumed to be 60
cm above the truck bed with a full payload, making
the scenario more payload carried by TBS load
variation of a high rise above the truck every 10
cm.dengan these assumptions can be made 7 more
payload scenarios so obtained a charge over each
scenario.
Based on secondary data Roads Bulungan
Tanjung Selor limit is a class IIIA collector roads with
the heaviest axle load (MST) ≤ 8 tons. Damage Factor
(ESAL
overload
) and (ESAL
Standard
) with the formula D
= (
)
4
, Configuration trucks axis palm with 1.2
L type truck front axis configuration with 34% and
66% rear axis. Can be calculated Equivalent Single
Axle Load (ESAL) Based on data from more payload
scenarios and formulas to find the value can be
obtained ESAL
overload
for all scenarios and
ESAL
Standard
overloading.
Further analyzes Overlay design life based on the
cumulative results ESAL planning data and survey
data scenario more cargo truck field. Cumulative
ESAL calculated per year starting from the first year
until the end of service life with the traffic growth of
5% and a service life of over 10 years of age.
The second stage the planning process with a thick
layer of additional deflection method use Pd T-05-
2005-B and methods of road pavement design
software malleable (SDPJL).
Using the method of deflection Pd T-05-2005-B,
the Code was initiated by the Transport Infrastructure
R & D Center, Research and Development Agency
Infrastructure Development district. Guidelines
ex.Departemen a road Pavement Inspection Manual
revision by means of Benkelman Beam (01 / MN / B
/ 1983) and in addition to apply to the data deflection
allowed based tool Benkelman Beam. with this
method Overlay layer thickness is obtained in
accordance with the data obtained.
Using methods of road pavement design software
malleable (SDPJL), the calculation process with only
input required data and software will execute to
generate output roughness. Method additional layer
thickness was approved by the Ministry of Public
Works General Directorate of Highways in 2013
became Manual Design pavement No. 02 / M.BM /
2013. with this method Overlay layer thickness is
obtained in accordance with the data obtained.
Further analyzes of the high payloads Overlay
layer. By using methods Pd T-05-2005-B because the
method is flexible in its application VDF value,
according to the road conditions are analyzed,
whereas the method of Software pavement Road
Bending (SDPJL) can not be used because the data
VDF has been programmed.
Based on an analysis of more obtained load
scenarios resulting increase Overlay thickness of each
scenario.
The third thos thick evaluate Overlay using the
program mechanistic Kenpeva of both the method
used to produce a thick layer of Overlay. This
program is the planning of pavement design software
developed by Dr.Yang H Huang, PE Professor
Emeritus of CIVEL Engineering University of
Kentuck. Software is also written in Visual Basic
programming language and can be run with any
version of Windows 95 or above, this program can
only be run in the Windows 95 operating system to
windows xp professional service park 2.
Program kenpave second edition 'Pavement
Analysis and Design' is a Windows version of DOS
substitute four programs Layernip, Kenlayer,
Slabship and Kenslap. Layerinp and Kenlayer an
analysis program for flexible pavements, while
Slabinp and Kenslab an analysis program for rigid
pavement.
EIC 2018 - The 7th Engineering International Conference (EIC), Engineering International Conference on Education, Concept and
Application on Green Technology
218
After the evaluation of the two methods will
retrieved results pavement structure response data in
the form of a vertical strain on the upper layer
subgrade (ɛv) and tensile strain at the bottom of the
surface layer (ɛt). Furthermore, the data will be
processed further by using a transfer function of
asphalt Institute then obtained values Nf and Nd.
The fourth overall stage evaluation results, this
stage determine an efficient method for the additional
layer thickness, provided the value Nd of the second
method is used closest to the value of the design load
repatisi.
3 RESULTS AND DISCUSSION
3.1 Scenario overload
Calculations from 7 to charge more oil palm scenario
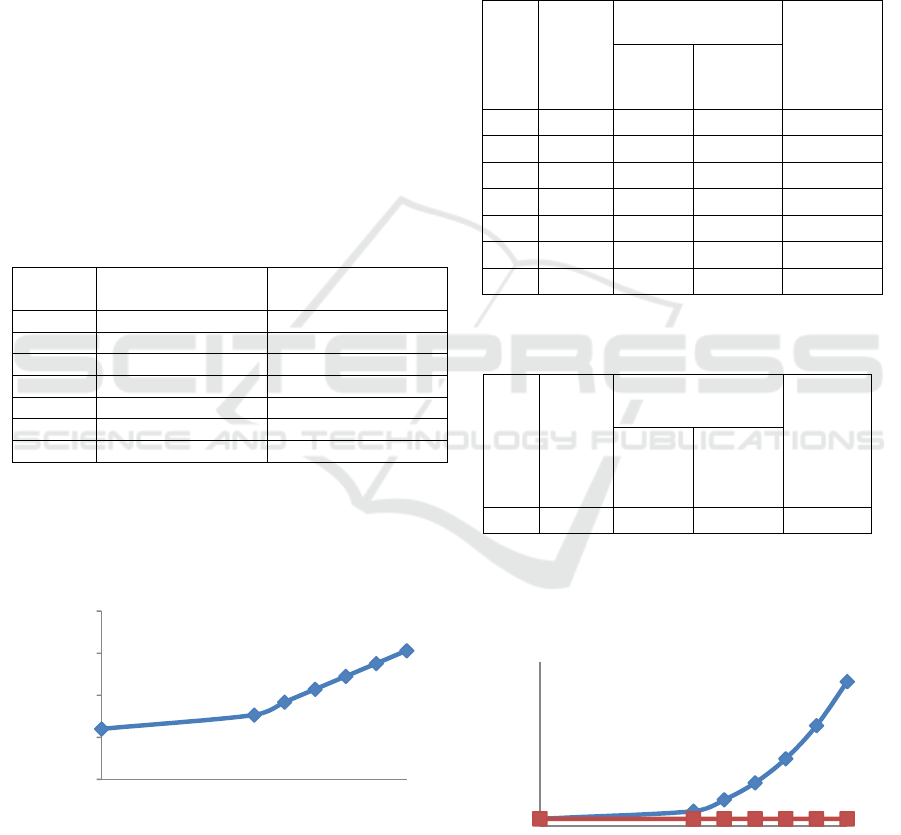
can be seen in Table 1 below:
Table 1: Scenario Truck Loads More Palm Oil
Scenario
High payload FFB Payload more
( m ) ( Ton )
1 0 6
2 1 7.66
3 1.2 9.19
4 1.4 10.72
5 1.6 12.25
6 1.8 13.78
7 2 15.31
Source: Analysis
From the results of the calculations in Table 1, it
can be graphed the relationship between high-load
FFB with more cargo truck as shown below:
Figure 1: Graph relationship between height FFB with more
payload cargo truck.
In Figure 1 it can be seen that there is an increase
in load in scenario 2 to scenario 7 exceeding 6 tons,
where the Tanjung Selor road is the Bulungan limit of
the allowed load of 6 tons for medium truck type
1.2L.
3.2 Equivalent Single Axle Load
Calculation of Equivalent Single Axle Load (ESAL)
based on scenarios more payload and standard ESAL
calculation can be seen in the table below:
Table 2: ESAL
overload
All Scenarios Loads More
No
Weight
Configuration ESAL
Axis total
total Front Back
load
more
(kg) 34% 66% truck
1 8300 2822.00 5478.00 0.22
2 9960 3386.40 6573.60 0.45
3 11490 3906.60 7583.40 0.80
4 13020 4426.80 8593.20 1.32
5 14550 4947.00 9603.00 2.05
6 16080 5467.20 10612.80 3.06
7 17610 5987.40 11622.60 4.41
Source: Analysis
Table 3: ESALstandard
No
Weight
Configuration ESAL
Axis total
total Depan Belakang
more
load
(kg) 34% 66% truck
1 8300 2822.00 5478.00 0.22
Source: Analysis
ESAL
standard
= 0.22 has the same number for each
scenario loading.
Source: Analysis
Figure 2: Graph the relationship between high-value cargo
FFB with VDF.
0.00
5.00
10.00
15.00
20.00
00.511.52
Value overload (Ton)
The height of overload ( mater )
0.00
1.00
2.00
3.00
4.00
5.00
00.511.52
VDF ESAL
The height for Overload (meter)
ESAL for Overload
ESAL Standard
Overload Effect on National Road Overlay Planning In North Kalimantan
219
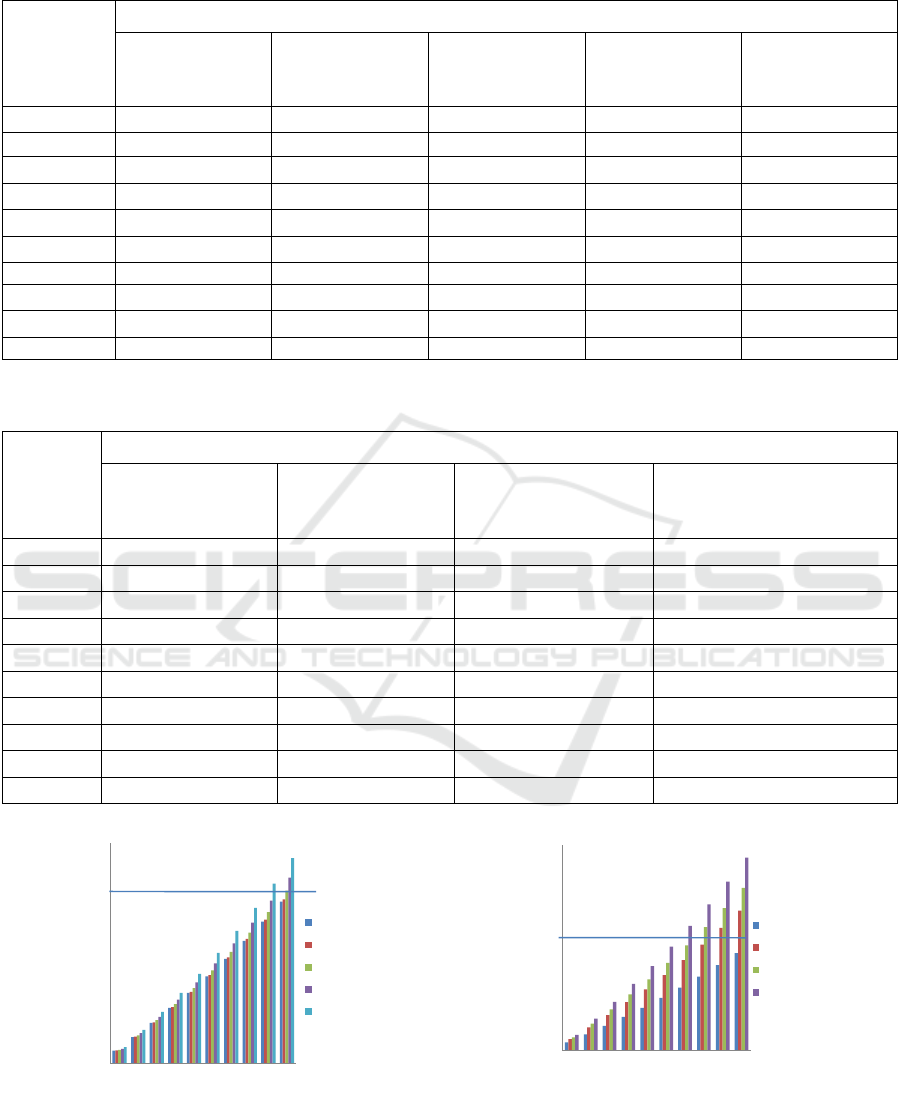
Table 4: Analysis of the charge of the lifetime high serviceability
Year
Comulative ESAL
Planning
Height Overload
0 m
Height Overload
1 m
Height Overload
1,2 m
Height Overload
1,4 m
(ESA) (ESA) (ESA) (ESA) (ESA)
2017 52,906.20 53,649.63 56,461.96 60,741.58 67,099.88
2018 108,457.72 109,981.75 115,747.02 124,520.25 137,554.76
2019 166,786.80 169,130.47 177,996.33 191,487.85 211,532.39
2020 228,032.35 231,236.63 243,358.10 261,803.82 289,208.89
2021 289,277.89 293,342.79 308,719.88 332,119.80 366,885.39
2022 356,801.10 361,814.83 380,781.24 409,643.16 452,523.74
2023 427,700.47 433,710.47 456,445.66 491,042.70 542,444.00
2024 502,144.81 509,200.89 535,893.31 576,512.20 636,860.28
2025 580,311.37 588,465.84 619,313.34 666,255.19 735,997.37
2026 662,386.25 671,694.03 706,904.37 760,485.32 840,091.31
Table 5: Analysis of the charge of the lifetime high serviceability
Year
Comulative ESAL
Planning
Height overload
1,6 m
Height overload
1,8 m
Height overload
2 m
(ESA) (ESA) (ESA) (ESA)
2017 52,906.20 76,025.96 88,375.73 104,882.86
2018 108,457.72 155,853.22 181,170.26 215,009.86
2019 166,786.80 239,671.84 278,604.50 330,643.21
2020 228,032.35 327,681.39 380,910.46 452,058.23
2021 289,277.89 415,690.94 483,216.42 573,473.26
2022 356,801.10 512,721.47 596,008.74 707,333.31
2023 427,700.47 614,603.53 714,440.68 847,886.38
2024 502,144.81 721,579.69 838,794.21 995,467.09
2025 580,311.37 833,904.65 969,365.42 1,150,426.85
2026 662,386.25 951,845.87 1,106,465.19 1,313,134.58
Figure 3: Graph the relationship between high-load FFB
with Age serviceability.
Figure 4: Graph the relationship between high-load FFB
with Age serviceability.
‐
100,000.00
200,000.00
300,000.00
400,000.00
500,000.00
600,000.00
700,000.00
800,000.00
900,000.00
2017
2018
2019
2020
2021
2022
2023
2024
2025
2026
ESAL
Year
Planning
Heightoverload0m
Heightoverload1m
Heightoverload1,2m
Heightoverload1,4m
Service
Life
‐
200,000.00
400,000.00
600,000.00
800,000.00
1,000,000.00
1,200,000.00
1,400,000.00
2017
2018
2019
2020
2021
2022
2023
2024
2025
2026
ESAL
Year
Planning
Heightoverload1,6m
Heightoverload1,8m
Heightoverload2m
Service
Life
EIC 2018 - The 7th Engineering International Conference (EIC), Engineering International Conference on Education, Concept and
Application on Green Technology
220

In the Figure 2, it can be seen that ESAL
load
is
greater than ESAL
Standard
, so that there is an overload
on the Tanjung Selor road in the Bulungan boundary.
3.3 Service life
Cumulative ESAL calculated per year starting from
the first year until the end of service life with the
traffic growth of 5% and a service life of over 10
years of age. Results of analysis of the high payloads
of the lifetime serviceability shown in the Table 4 and
Figure 3.
When viewed from the graph above, there is a
decrease in service life for 1 (one) year from the
planned age caused by a high 1.4 meter load. For the
next high load can be seen in Table 5 and Figure 4.
When viewed from the graph above, there is a
decrease in the age of Layan for 4 (four) years from
the age of the 10-year plan, which is caused by a high
load of 2 meters.
3.4 Metode defletion PdT-05-2005-B
and SDPJL
Planning an extra layer thickness (Overlay) using the
method of deflection Pd T-05-2005-B and methods of
road pavement design software malleable (SDPJL)
each obtained result Overlay thickness values as
follows:
Pd T-05-2005-B = 4,86 cm
SDPJL = 4,00 cm
3.5 Kenpave mechanical program
Kenpave mechanistic program evaluation results of
deflection methods Pd T-05-2005-B and methods of
road pavement design software malleable (SDPJL)
respectively results obtained Nd values as follows:
Pd T-05-2005-B = 130.606.838,49 ESA
SDPJL = 113.903.693,48 ESA
Overall Evaluation Results With ESA repatisi
589,561,48 the design load of the two methods is the
method of Pd T-05-2005-B with a value of
130,606,838.49 ESA and SDPJL value with a value
of 113,903,693.48 ESA, so we can conclude planning
of additional layer thickness (Overlay) efficient
SDPJL method than Pd T-05-2005-B method.
4 CONCLUSIONS
From the results of this study can be summarized that
from the truck load scenario, the value of scenario 2
to 7 is greater than the National Road permit load on
the Tanjung Selor road, the Bulungan limit is 6 tons.
so that the ESAL
Overload
value is greater than the
ESAL
Standard
. Truck loads with a height of 2 meters
have a deteriorating effect on the service life of 4
(four) years from the age of the 10-year plan.
Planning additional layer thickness by the method of
deflection Pd T-05-2005-B obtained amounted to
4.86 cm thick layer and methods of road pavement
design software malleable (SDPJL) obtained layer
thickness of 4.00 cm with a design life of 10 years.
The evaluation results with program loading
mechanistic kenpave of both the methods used
obtained value of Nd, Pd deflection method T-05-
2005-B obtained Nd value of 130,606,838.49 ESA
and methods of road pavement design software
malleable (SDPJL) Nd values obtained by ESA
113,903,693.48. With ESA repatisi 589,561.48 the
design load of the two methods is the method of Pd
T-05-2005-B with a value of 130,606,838.49 ESA
and SDPJL value with a value of 113,903,693.48
ESA, so we can conclude planning of additional layer
thickness (Overlay) efficient SDPJL method than Pd
T-05-2005-B method. Trucks carrying FFB oil palm
are not the main factor causing the initial damage to
the national road on the Tanjung Selor road to the
Bulungan boundary.
ACKNOWLEDGEMENTS
Hereby I express my gratitude for Ir. Ary setyawan,
M.Sc ( Eng ).,Ph.D, Budi Yulianto,S.T. M.Sc.,Ph.D,
as the promoter and copromoter as Thesis who have
allowed the writer to publish the result of this
introductory study. This article is expected to be
useful for as a reference in decision making, or as
a material of study.
REFERENCES
Anugrah, D. 2012. Analysis of the cost of
rehabilitation and maintenance of roads due to
overloading. Bangka.
Associatio of American State Highway and
Organizational Transportation (AASHTO),
Overload Effect on National Road Overlay Planning In North Kalimantan
221

(1993). Planning of Thickness of Bending,
Washington.
Directorate General of Highways, 2005. Planning
Guidelines Thickness of Supplemental Layers
Boundary Hardenability by PdT-05-2005-B
deflection method. Ministry of Public Works,
Jakarta.
Directorate General of Highways, Operations of
SDPJL Version 1.0.0. Ministry of Public Works,
Jakarta.
Fikri, H. F., 2013. Analysis additional layer thickness
calculation (overlay) on pavement supple
component analysis method and the method of
design software pavement plexible road. East
Kalimantan.
Huang Y.H., 1993. Pavement Analysis and Design,
University of Kentucky, Prentice Hall, Englewood
Cliffs, New Jersey.
Helmi, A., 1999. A study on the formula for damaged
vehicle wheels from several countries and
agencies, Proceedings of the 6 th Regional
Western Line of Engineering Conference.
Indriani, N. I., 2014. Pavement response due to
overloading on performance degradation and
road damage (case study of pantura national
road).
Sari, N. D., 2014. Analysis of vehicle load on the
degree of damage to roads and residual life. South
Sumatra.
SAAdisasmitha.et al., 2018. Effect of overload of the
lifetime of the plan. Gowa.
Widodo, S., 2009. Influence of asphalt damage to
service life of highway in national road kartasura-
klaten.
EIC 2018 - The 7th Engineering International Conference (EIC), Engineering International Conference on Education, Concept and
Application on Green Technology
222
