
Seismic Demand Due to the Earthquake Hazard Map 2017
Determination in Indonesia
Restu Faizah and Elvis Saputra
Civil Engineering, Universitas Muhammadiyah Yogyakarta, Faculty of Engineering, Yogyakarta, Indonesia
Keywords: Seismic demand, Earthquake hazard map, Dynamic spectra response
Abstract: The Earthquake Hazard Map used in the design of earthquake resistant infrastructure in Indonesia has
developed from Earthquake Hazard Map 2010 to 2017. This development affects the improvement of
seismicity pattern in several areas in Indonesia, which may lead to the increase of seismic demand. Therefore,
it is needed to carry out a study to investigate the condition of seismicity in different cities in Indonesia. This
study analyzed a model structure located in 32 cities in Indonesia by referring to the Earthquake Hazard Map
2010 and 2017. The analysis uses a dynamic spectra response method through SAP2000 software to obtain
the value of a fundamental period of structure, deflection, and base shear. Based on the analysis, it can be
identified that 16 cities increase their seismicity pattern significantly and the highest escalation occurred in
Jayapura city of 60%. Meanwhile, the highest base shear value in 2010 is on Palu and changed into Jayapura
in 2017. The decrease of seismic conditions also occurred in 16 other cities with the highest decline is in
Merauke city of 53%. For particular areas affected by seismicity, further analysis of existing building
especially high-risk building is suggested.
1 INTRODUCTION
Ministry of Public Works and Housing (PUPR) in
Indonesia released the new Earthquake Hazard Map
2017 (EHM-2017) (PUSGEN, 2017) which is the
update of the Earthquake Hazard Map 2010 (EHM-
2010) (PU, 2010). The reason for map improvement
is because the map has been aged more than five years
and it new seismic sources has been identified. In
addition, the improvement was also made in order to
increase the accuracy estimation of important
parameters in the map, as well as the detail of
earthquake source using the equation of current
earthquake attenuation. This is according to Vipin et
al. (2009) statement that earthquake hazard is
controlled by three factors, i.e. properties of the
source, characteristics of the path, and local site
effects. Past earthquake data, characteristics of
earthquake sources in the region and attenuation
relationships are three important factors that must be
considered to assess the hazards of earthquakes
The preparation of EHM-2017 considers the
occurrence of major earthquakes in recent years and
the identification of earthquake sources such as active
faults that appear in various regions in Indonesia. The
National Center for Earthquake Study in Indonesia
states that the amount of active faults in Indonesia has
increased from 81 in 2010 to 295 in 2017 (PUSGEN,
2017). The improvement of seismic hazard in EHM-
2017 may affect the earthquake-stricken structural
response that may indicate the seismic demand in the
structural design. In principle, buildings should be
designed to withstand the seismic loads of 2017
safely which is exposed by acceptable deflection and
base shear. This case generates a further issue about
existing buildings that must be evaluated to determine
its performance of seismic loads in 2017 (Imran,
2007). Therefore, it is necessary to investigate
structural response in various cities in Indonesia, to
identify the seismic demand in each location.
Faizah and Widodo (2013) investigated the
previous improvement of EHM that is from 2002 to
2010 and reported that it resulted in changes of
seismic demand in 23 cities under review. There was
a significant increase in Semarang, Yogyakarta,
Kendari, Banda Aceh, and Palu, with the highest
escalation in Semarang by 126%. Meanwhile the
decline of seismic demand occurred in Bandar
Lampung, Palembang, Jakarta, Kupang,
Banjarmasin, Samarinda, and Makassar. Similar
research was conducted by Arfiadi (2014), by
evaluating 22 cities in Indonesia. The results showed
108
Faizah, R. and Saputra, E.
Seismic Demand Due to the Earthquake Hazard Map 2017 Determination in Indonesia.
DOI: 10.5220/0009007101080116
In Proceedings of the 7th Engineering International Conference on Education, Concept and Application on Green Technology (EIC 2018), pages 108-116
ISBN: 978-989-758-411-4
Copyright
c
2020 by SCITEPRESS – Science and Technology Publications, Lda. All rights reserved
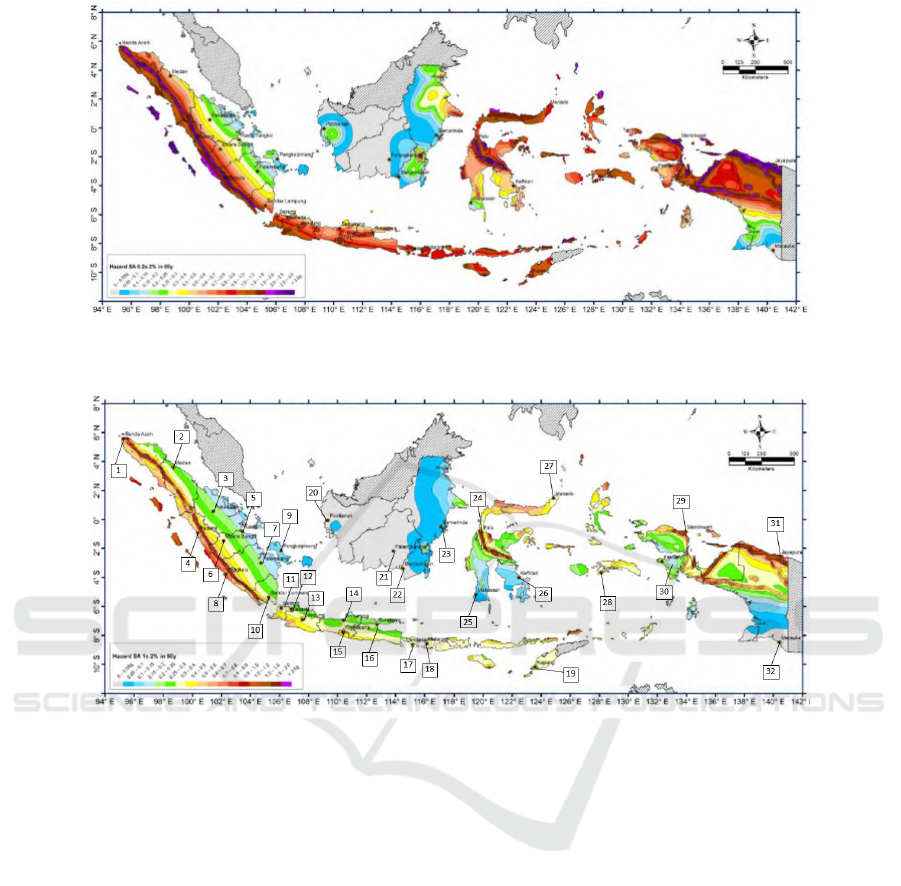
Figure 1: The map of spectral acceleration at short period (SS) with 5% damping ratio in bedrock (SB) for probability
exceeded 2% in 50 years (EHM-2017).
Figure 2: The map of spectral acceleration 1 second period (S
1
) with 5% damping ratio in bedrock (SB) for probability
exceeded 2% in 50 years (EHM-2017).
that Palu and Semarang have a significant increase of
spectral acceleration response both for a short period
(SS) and 1 second period (S1). It is also stated that the
difference of spectral acceleration response will be
greater than that of the soil type is harder.
This study analyzes a structure located in 32 cities
in Indonesia by referring to EHM-2010 (PU, 2010)
and EHM-2017. From this analysis, it can be
identified the base shear value that can indicate the
seismic demand in the site. The analysis of seismic
demand is very urgent in order to evaluate the
performance of existing buildings located in the
earthquake prone-area. There are areas which
experience an escalation or a decline for the others in
term of base shear value. This value must be
calculated as a requirement of a seismic load in the
design of a structure (ASCE, 2017). Therefore, the
escalation of seismic demand after the determination
of EHM-2017 generates a problem, especially for the
existing building. The paper contributes in
developing a new seismic building code especially to
assess the structural vulnerability of the existing
building.
1.1 Development of the Earthquake
Hazard Map (EHM) in Indonesia
Asrurifak (2017) explains that EHM was first created
in 1962 and published in the Indonesian Concrete
Standard (Peraturan Beton Indonesia/PBI) in 1966,
where the Indonesian’s territory is without Irian Jaya
city. In 1970, EHM was repaired and published in the
Indonesian Loading Standard (Peraturan Muatan
Indonesia/PMI) by integrating the Irian Jaya city in
the Indonesian’s territory. After 1970, there were
several major earthquakes, including the 1976-Bali
Earthquake. It causes PMI-1970 be revised into
Indonesian Loading Standard (Peraturan
Seismic Demand Due to the Earthquake Hazard Map 2017 Determination in Indonesia
109

Figure 3: A reinforced concrete frame model.
Pembebanan Indonesia/PPI) in 1981 which are also
published in several standards, such as the Standard
of Earthquake Resistant Design-1983 and Standard of
Loading Procedures for Indonesian Building-1983.
This EHM has revised again to EHM-2002 and
published in SNI 03-1726-2002, where Indonesia was
divided into six seismic areas. After that, there were
several major earthquakes such as the 2004-Aceh
Earthquake, 2005-Nias, 2006-Jogja, 2009-Tasik,
2007-Bengkulu, 2009-Padang and 2010-Mentawai in
Indonesia, so EHM was revised to the EHM-2010 and
published in SNI-1726:2012, SNI-2847:2013, SNI-
1729:2014, and SNI-7973: 2013. EHM was finally
revised in 2017 which has considered several
earthquake events that are not yet to be calculated on
the previous map. Besides, there were 214 new faults
identified as the latest quake source parameter. The
value of spectral acceleration from EHM-2017 at
short period (SS) and 1 second period (S1) with 5%
damping ratio in bedrock (SB) for probability
exceeded 2% in 50 years shown in Figures 1 and 2
(PUSGEN, 2017).
2 RESEARCH METHODOLOGY
The analysis in order to find out the difference of
structure response that occurred due to seismic
loading in EHM-2010 and 2017 uses the dynamic
method of spectra response by SAP2000-3D
software. The structure model is a 10-story reinforced
concrete frame with four spans of each side which is
presented in Figure 3. The specifications of structure
model and the column/beam dimensions are shown in
Table 1 and Table 2 respectively. The structure model
is assumed as an office building located in 32 cities in
Indonesia as mentioned in Table 3, including the
spectral acceleration value that was observed from
EHM-2010 and 2012. Structure response due to the
2010 and 2017 seismic load which includes a
fundamental period of structure, deflection, and base
shear can be identified from the structure 3D analysis
using SAP-2000 software. The result is compared to
the structure response 2010 and 2017 to find out its
escalation or decline in 32 cities in Indonesia. The
response spectra design is also compared between
2010 and 2017 in each city to identify the difference
in structure response.
Table 1: Specification of structure model.
Specification Provisions
Building function Office
Concrete strength 30 MPa
Modulus of elasticity of concrete 25742 MPa
Reinforcement bar BJTD 41
Stirrups BJTD 34
Modulus of Elasticity of steel 2.105 MPa
Typical-height of story 4 m
Wide of spans 4 m
Table 2: Dimension of column/beam (mm).
Level
Side-
column
Middle-
column
Main
Beam
b h b h b h
1-4 700 700 800 800 350 700
5-7 600 600 700 700 300 600
8-10 500 500 600 600 250 500
b = width ; h = height.
EIC 2018 - The 7th Engineering International Conference (EIC), Engineering International Conference on Education, Concept and
Application on Green Technology
110

Table 3: Cities and values of S
S
and S
1
(sec.).
No.* City
EHM 2010 EHM 2017
S
S
S
1
S
S
S
1
1. Banda Aceh 1.349 0.642 1.71 0.65
2. Medan 0.526 0.332 0.58 0.28
3. Pekanbaru 0.435 0.273 0.35 0.24
4. Padang 1.398 0.600 1.25 0.52
5. Kuala Tungkal 0.210 0.170 0.32 0.19
6. Muara Bungo 0.544 0.310 0.62 0.36
7. Palembang 0.262 0.164 0.28 0.21
8. Bengkulu 1.372 0.567 2.15 0.81
9. Pangkal Pinang 0.057 0.077 0.14 0.11
10. Bandar Lampung 0.739 0.318 0.77 0.34
11. Serang 0.784 0,334 0.84 0.36
12. Jakarta 0.664 0.293 0.72 0.31
13. Bandung 1.450 0.486 1.20 0.40
14. Semarang 1.098 0.364 0.73 0.28
15. Yogyakarta 1.212 0.444 1.32 0.44
16. Surabaya 0.663 0.274 0.75 0.27
17. Denpasar 0.977 0.360 0.80 0.31
18. Mataram 0.960 0.385 0.94 0.34
19. Kupang 1.113 0.296 0.92 0.26
20. Pontianak 0.017 0.022 0.17 0.02
21. Palangkaraya 0.059 0.031 0.04 0.02
22. Banjarmasin 0.060 0.036 0.08 0.03
23. Samarinda 0.125 0.089 0.11 0.07
24. Palu 2.164 0.765 2.42 0.91
25. Makassar 0.317 0.142 0.22 0.08
26. Kendari 0.825 0.330 0.64 0.13
27. Manado 1.035 0.442 0.97 0.35
28. Ambon 1.380 0.490 0.92 0.30
29. Manokwari 1.454 0.561 1.65 0.62
30. Fak-fak 0.518 0.190 0.59 0.24
31. Jayapura 1.500 0.600 2.81 0.94
32. Merauke 0.055 0.021 0.02 0.01
*refer to Figure 2
3 RESULTS AND DISCUSSION
The study covers an analysis of the spectra response
design and structure response on the structure located
in 32 cities in Indonesia due to earthquake loads
according to EHM-2010 and 2017.
3.1 Response Spectra Design
Based on the spectral acceleration values in Table 3,
a spectra response design of 2010 and 2017 is
assigned, which has an own characteristic in each
city. In this manuscript, some results are given for the
sample to be analyzed. Figure 4.a shows Banda
Aceh’s spectra response design that increases from
2010 to 2017 in all variant structure’s period, but the
escalation is not fixed. For structures with 0.125 s –
0.69 s of fundamental period, the escalation is
significant. Whereas in Jayapura, it is estimated that
there is an increase of spectral acceleration for
structures with more than 1 second of the
fundamental period and decrease for others.
Afriadi (2014) compares the spectra value of 2002
and 2012-according to Indonesian Earthquake
Hazard Map and 2012 is higher than 2002. There
were 22 cities in Indonesia which was investigated
and it is reported that Palu and Semarang city
experience a very significant increase of spectral
acceleration both short and one-second periods. Cities
that have a significant increase in spectral
Seismic Demand Due to the Earthquake Hazard Map 2017 Determination in Indonesia
111
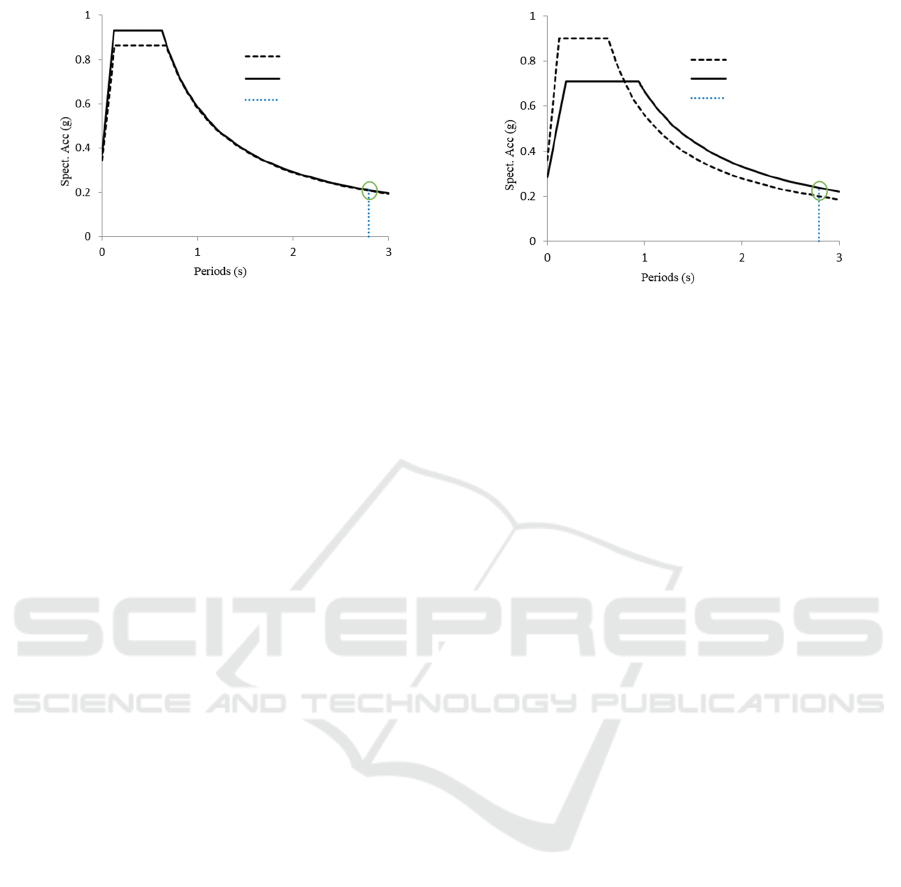
(a)
(b)
Figure 4: Spectra response design of (a) Banda Aceh and (b) Jayapura.
acceleration due to seismic load 2012 also have a
significant increase in the internal force of building.
Therefore, with the enactment of the seismic load
2012, it is necessary to evaluate the resistance of the
structures, especially for a site which has an increased
value of S
DS
and S
D1
.
3.2 Fundamental Period
The fundamental period of structure model can be
obtained from the analysis, which is 2.79 s. This value
can be delineated in the curve of spectra response
design (Figure 4) to identify the spectral acceleration
due to the earthquake load on the structure. For Banda
Aceh (see Figure 4.a), the value of spectral
acceleration 2010 and 2017 are 0.208 g and 0.210 g
respectively, it means that the value of 2017 is
slightly larger than 2010. This value may affect the
magnitude of base shear of the structure. This
occurrence is different from Jayapura that has a value
of base shear 2017 which is significantly greater than
2010, especially for 0.124 s - 0.62 s of the
fundamental structure period. Based on Jayapura’s
spectra response design in Figure 4.b, it can be
determined that the value of spectral acceleration
2010 and 2017 are 0.201 g and 0.238 g respectively.
There is a significant dissimilarity between both of
the values. Based on this result, it can be concluded
that the spectral acceleration value depends on the
fundamental period of structure and the seismicity
pattern of the site, which is in accordance with the
statement (Adam et al., 2017; Borzouie et al., 2016;
Murthy, 2003) that in a typical city, there are
buildings of many different sizes and shapes. One
way of categorizing them is by their fundamental
natural period (T).
3.3 Base Shear
This study investigated base shear values of structure
to predict the magnitude of seismic demand as a
requirement of structure design. In addition, the
deflection of the structure is also quantified,
especially for the location of the base shear decline
from 2010 to 2017. Figure 5 shows the comparison of
the base shear value of structure between 2010 and
2017 at 32 cities in Indonesia due to the seismic loads
according to EHM-2010 and 2017. Jayapura has a
peak value of base shear in term 2017 and the highest
escalation from 2010 to 2017. The value of
Jayapura’s base shear-2017 is 4525.5 kN which
increases 60.2% from the 2010 value. The escalation
of base share value from 2010 to 2017 can be seen in
Figure 6. There are 16 cities have increased their base
shear value, while the other 16 cities have a decrease
in their base shear value.
The result of this study is similar to the result of
the research conducted by Faizah and Widodo (2013).
However there is a difference in the location that has
the peak value of escalation on the base shear. From
2002 to 2012, the peak value of base shear escalation
was in Semarang (126%), but from 2012 to 2017, it
shifted to Jayapura (60%). Some locations have
increased the seismic load design in 2012 but
decreased in 2017, conversely. For example is the
base shear of Semarang city which experienced a
significant increase in 2012 but decrease in 2017.
Meanwhile, Bandar Lampung’s base shear
experienced an increase in 2012, but decrease in
2017. These conditions may not apply equally to
various structures because each type of structure may
have a different fundamental period that affects its
spectral acceleration value. On the other hand, the
similar study with variations in structure types like
Earthquake Map 2010
Earthquake Map 2017
Fundamental Period
EHM 2010
EHM 2017
Fundamental Period
EIC 2018 - The 7th Engineering International Conference (EIC), Engineering International Conference on Education, Concept and
Application on Green Technology
112
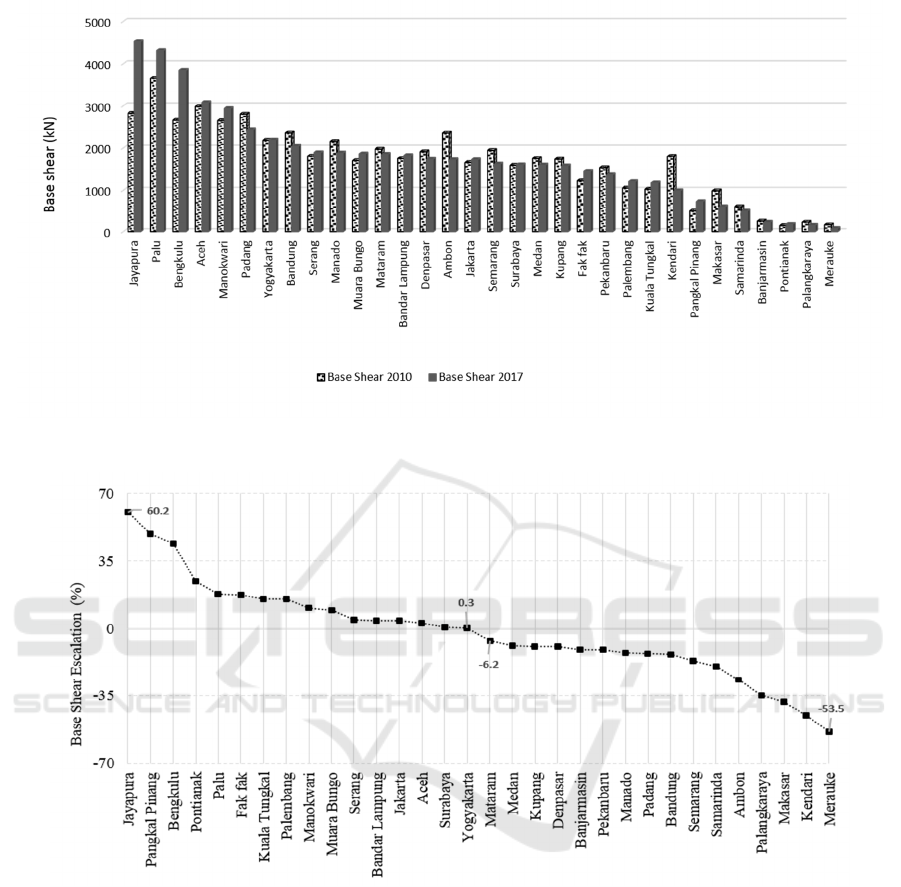
Figure 5: The comparison of base shear value between 2010 and 2017.
Figure 6: The escalation of base share value from 2010 to 2017.
the number of story and span, type of materials,
various fundamental of structures, and etc. is
recommended to be done. The development of
seismic hazard map is also investigated in various
location (Gracia et al., 2018; Unal et al., 2014;
Courboulex, 2007).
3.4 Horizontal Deflection
Subsequently, this study reviews the horizontal
deflection emerging the structure that experienced an
increase base shear in 2017. The horizontal deflection
of structures affected by EHM-2017 in 16 cities is
presented in Figure 7. Jayapura has the largest
horizontal deflection of 0.087 m.
The drift ratio of the structure due to EHM-2017
can be calculated by dividing the deflection with the
height of the structure at each level and the results
obtained are mentioned in Table 4. The largest of drift
ratio in each structure always in 8 stories that are
written in bold font. This result is compared to the
allowable drift ratio requirement according to
Indonesian Earthquake Resistant Structure Design
Standard (BSN, 2012). The structure model is an
Seismic Demand Due to the Earthquake Hazard Map 2017 Determination in Indonesia
113
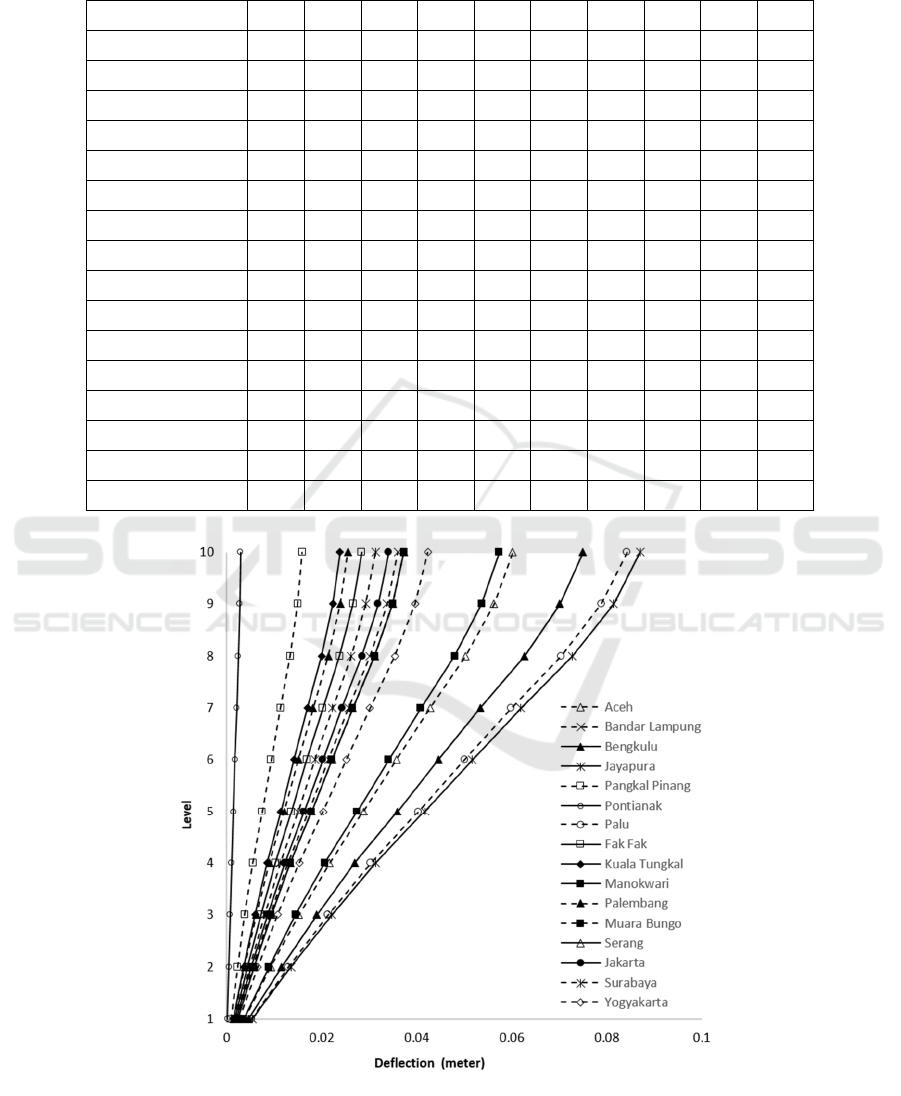
Table 4: The drift ratio in each story of the structure in 16 cities (mm)
City / no. of story 1 2 3 4 5 6 7 8 9 10
Aceh 0.93 1.40 1.49 1.60 1.81 1.73 1.76 1.88 1.50 0.97
Bandar Lampung 0.55 0.84 0.89 0.96 1.09 1.04 1.06 1.13 0.90 0.58
Bengkulu 1.15 1.74 1.85 1.99 2.25 2.15 2.20 2.34 1.87 1.21
Jayapura 1.35 2.03 2.15 2.31 2.60 2.50 2.55 2.71 2.16 1.41
Pangkal Pinang 0.22 0.35 0.38 0.43 0.49 0.48 0.49 0.51 0.39 0.24
Pontianak 0.05 0.07 0.07 0.08 0.09 0.09 0.09 0.09 0.07 0.05
Palu 1.30 1.96 2.08 2.24 2.53 2.42 2.47 2.63 2.10 1.36
Fak Fak 0.44 0.66 0.70 0.76 0.85 0.82 0.83 0.89 0.71 0.46
Kuala Tungkal 0.36 0.55 0.59 0.64 0.72 0.69 0.70 0.75 0.60 0.38
Palembang 0.37 0.57 0.62 0.69 0.78 0.76 0.77 0.81 0.63 0.39
Manokwari 0.88 1.34 1.42 1.53 1.72 1.65 1.68 1.79 1.43 0.92
Muara Bungo 0.57 0.86 0.92 1.00 1.13 1.07 1.09 1.17 0.93 0.60
Serang 0.57 0.87 0.92 1.00 1.12 1.07 1.09 1.17 0.93 0.60
Jakarta 0.52 0.79 0.84 0.91 1.03 0.98 0.99 1.07 0.85 0.55
Surabaya 0.48 0.73 0.77 0.83 0.94 0.90 0.92 0.98 0.78 0.50
Yogyakarta 0.66 0.99 1.05 1.12 1.27 1.22 1.24 1.32 1.05 0.69
Figure 7: The horizontal deflection of the structure in 16 cities.
EIC 2018 - The 7th Engineering International Conference (EIC), Engineering International Conference on Education, Concept and
Application on Green Technology
114

Figure 8: The escalation of structure’s drift ratio located in 16 cities in Indonesia.
office building and it is classified as II-risk category.
Hence, the drift ratio should not be greater than 0.020
time the high of story. The allowable drift ratio for
this structure is 80 mm and the largest of drift ratio is
qualify clearly.
Maximum drift ratio of the structure due to EHM
2010 and 2017 are also compared. The escalation of
maximum drift ratio due to both of EHM 2010 and
2017 (Figure 8) is not similar to the escalation of base
shear value (Figure 6). The structure located in
Pontianak increased base shear value by 3% but
decreased its maximum drift by -12%. Similar
conditions may occur in the other cities. This
indicates that the increase in the base shear value is
not always proportional to the increase in the drift
ratio and cannot be used to predict the building’s
ability against earthquake. Further study needs to be
held to investigate the resistance of various types of
buildings located in other cities in Indonesia against
earthquakes according to the EHM-2017.
4 CONCLUSION
Seismic demand has been studied in this paper
through a dynamic spectra response analysis of the
structure model located in 32 cities in Indonesia. It
was indicated by the base shear value which was
calculated according to EHM-10 and EHM-17. The
result showed that there were 16 cities experienced an
escalation and degradation for the other city, in term
of base shear value. It also found that increase in base
shear value from 2010 to 2017 was occurred in
Jayapura city by 60%, in term of 2.79 seconds of
structure fundamental period. This increase might be
different from other structures which have different
fundamental periods.
Horizontal deflection was also presented in this
study to identify its correlation to base shear value.
The analysis concluded that the increase in the base
shear value could not be used to predict the building’s
ability against earthquake. A further study is also
suggested in order to investigate the resistance of
various types of buildings located in other cities in
Indonesia against earthquakes according to the EHM-
2017, whether it is in various materials, geometry,
located, and function of structures.
ACKNOWLEDGEMENTS
The authors gratefully acknowledge Universitas
Muhammadiyah Yogyakarta for their supports and
assistances during this study.
REFERENCES
Adam, C., Kampenhuber, D., Ibarra, L. & Tsantaki, S.,
2017. “Optimal Spectral Acceleration-based Intensity
Measure for Seismic Collapse Assessment of P-Delta
Vulnerable Frame Structures”, Journal of Earthquake
Engineering, Vol. 21, No. 7, pp. 1189-1195.
Afriadi, Y., The Effect of Earthquake_SNI 2012
Determining for Reinforced Concrete Frame Design in
Cities in Indonesia, HAKI Indonesia. Jakarta.
Seismic Demand Due to the Earthquake Hazard Map 2017 Determination in Indonesia
115

ASCE, 2017. “Minimum Design Loads and Associated
Criteria for Buildings and Other Structures”, ASCE
Standard, ASCE/SEI 7-16. Reston, Virginia: American
Society of Civil Engineers.
Asrurifak, 2017. The 2017 Earthquake Hazard Map and its
application for Building and Infrastructure Resistance
Design, ITS. Surabaya.
Borzouie, J., Chase, J. G., MacRae, G. A., Rodgers, G.
W. & Clifton, G. C., 2016. “Spectral Assessment of the
Effects of Base Flexibility on Seismic Demands of a
Structure”, Advances in Civil Engineering, p. 8.
BSN, 2012. Indonesian Earthquake Resistant Structure
Design Standard for Building and other (SNI
1726:2012), Indonesian Standardization Agency
(BSN). Jakarta.
Courboulex, F., Larroque, C., Deschamps, A., Kohrs-
Sansorny, C., Gélis, C., Got, J. L., Charreau, J.,
Stéphan, J. F., Béthoux, N., Virieux, J., Brunel, D.,
Maron, C., Duval, A. M., Perez, J-L, Mondielli, P.,
2007. “Seismic hazard on the French Riviera:
observations, interpretations and simulations”,
Geophysical Journal International, Vol. 170, No. 1, pp.
387-400.
Faizah, R. & Widodo, W., 2013. “The Analysis of
Earthquake Load Design on Multi Story Building by
Dynamic Spectra Response (in Bahasa)”, Konteks 7,
Universitas Sebelas Maret (UNS), Surakarta, pp. S201-
S208.
Gracia, J., Slejko, D., Rebez, A.,Santulin, M. & Alvarez, L.,
2008. “Seismic Hazard Map for Cuba and Adjacent
Areas Using the Spatially Smoothed Seismicity
Approach”, Journal of Earthquake Engineering, Vol.
12, No. 2, pp. 173-196.
Imran, I., 2007. The anticipation of Impact of Indonesia
Earthquake Map Updated for Building Structure
Design and Related SNI, FTSL ITB. Bandung.
Murthy, C., 2003. “How Flexibility of Buildings Affects
Their Earthquake Response?”, Learning Earthquake
Design and Construction, IITK - Earthquake Tip 10, pp.
19-20.
PU, 2010. Indonesian Earthquake Hazard Map 2010: as a
Basic Reference for Earthquake Resistance
Infrastructure Design, The Indonesian Ministry of
Public Works (PU). Jakarta.
PUSGEN, 2017. The 2017 Indonesian Hazard and
Earthquake Source”, The Indonesian Ministry of
Public Works and Housing (PUPR). Bandung.
Unal, S., Selebioglu, S. & Ozmen, B., Seismic hazard
assessment of Turkey by statistical approaches. Turkish
Journal of Earth Sciences, Vol. 23, pp. 350-360,
(2014).
Vipin, K., Anbazhagan, P. & Sitharam, T. G., 2009.
“Estimation of Peak Ground Acceleration and Spectral
Acceleration for South India with Local Site Effects:
Probabilistic Approach”, Natural Hazard Earth System
Science, Vol. 9, pp. 865- 878.
EIC 2018 - The 7th Engineering International Conference (EIC), Engineering International Conference on Education, Concept and
Application on Green Technology
116
