
Investigating the Effect of Inlet Velocity on Temperature Distribution
and Solid Volume Fraction in Fluidized Bed Dryer using CFD
Efflita Yohana
1
, M. Tauviqirrahman
1
, Muh. Ilham Mahawan
1
, Kwang-Hwan Choi
2
and
M. Syahreza Al Mulqi
1
1
Department of Mechanical Engineering, Universitas Diponegoro, Indonesia
2
Department of Agricultural Biotechnology, Seoul National University, Seoul, Republic of Korea
Keyword: Fluidized Bed Dryer, CFD, Drying, Tea.
Abstract: Tea leaves drying is a process to stop polyphenol oxidation and reduce the humidity of the leaves by
roasting technique. The roasting techniques uses heat which generated from wood burning. The roasting
must be monitored carefully so that the leaves are not too dry or even singed. The process of roasting from
wood burning (organic material) increasing the levels of Polycyclic Aromatic Hydrocarbon (PAH) of the tea
because of the fume from its combustion. Polycyclic Aromatic Hydrocarbon (PAH) is a member of
Hydrocarbon which consisting of two or more close aromatic ring structures. Each of structure consist of
benzo[a]pyrene. Benzo[a]pyrene formed from the imperfect combustion which are carcinogenic and
mutagenic which can cause cancer. One of the ways that can be done to reduce the negative impact of
drying with a wood burning is using a fluidized bed dryer (FBD). Fluidized bed dryer is a drying technique
by reducing and eliminating humidity on the solid particle and change the humidity to gas (evaporation), in
another word, this technique is called convective drying. On the drying technique, water has a role as
evaporating fluid (evaporated) and air as gas cleaner. This research aims to analyze the effect of velocity
variation on temperature and solid volume fraction distribution. This research uses Computational Fluid
Dynamics (CFD) software in 2D modelling with a constant temperature at 130 ˚C and varying velocity at
1.152 m/s, 1.536 m/s, 1.728 m/s and 1.8 m/s to get the average particle temperature distribution. Simulation
results obtained error on temperature distribution of particles with an average error of 0.67625%. Solid
volume fraction contour, velocity contour, and temperature distribution contour show that the optimum
velocity of fluidization and particle temperature distribution optimum velocity is 1.728 m/s.
1 INTRODUCTION
Development of tea business in Indonesia is located
at North Sumatra region, however, tea estates in
Indonesia lately are on declining condition.
Development of tea plants area in Indonesia has
declined since 2002, so there is 126.251 Ha left in
2009. Indonesia’s tea agro-industries have recorded
as the biggest earning of foreign exchange in the
national economy at the time. Declining of the cast
of planting area causes the tea production in
Indonesia declined too. Tea production in 2008 was
recorded as many as 137.499 tons, however, in 2010
the production became 129.200 tons (Sudjarmoko,
2014). Indonesia’s tea agro-industries are currently
undergoing declined because it has not been able to
overcome the problems which were faced by tea
producers in Indonesia, like the low crop
productivity because it has not used superior seeds,
the limit of technology to make a product, and
farmers’ inability to use technology in GMP
standard (Good Manufacture Process), GAP (Good
Agriculture Practice), and quality product standards
such as ISO standards (Sudjarmoko, 2014). The
desired standard product condition can be reached
by increasing the quality of tea production. Tea
companies in Indonesia commonly do the drying
process by using a roasting technique. The roasting
technique uses heat which produced by burnt wood
(organic material) for triggering and increasing the
levels of Polycyclic Aromatic Hydrocarbon (PAH)
of the tea because of the smoke from its combustion.
Polycyclic Aromatic Hydrocarbon (PAH) is a
member of hydrocarbon which consists of two or
more close aromatic ring structures, where each of
structure is consisting of benzo[a]pyrene.
Yohana, E., Tauviqirrahman, M., Mahawan, M., Choi, K. and Mulqi, M.
Investigating the Effect of Inlet Velocity on Temperature Distribution and Solid Volume Fraction in Fluidized Bed Dryer using CFD.
DOI: 10.5220/0009005800210028
In Proceedings of the 7th Engineering International Conference on Education, Concept and Application on Green Technology (EIC 2018), pages 21-28
ISBN: 978-989-758-411-4
Copyright
c
2020 by SCITEPRESS – Science and Technology Publications, Lda. All rights reserved
21

Benzo[a]pyrene is formed by completing burn which
is carcinogenic and mutagenic, those characteristic is
believed to contribute to forming of cancer cells
(Philips, 1999). In this research, the drying process
has a role to stop the fermentation process and to
decline the water content on tea leaves with
fluidized bed dryer technique. Fluidized bed dryer is
one of a few drying techniques that used in industry
to produce the dried particulate product. Particle or
object is dried by fluidized bed dryer has to size
about 50-2000 µm. The using of a fluidized bed
dryer has several advantages such as simple
construction and low maintenance cost. Fluidization
is the key of the success of the fluidized bed dryer.
Figure 1 shows the scheme from several fluidized
bed characteristics. The characteristics are affected
by two factors that are gas velocity and pressure
drop (∆Pb). Bed or place of particle support in
which used as insulation between water distributor
with the particle is made from holey slabs
(distributor).
Basically, the higher velocity of the gas, the
higher pressure drop. they both have a linear
relation. At the particular velocity, called a
minimum of fluidization (umf), and pressure drop
along the area of the object (particle) will equally as
the weight of particles per area (∆Pmf). The particle
in this condition will levitate in the air and spread
out. Increasing of the gas velocity would make the
particle spread out easily, it is caused by the forming
of bubble gas and (∆Pb) would be constant at
(∆Pmf). Minimum point of fluidization can be
clearly identified when the gas velocity decreasing
(Bahu, 1997).
This research is focused on temperature
distribution condition and fluidization effect by
varying inlet velocity on fluidized bed dryer. The
analysis is necessary to do because the temperature
condition and fluidization effect (seeing from solid
volume fraction) from the fluidized bed dryer during
the drying process of tea leaves will be seen. To get
the temperature distribution and fluidization effect
of solid volume fraction, a mathematical model of
computational fluid dynamics (CFD) is used
(Versteeg and Malalasekera, 2007).
2 RESEARCH METHOD
The research on the fluidized bed dryer is done with
aiming to compare the experimental result and the
research (Ngoh and Lim, 2016). Invalidation,
modeling corresponding to the paper is used to
analyze temperature distribution and fluidization
effect. CFD is used for analyzing hydrodynamics
phenomena and heat transfer in the 2D modeling of
solid-gas fluidized bed dryer. Modeling by using
“Eulerian-eulerian (gas-solid) model multiphase”
and turbulent model k-omega are used to analyze
hydrodynamics phenomena and heat transfer in
fluidized bed dryer. On the Eulerian-eulerian
modeling, gas phase and solid phase are modeled by
a mathematical model which continue and
conservative so that could be written for each phase.
CFD software, Ansys Fluent, is used to solve mass
equation, momentum equation, and energy
conservation equation simultaneously. Kinetic
energy theory is used to get phase characteristic on
granular flow, the equation which used to solve the
model is written as follows (Ngoh and Lim, 2016):
Continuity equation for gas phase (g) and solid
phase (s):
.0
gg ggg
t
v
(1)
.0
ss sss
t
v
(2)
Momentum equation for gas phase and solid
phase:
. .
g
ggg gggg g g gg gs s g
t
vvvp gKvv
(3)
..()
s
s
ss s sss s g s s s gs g s
t
vvvpp gKvv
(4)
In momentum equation, τ is Reynold tensor
stress, g is gravity acceleration, and interaction force
(tension and buoyant) describes momentum
displacement between a gas phase and solid phase
(solid) which shown with the following equation
sg gsg s
pKvv
The fluctuating conservative energy equation for
solid particle is as follows:
3
.:..
2
s
s
ss s sss s s s s s
t
vIvk
(5)
Drag model from (Gidaspow, 1994) is used to
evaluate the changing on momentum coefficient.
The change in momentum coefficient based on drag
model from Gidaspow is as follows:
2.65
3
0.8
4
sgg s g
gs D g g
s
vv
KC for
d
(6)
2
2
150 1.75 0.8
sg g s
sg
gs g
gs s
vv
Kfor
dd
(7)
where,
EIC 2018 - The 7th Engineering International Conference (EIC), Engineering International Conference on Education, Concept and
Application on Green Technology
22

0.687
24
1 0.15( ) 1000
Dgss
gs
CReforRe
Re
(8)
0.44 1000
Ds
CforRe
(9)
Reynold number for particle (solid), Re
s
, is as below
g
ss g
s
g
dv v
Re
(10)
Constitutive equation is used to completing the
equations relation. Solid phase tensor stress (solid),
τ
s
, is given as follows
2
().
3
T
s
s
ss g ss ss
vv vI
(11)
Where shear stress on solid phase, µ
s
, is given as
follows
,,,
s
scol skin s fr
(12)
Viscosity of particle collision, µ
s,col
, is given below
1/2
,0,
4
(1 )
5
s
scol s s s ss ss
dg e
(13)
Kinetic viscosity (Gidaspow model), µ
s,col
, is
2
,0,
0,
10
4
11
96 1 5
ss s
skin ss s ss
sssss
d
ge
eg
(14)
And shear viscosity of particle (solid), µ
s,col
, is
,
2
sin
2
s
sfr
D
p
I
(15)
Shear viscosity of particle (µ
s,col
), p
s
shows the
particle pressure, ɸ shows the inner shear angle, and
I
2D
shows both variation from stress tensor deviator.
Particle pressure, ps, is determined as follows
2
0,
21
s
sss s ssssss
peg
(16)
Particle pressure (solid pressure) or termed as
kinetic time (α
s
ρ
s
θ
s
) while
2
0,
21
s
ss s ss s
eg
stated the particle
collision effect. On the granular flow case, particle
pressure can be calculated separately (itself). e
ss
as
restitution coefficient for particle which collide,
while
0,
s
s
g
as function of radial distribution and can
be written as follows
1
1/3
0,
,
1
s
ss
smax
g
(17)
Viscosity of solids, λ
s
, can be written
1/2
0,
4
1
3
s
s s s s ss ss
dg e
(18)
Solid viscosity (λ
s
) calculates resistance of
particle granules to tension and pressure. Diffusion
coefficient from particle temperature based on
Gidaspow’s drag model is
2
2
0, 0,
0,
150
6
112 1
384 1 5
ss s
s
s s ss ss s s s ss ss
ss ss
d
kgedge
eg
(19)
Energy equation is written as below
T
eff
eff j j h
f
t
E
vEp k hJ v S
(20)
Where k
eff
is the effective and combined of k + k
t
,
where k
t
is turbulent conductivity which is
determined on turbulent model. J
j
as diffusion flows
from object “j”. Equation on the right side shows
energy transfer in conduction, diffused object, and
dissipation of each viscosity. S
h
shows the heat
which occurs because of chemical reaction.
Heat transfer convection equation
1/ 4
1/ 2 2/3 0.4
2 0.4 0.06
sph
s
hD
Nu Re Re Pr
k
(21)
Where 3.5 ≤ Re ≤ 80.000 and 0.7 ≤ Pr ≤ 380.
Heating of particle based on time
()t
bt
i
TT
e
TT
(22)
Where
s
p
hA
b
VC
(23)
3 RESULT AND ANALYSIS
3.1 Validation with Previous Research
In this research, ANSYS fluent using 2D with 3
boundary condition, that is the inlet, outlet, and the
wall is used. Be height shows how tall or vast will
be modeled as a particle (solid) which has material
properties and operating parameter as shown in
Table 1. The first step, drawing the geometry in
ANSYS Fluent, as shown in Figure 1.
CFD program do analysis on obsject by deviding
the volume into small parts (mesh), meshing process
is shown below.
Investigating the Effect of Inlet Velocity on Temperature Distribution and Solid Volume Fraction in Fluidized Bed Dryer using CFD
23
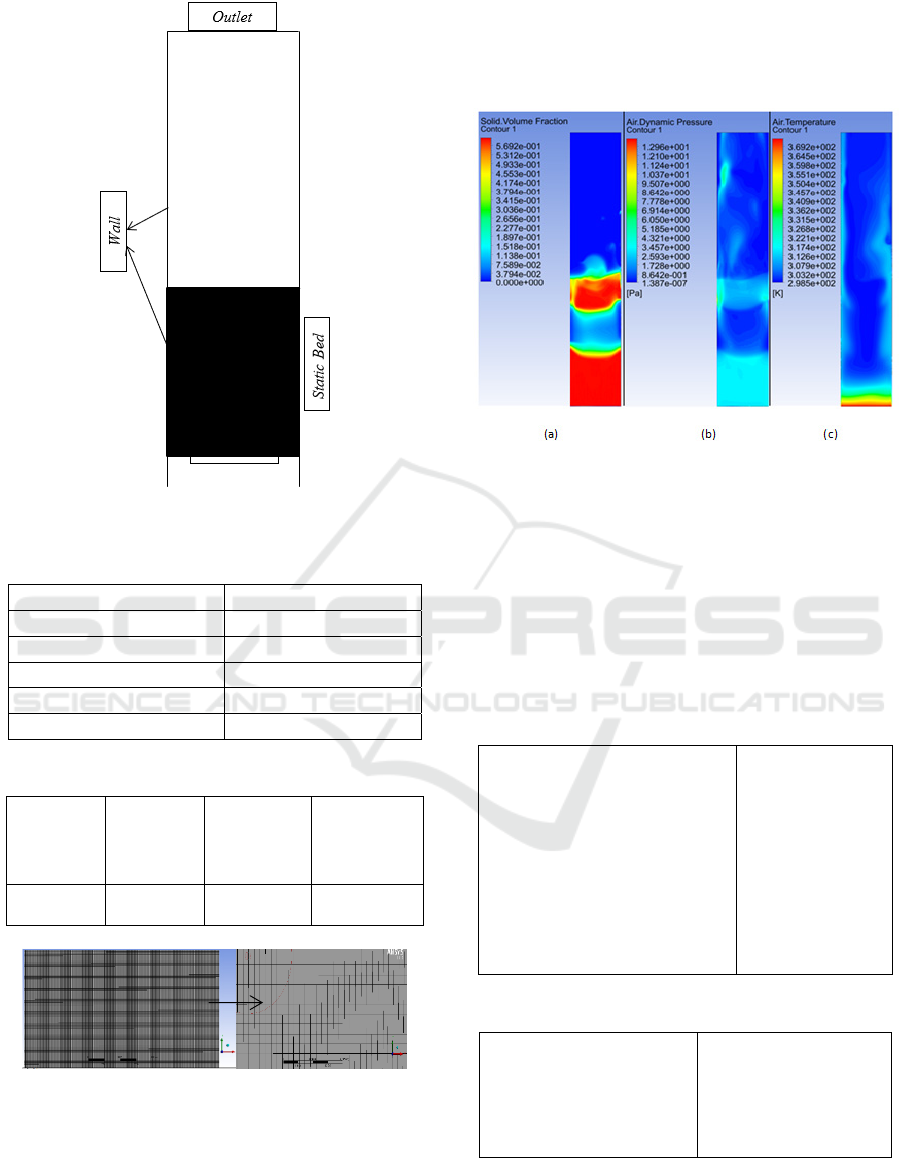
Figure 1: Fluidized bed dryer sketch.
Table 1: Operational Condition.
Parameter value
Bed height 500 mm
Bed widht 90 mm
Static bed height 176 mm
Bed thickness 24 mm
Time step 10
-4
s
Table 2: Mesh details.
Number of
divisons
Skewnees
Max
Skewnees
Max
Skewnees
on Fluent
400x800 7.75E-004 1.77E-003 0.85
Figure 2: Generating mesh.
Geometry manufacture and mesh processing is the
pre-processing stage. In the processing, the stage is
using the Fluent software.a Set-up or variable value
uses set-up according to the previous research (Ngoh
and Lim, 2016). In post-processing stage is getting
the result of temperature distribution result and
fluidization effect on fluidized bed dryer. Fig 3a, 3b,
and 3c show the fluidization effect, air dynamic
pressure, and air temperature distribution.
Figure 3: Contour of (a) Solid volume fraction, (b)
Dynamics pressure, dan (c) Air temperature distribution.
Fluidization and heat transfer can be seen from
solid volume fraction and temperature distribution
by using Eulerian-eulerian model. Fig 3 shows
temperature distribution which can be seen at low
part (approaching inlet) has the temperature at
100
o
C, this is in corresponding to the simulation
previously (Ngoh and Lim, 2016).
Table 3: Material properties.
Particle density, ρ
p
Gas density, ρ
g
Initial solid packing, e
s0
Particle diameter, d
p
Superficial gas velocity, U
Gas temperature fluidization, T
f
Initial particle temperature, T
p
Particle thermal conductivity, k
p
Particle specific heat, c
p
Air thermal conductivity, k
g
Air specific heat, c
g
640 kg/m
3
1.225 kg/m
3
0.6
5 mm
1.152-1.728 m/s
130
o
C
25
o
C
0.17 W/(m K)
1780 J/(kg K)
0.0242 W/(m K)
1006.43 J/(kg K)
Table 4: Simulation settings.
Time step
Number of iteration
Multiphase
Pressure
Momentum
Turbulent
10
-4
s
30000
Eularian-eularian
SIMPLE
First order upwind
K-omega
Simulation result which interpreted as
temperature distribution chart can be seen in Fig 4.
Charts from the simulation are compared with
EIC 2018 - The 7th Engineering International Conference (EIC), Engineering International Conference on Education, Concept and
Application on Green Technology
24
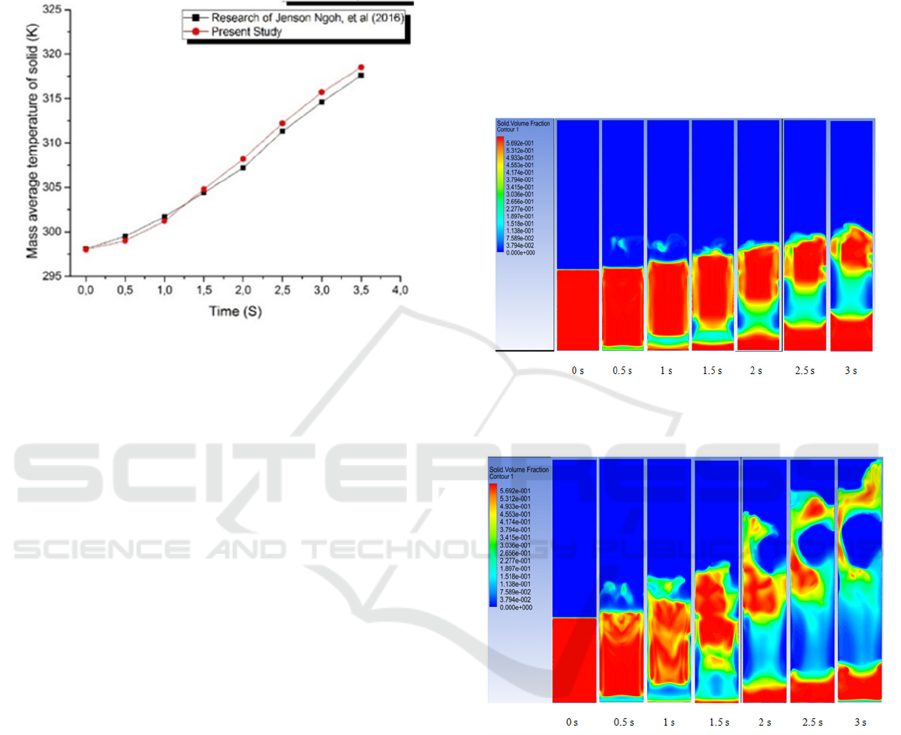
reference paper. From the compared result which
has done is got the average error 0.67625%, with the
highest and the lowest value is 1.226% and 0.033%
respectively. An error got from validation is under
10%, then the method can be applied in this
research.
Figure 4: Particle average temperature vs fluidization time
chart.
3.2 Gas Inlet Velocity Effect
Heat transfer which occurs on fluidization effect can
be investigated with different operation condi-tions,
the simulation is done repeatedly by varying inlet air
velocity as well as the keeping of operation
parameters and constant material proper-ties. The
fluidized bed is heated by flowing hot air constantly
at temperature 130 oC and particle initial
temperature is 25 oC. Particle size used is 5 mm and
the air velocity used is 1.152 m/s, 1.536 m/s, dan
1.728 m/s.
Analyses were done on solid volume fraction
profile, temperature profile, and velocity profile
explain the heat transfer that occurred. Figure 5
shows solid volume fraction contour (solid volume
fraction) at a velocity of 1.152 m/s, where air
bubblethat is formed is lifting the particle (bed) as
initial fluidization’s step.
Particle concentration at the bottom tends to lift
uniformly, this thing indicates gas inlet velocity
uniform according to the characteristic of a fluidized
bed dryer. Contour profile of solid volume fraction
showing bubble which created near the bottom has
the smaller size and will get bigger as it moves
upward as seen in the second 1.5s to 2s, this
statement corresponds to simulation (Ngoh and Lim,
2016). The contour profile shows that the particle
tends to fix and will move downward again when
gas inlet velocity is small as shown at time 2s. The
solid particle will have a good heat transfer when
they contact each other. However, in the case of a
fluidized bed dryer, the convection heat transfer
more concerned than conduction heat transfer. This
research is done to analyze optimum velocity that
makes a particle of tea which later undergoes a
drying process with fluidiszed bed dryer does not
leap out of the fluidized bed chamber. Figure 6 and
figure 7 show the velocity contour profile at 1.536
m/s and 1.728 m/s.
Figure 5: Contour of solid volume fraction at velocity
1.152 m/s.
Figure 6: Velocity contour of solid volume fraction
velocity at 1.536 m/s.
Figure 6 shows inlet velocity variation at 1.536
m/s. Compared to the velocity at 1.152 m/s as shown
at Figure 5, it shows that the increasing of velocity
makes the bubble which produced becomes bigger
and so does separation effect, this phenomenon be
seen at time 1s. From Figure 6, it is seen that the
contour at 2s shows the particle moving downward,
but the bubble will begin to reform at a time 3s. At
3s, it shows that the particle got the highest point of
the chamber, this is not same as the purpose of
research, where it was originally intend to get
optimum velocity so that the particle does not leap
Investigating the Effect of Inlet Velocity on Temperature Distribution and Solid Volume Fraction in Fluidized Bed Dryer using CFD
25
out of the chamber. In Figure 7, it shows the
variation speed at 1.728 m/s, from the figure, it can
be seen that the particle is steady until 3s when
comparing with previous speed and the particles that
come back down look less than the previous speed.
Figure 7: Velocity contour of solid volume fraction at
1.728 m/s.
(Bahu, 1997), his book, explaining, basically, the
increasing of gas inlet velocity that occurs on
fluidized bed dryer was causing an increase in
pressure drop (∆Pb) and it is linear with gas velocity
(u). In particular gas velocity, it is called as the
optimum velocity of fluidization (umf), and pressure
drop along with object area (particles) would be
equi-valent to the weight of particles per area
(∆Pmf). The particle at this condition will fly out
freely and it will begin to expand as shown in figure
7 (Bahu, 1997).
Figure 8: Velocity contour of solid volume fraction at 1.8
m/s.
The contour at 1.8 m/s shows that there is a high
enough fluctuation at 2s, and it increases until 3s.
Tea particles at 3s reach the highest point of the
chamber and make the possibility of the particle to
leap out of the chamber, although in this velocity
does not any precipitation of the particles at the
bottom of the chamber.
3.3 Temperature Distribution
Temperature distribution and heat transfer effect on
the particle can be seen from gas inlet velocity and
gas temperature distribution, which will have an
effect on particle temperature. Gas inlet velocity will
influence particles speed and vector speed of the
particle. The small gas inlet speed will cause the
vector speed of the particles becomes low, the low
speed of the particles makes the convection heat
transfer becomes slow.
Figure 9: Contour of gas velocity (a) 1.152 m/s, (b)
1.536 m/s, dan (c) 1.728 m/s
.
Figure 10: Contour of particle temperature (a) 1.152 m/s,
(b) 1.536 m/s, dan (c) 1.728 m/s.
Figure 9.c which velocity at 1.728 m/s shows
the gas velocity value of particle 4.568 m/s, where it
is higher than gas velocity on the particle with inlet
velocity 1.152 m/s and 1.536 m/s. This value shows
that the gas velocity is linear with velocity vector of
particle. Figure 9.c has a high particle velocity
vector, so it causes good convection heat transfer.
This result is proportional to contour of temperature
distribution of particle, it is seen at Figure 10.
EIC 2018 - The 7th Engineering International Conference (EIC), Engineering International Conference on Education, Concept and
Application on Green Technology
26
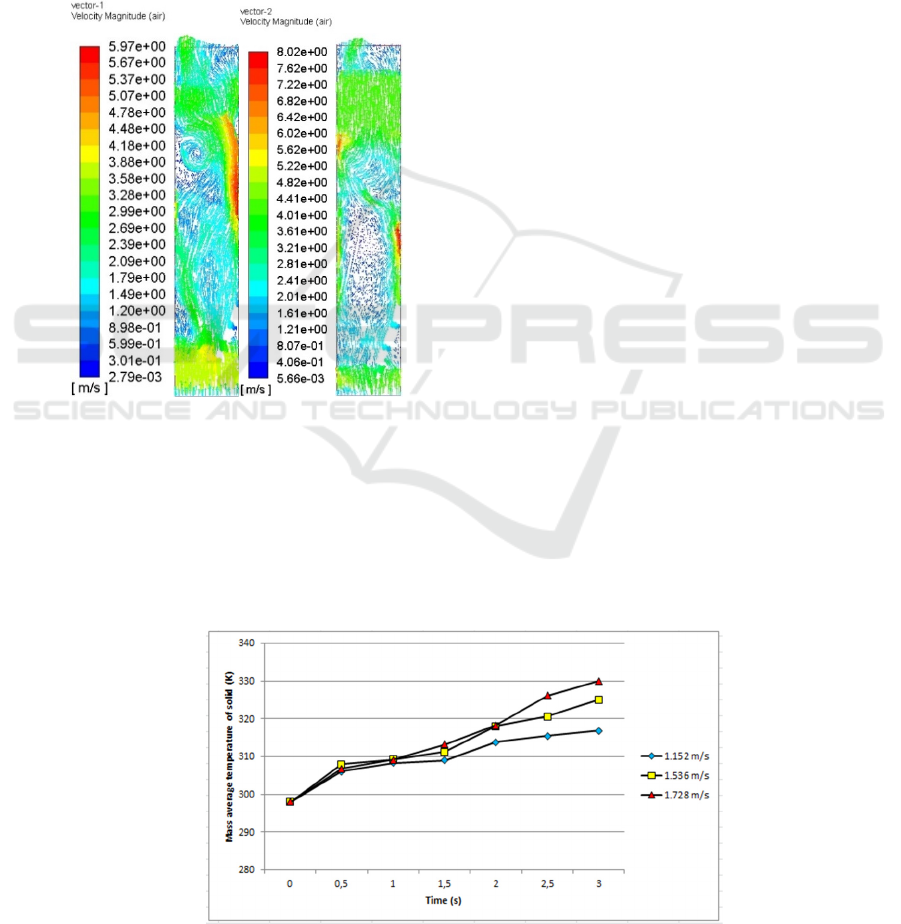
Figure 10 shows contour of particle
temperature with variation speed at 3s. At Figure 10,
the increasing of temperature is proportional to its
velocity, but the temperature distribution at 1.728
m/s looks more evenly. The uniform of temperature
distribution is in accordance with opinion of (Ngoh
and Lim, 2016). which says that the higher particle
velocity vector, the better convection heat
transfer.convection heat transfer in simulation can be
seen from its gas velocity vector. Figure 11 shows
gas velocity vector at 1.536 m/s and 1.728 m/s at
time 3s.
(a) (b)
Figure 11: Velocity vector at (a) 1.536 m/s and (b) z1.728
m/s.
Convection heat transfer is strongly
influencedby velocity fluid flows when passing or
pounding an object. Figure 11 shows gas velocity
vector when passing the tea particle, Figure 11.b
shows velocity vector which is passing the tea
particle is bigger than that velocity vector that
happens on the particle, Figure 11.b shows the
velocity vector passing the particle is bigger than the
velocity vector at Figure 11.a. The value of the
velocity vector when passing the particle will
influence the heat transfer happening on the particle.
The higher velocity vector, the better heat
transfer, because the higher velocity vector passing
the particle then the higher Nusselt number of the
fluid. Optimum velocity at 1.728 m/s has the highest
Nusselt number 10.5 (equation 21). Nusselt number
influence the convection heat transfer coefficient
value which is linear with the convection heat
transfer value (Cengel, 2003).
Figure 12 shows the temperature distribution
chart with various velocity from 0s to 3s and
increase of gas inlet velocity will influence the
particle average temperature. The increasing of
temperature is influenced by Nusselt number, and
Figure 12 shows that longer fluidization time, the
higher temperature (Cengel, 2004) mentioned that
heat transfer on the object along time “t” is same as
the energy increase on the object along time “t”
(equation 22) (Cengel, 2004).
4 CONCLUSIONS
Analysis of fluidization effect and heat transfer on
this research is using software Computational Fluid
Dynamics (CFD). Simulation is done by varying of
gas inlet velocity at 1.152 m/s, 1.536 m/s, 1.728 m/s
and 1.8 m/s and keeping the temperature operation
constant at 130 oC to determine optimum
fluidization velocity and optimum temperature
distribution velocity. The results show that optimum
fluidization velocity by assuming no tea particle leap
out from the chamber is 1.728 m/s, it is seen in
Figure 7. Heat transfer becomes one of the essential
Figure12: Particle average temperature vs fluidization time with various velocity chart.
Investigating the Effect of Inlet Velocity on Temperature Distribution and Solid Volume Fraction in Fluidized Bed Dryer using CFD
27

things of a fluidized bed dryer because the key of
drying is the heat transfer. The heat transfer that
occurs is convection heat transfer. According to the
simulation, convection heat transfer can be seen
from the particle velocity vector, it means the
optimum heat transfer occurring at 1.728 m/s. The
optimum heat transfer is proven by the contour of
the temperature distribution of the particle (Figure
10), the optimum temperature distribution is
influenced by gas inlet velocity which is linear
particle velocity vector. Particle temperature
distribution is increased linearly with the gas inlet.
And it is proven by Nusselt number with a value
10.5 at optimum velocity 1.728 m/s affection
convection heat transfer, it is seen at temperature
distribution chart (Figure 12).
REFERENCES
Bahu, R. E., 1997. Fluidized bed dryers. Industrial Drying
of Foods, pp.65-88.
Cengel, Y. A. 2003. Heat Transfer: A Practical Approach,
2
nd
Ed. McGraw-Hill. Boston.
Gidaspow, D. 1994. Multiphase Flow and Fluidization:
Continuum and Kinetic Theory Descriptions. Boston,
USA: Academic Press.
Ngoh, J. & Lim, E. W. C., 2016. Effects of particle size
and bubbling behavior on heat transfer in gas fluidized
beds. Applied Thermal Engineering, 105, pp.225-242.
Phillips, D. H., 1999. Polycyclic aromatic hydrocarbons in
the diet. Mutation Research/Genetic Toxicology and
Environmental Mutagenesis, 443(1), pp.139-147.
Sudjarmoko, B. 2014. Perkembangan Pasar Teh
Indonesia Di Pasar Domestik Dan Pasar
Internasional. Badan Penelitian Tanaman Industri dan
Penyegar Kementrian Pertanian.
Versteeg, H. K. & Malalasekera, W., 2007. An
introduction to computational fluid dynamics: the
finite volume method. Pearson Education.
EIC 2018 - The 7th Engineering International Conference (EIC), Engineering International Conference on Education, Concept and
Application on Green Technology
28
