
Analysis of Influencing Factors of IPO Under-pricing: Case Studies
on Companies Listing in IDX during 2008-2017
Meigia Nidya Sari, Erlina and Rina Bukit
Department of Master of Accounting, Faculty of Economics and Business, University of Sumatera Utara, Indonesia
Keywords: Under-Pricing, Financial Ratio, Non-Financial Information.
Abstract: Under-pricing is a price below the market price or stock price in the secondary market higher than the stock
price in the primary market in which investors are interested in purchasing. Under-pricing is influenced by
several factors, such as company size, return on asset, financial leverage, and percentage of public offering,
trading volume, auditor reputation, company age, and industrial type to under-pricing during the IPO in the
Indonesia Stock Exchange. 130 samples of companies were used. The technical of collecting samples using
senses. The data analyzed using multiple linear regressions. Based on the results of data analysis, trading
volume and auditor reputation had significantly negative effect on under-pricing, while financial leverage
had significantly positive affect on u//under-pricing, while company size, company age, industrial type had
insignificantly negative affect on under-pricing, and percentage of public offering had insignificantly
positive affect on under-pricing.
1 INTRODUCTION
Initial Public Offering (IPO) becomes good
alternative way for company to get funding.
However, there are times when it is difficult to
determine the initial stock price at the IPO. Because
many considerations must be made in determining
the price between the issuer and underwriter, while
the stock price sold in secondary market will be
determined by market mechanism depend on supply
and demand. The difficulty of determining initial
stock price is due to the absence of relevant
information. The limited information about what and
who the company will do an initial public offering
make underwriters and potential investors should
perform a good analysis before deciding to buy or to
order the stock (Hatta, 2010).
The determination of the stock price to be
offered at the IPO is an important factor as it relates
to the amount of funds that the issuer will receive
and the risk that the underwriter will bear. The
amount of funds received by the issuer is the
multiplication between the numbers of shares
offered at the price per share, so the greater the price
per share, the higher the funds will be obtained.
PT. Krakatau Steel (Persero) Tbk conducted an
IPO in 2010 by releasing 3,155,000,000 shares of
public shares and listing them on the Indonesia
Stock Exchange. Initial shares offered through the
book building process (initial offer) recorded a
demand surplus of 9 times. Share ownership of PT.
Krakatau Steel after the IPO is divided into 80%
owned by the Government of the Republic of
Indonesia, and the remaining 20% will be owned by
the public. In this offer, the Company appointed PT.
Bahana Securities, PT. DanareksaSekuritas, and PT.
MandiriSekuritas as the underwriters. The IPO
implementation price is set at Rp. 850 per share or
acquisition of IPO fund is set at Rp. 2.681 trillion.
Such a price is the cause of controversy in the public
regarding the initial stock price offered whether it is
relatively appropriate or reasonable with the current
condition of the company. PT. Krakatau Steel
became one of the companies that experienced
under-pricing post IPO that is from the price
determination of Rp. 850 per share immediately
skyrocketed to the level of Rp. 1,200 per share that
is up about 40% more, whereas the funds absorbed
should be more than Rp. 2.681 trillion (Purwoko,
2010).
452
Sari, M., Erlina, . and Bukit, R.
Analysis of Influencing Factors of IPO Under-pricing: Case Studies on Companies Listing in IDX during 2008-2017.
DOI: 10.5220/0008888904520458
In Proceedings of the 7th International Conference on Multidisciplinary Research (ICMR 2018) - , pages 452-458
ISBN: 978-989-758-437-4
Copyright
c
2020 by SCITEPRESS – Science and Technology Publications, Lda. All rights reserved

2 PREVIOUS RESEARCH
REVIEW
The first research conducted by Islam et al (2010).
The results of this study indicated that Variable
percentage capacity for public offering, company
size, and industrial type has a significant negative
effect on under-pricing at the level, while company
age variable has a positive effect on under-pricing.
The second research conducted by (Saurabh
Ghosh, 2005) showed that the variable size of the
size does not affect the under-pricing, while the
company age, company size, and industrial type
variables have a significant negative effect on under-
pricing.
The third study conducted by (How et al., 1995)
showed All independent variables ie Company Age,
offer size, listing time, and reputation of underwriter
Negatively significant effect on under-pricing.
The fourth research conducted by (Kim et al.,
1993) showed the variable of Financial Leverage
and Ownership Retention have positive effect on
under-pricing while Investment, underwriter quality,
ROA, and Gross Proceeds have positive effect on
Under-pricing.
The fifth research conducted by Mega Gunawan
and Viriany Jordin (2015) showed that ROA
variable and company size have a significant effect
on under-pricing level, while DER, EPS, company
age and percentage of shares offered to public have
no significant effect on under-pricing level.
The sixth study of the research conducted by
Shoviyah Nur Aini (2013) showed that ROE
variable, company size, company age, underwriter
reputation, and IPO fund use for investment have no
effect on under-pricing, while auditor reputation
variable has significant negative effect on under-
pricing
The seventh research conducted by (Reza
Widhar Pahlevi, 2014) showed Variable Reputation
underwriter, auditor's reputation has no significant
effect on under-pricing, while the variable leverage
has positive influence on under-pricing, while ROA,
NPM, Current ratio, company size, and company's
age have a significant negative effect on under-
pricing.
The eighth research conducted by (Hapsari and
Kholiq Mahfud, 2012) showed Variable Reputation
underwriter, auditor reputation, ROE, company size
has a significant negative effect on under-pricing,
while current ratio variable and EPS has no effect on
under-pricing.
The ninth research conducted by (Lismawati
Munawaroh, 2015) showed that underwriter
Reputation variable and company's age have no
effect on under-pricing level, while company
profitability variable (ROA), and company size have
significant negative effect to under-pricing level,
while Financial leverage (DER) against under-
pricing.
The tenth research conducted by (I Dewa Ayu
Kristiantari, 2012) showed that underwriter
reputation variable, company size, purpose of
investment fund use negatively affect under-pricing,
while auditor reputation variable, company age,
company profitability, financial leverage, and
industry type have no effect on under-pricing.
Based on the description previously described,
the hypothesis of this penetration are: company size,
financial leverage, Percentage of public offering,
trading volume partially or simultaneously effect on
under-pricing of shares at initial public offering in
Indonesia Stock Exchange.
3 RESEARCH METHOD
This is a causal associative research with the
characteristics of the problem of causality between
two variables or more. From the type of data used in
this study is quantitative research, quantitative
research methods aimed at researching on a
particular population or sample, data collection
using research instruments, quantitative / statistical
data analysis, with the aim to test the predefined
hypothesis (Ghozali, 2013)
3.1 Population and Sample
This research took the population of companies
conducted IPO on BEI from 2008-2017 who under-
priced with saturated or census sampled technique so
that obtained as many as 130 companies that
experienced under-pricing during that period as
population and the amount also used as sample.
3.2 Data Analysis Technique
Data analysis technique used is multiple linear
regression analysis. Tests conducted are: Descriptive
Statistics, Classic Assumption Test, namely the
Normality Test, Multicolinearity Test,
Heteroskedastisitas Test and Autocorrelation Test.
Hypothesis Testing with Test t (Partial Test) and
Test F (Simultaneous Test), Determination
Coefficient Analysis and Multiple Linear regression
Analysis.
Analysis of Influencing Factors of IPO Under-pricing: Case Studies on Companies Listing in IDX during 2008-2017
453

4 RESULTS AND DISCUSSIONS
4.1 Descriptive Statistics Analysis
Descriptive statistical analysis is used to find out the
description of a data viewed from the value of the
distribution of frequency and percentage, as well as
the maximum, minimum, and mean value, of the
Company Size, ROA, Financial Leverage,
Percentage of Public Shares Offer, Trade Volume,
Auditor Reputation, Age of Company, Industry
Type, and Under-pricing.
Table 1: Descriptive Statistics of Independent and
Dependent Variable.
N
Min
Max
Mean
Std. Dev
Size
(X1)
130
8.99
17.62
13.8749
1.52097
ROA
(X2)
130
0.72
3.11
1.3753
.33573
FL
(X3)
130
1.00
1.43
1.0612
.06760
PPO
(X4)
130
1.02
91.00
24.5727
14.24606
Vol
(X5)
130
7.31
26.24
19.2514
3.65568
AR
(X6)
130
.00
1.00
.2692
.44528
Age
(X7)
130
1.00
60.00
18.8154
13.3717
Type
(X8)
130
.00
1.00
.3462
.47758
Up (Y)
130
.00
.70
.3368
.25371
Valid
N
130
According to Table 1, it is known that the
average value of company size is 13.8749 and the
standard deviation of the company size is 1.52097.
While the minimum value of the size of the
company is 8.99 derived from the issuer of BSIM
(Bank Sinarmas, Tbk) and the maximum value of
the size of the company is 17.62 derived from
BBTN issuer (Bank Tabungan Negara, Tbk).
The average value of ROA is 1.3753 and the
value the standard deviation of ROA is 0.33573.
While the minimum value of ROA is 0.72 from the
issuer of BAEK (Bank Ekonomi, Tbk) and the
maximum value of ROA is 3.11 from NIRO
(Nirvana Development, Tbk) issuer. The average
value of financial leverage is 1.0612 and the
standard deviation value of financial leverage is
0.06760. While the minimum value of financial
leverage is 1.00 derived from the issuer of BRMS
(Bumi Resources Minerals, Tbk) and the maximum
value of financial leverage is 1.43 obtained from
issuer MINA (Sanurhasta Mitra, Tbk).
The average value of percentage of public
offering is 24,5727 and the standard deviation value
of percentage of public offering is 14.24606. While
the minimum value of percentage of public offering
percentage is 1.02 obtained from MAPB issuer
(MAP Boga Adiperkasa, Tbk) and the maximum
value of percentage public offering is 91 obtained
from IBFN issuer (Intan Baruprana Finance, Tbk).
The average value of trading volume is 19.2514
and the standard deviation of trading volume is
3.65568. While the minimum value of trading
volume is 7.31 obtained from NASA (Ayana Land
International, Tbk) and the maximum value of
trading volume is 26.24 obtained from IBST issuer
(Inti Bangun Sejahtera, Tbk).
The average value of the auditor's reputation is
0.2692 and the standard deviation value of the
auditor's reputation is 0.44528. While the minimum
value of the auditor's reputation is 0 obtained from
firms audited by other than the Big Four KAP and
the maximum value of the auditor's reputation is 1
obtained from firms audited by the Big Four KAP.
The average value of the company's age is
18.8154 and the standard deviation of the company's
age is 13.37172. While the minimum value of
company's age is 1 obtained from ICBP issuer
(Indofood CBP Sukses Makmur, Tbk) and the
maximum value of company's age is 60 obtained
from BJBR issuer (Bank Jawa Barat, Tbk).
The average value of the industry type is 0.3462
and the standard deviation value of the industry type
is 0.47758. While the minimum value of the type of
industry is 0 obtained from non-manufacturing
companies and the maximum value of the type of
industry is 1 obtained from the manufacturing
companies.
The average value of under-pricing is 0.3368 and
the standard deviation of under-pricing is 1.01042.
The minimum value of under-pricing is 0.00
obtained from POWR issuer (Cikarang Listrindo,
Tbk) and the maximum value of under-pricing is
0.70 obtained from MPOW (Mega Power Makmur,
Tbk) issuer.
ICMR 2018 - International Conference on Multidisciplinary Research
454
4.2 Classic Assumption Test
4.2.1 Normality Test
The normality test aims to test whether in the
regression model, the intruder or residual variable
has a normal distribution. Test t and F assume that
the residual values follow the normal distribution.
In this study, the normality test for residuals using
the Kolmogorov-Smirnov test. Level of
significance used α = 0.05. The basis for the
decision is to look at the probability p, with the
following conditions:
If the probability value p ˃ 0.05, then the
assumption of normality is met
Then Hois accepted, Ha is rejected.
If the probability is <0.05, then the assumption
of normality is not met
Then Ho is rejected, Ha accepted.
Table 2: Normality Test.
One-Sample Kolmogorov-Smirnov Test.
Unstandardized
Residual
N
130
Normal
Parameters
a,,b
Mean
.0000000
Std. Deviation
.97144095
Most Extreme
Differences
Absolute
.051
Positive
.040
Negative
-.051
Kolmogorov-Smirnov Z
.582
Asymp. Sig. (2-tailed)
.887
a. Test distribution is Normal.
b. Calculated from data.
Note that according to Table 2, the probability
value or Asymp is known. Sig. (2-tailed) of 0.887.
If the probability value, ie 0.887, is greater than the
level of significance, ie 0.05, the assumption of
normality is met.
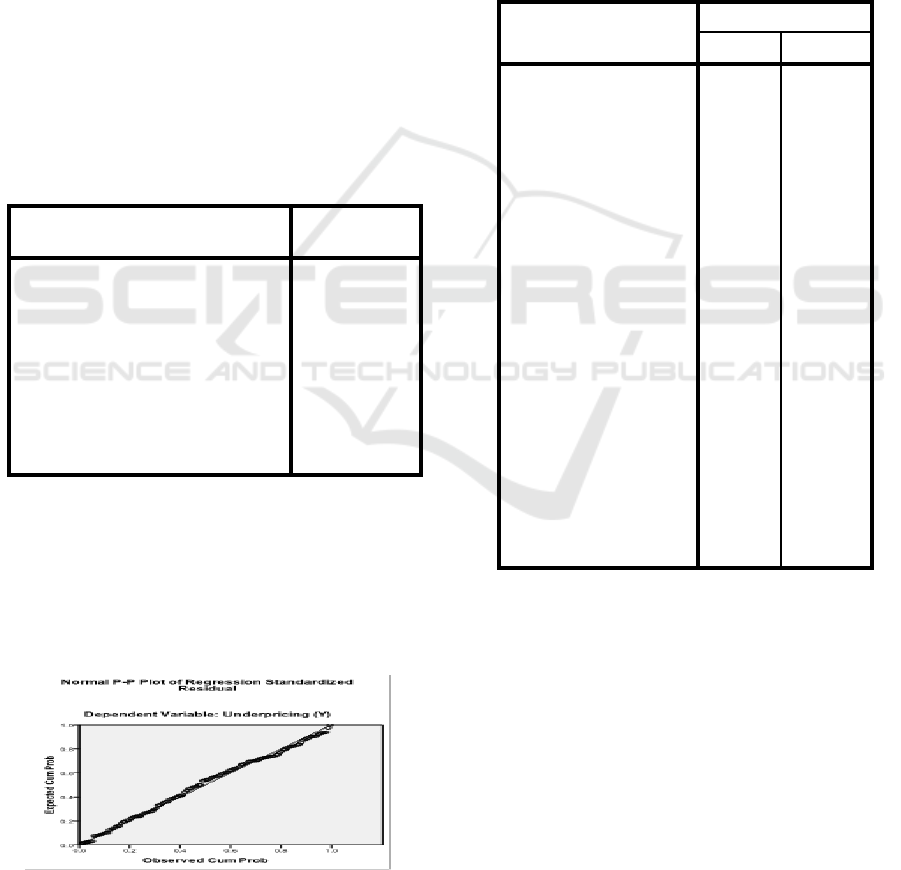
Figure 1: Normality Test with Normal Probability Plot
Approach.
Based on the normality test with the normal
probability plot approach (Figure 1), the points
spread quite closely to the diagonal lines. This
indicates the assumption of normality is met.
4.2.2 Multicollinearity
To check whether there is multi co linearity or not
cannot be seen from the value of variance inflation
factor (VIF). VIF values of more than 10 indicated
an independent variable of multicolinearity
(Ghozali, 2013).
Table 3: Multicollinearity Test.
Model
Collinearity Statistics
Tolerance
VIF
1
(Constant)
Ukuran
Perusahaan
(X1)
.733
1.365
ROA (X2)
.874
1.144
Financial
Leverage (X3)
.787
1.271
PersentasePen
awaranSaham
Publik (X4)
.937
1.067
Volume
Perdagangan
(X5)
.886
1.128
Reputasi
Auditor (X6)
.847
1.180
Umur
Perusahaan
(X7)
.857
1.167
JenisIndustri
(X8)
.891
1.122
Based on Table 2, it is known that all VIF
values are not more than 10 or all VIF values <10,
and the tolerance value is not less than 0.1 then the
indication does not occur multicollinearity or in
other words accept Ho and reject Ha.
4.2.3 Heteroscedasticity Test
The heteroscedasticity test according to Ghozali
(2011: 139) aims to test whether in a regression
model the residual variance inequality varies from
one observation to another fixed, heteroscedasticity.
The way used to detect the presence or absence of
heteroscedasticity in this study by looking at the plot
Analysis of Influencing Factors of IPO Under-pricing: Case Studies on Companies Listing in IDX during 2008-2017
455
graph between the predicted value of dependent
variable (ZPRED) with residually is SRESID. The
detection of whether or not heteroscedasticity can be
done by looking at the presence of a particular
pattern on the scatterplot chart between SRESID and
ZPRED where the Y axis is predicted and the X axis
is the residual (Y-predicted Y). The basic analysis
used to detect heteroscedasticity:
If there is a certain pattern, such as the existing
dots form a certain pattern that is regular (wavy,
widened then narrowed), then indicates there has
been heteroscedasticity.
If there is no clear pattern, and the points spread
above and below the number 0 on the Y axis, there
is no heteroscedasticity.
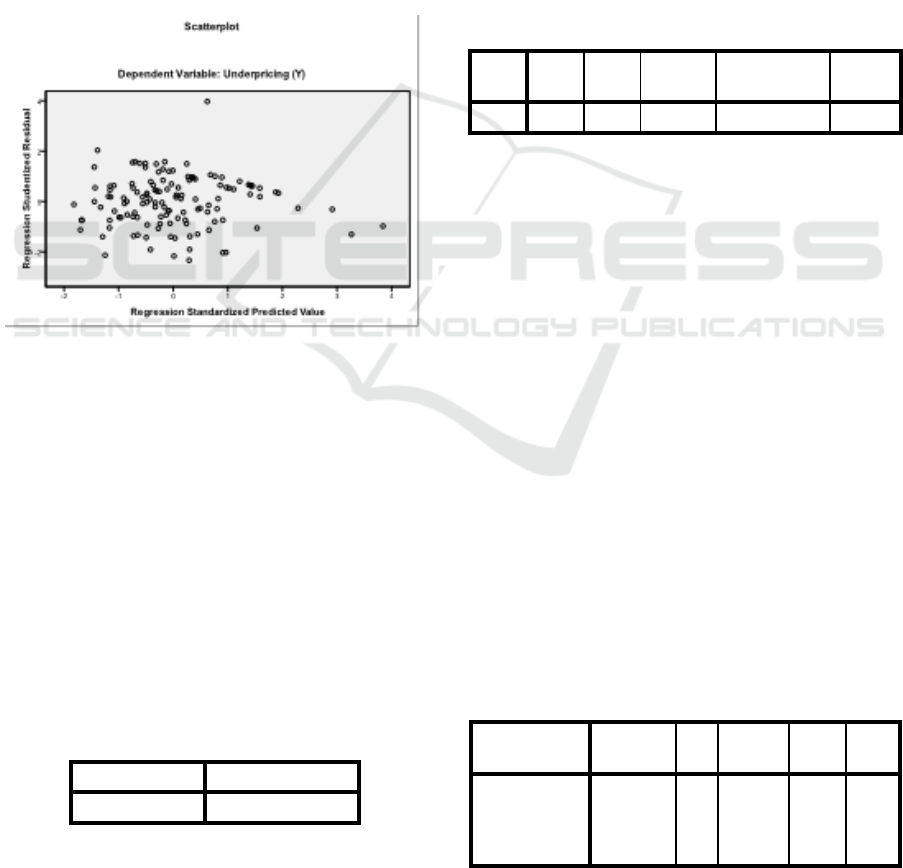
The results of the heteroscedasticity test shown
in Figure 2:
Figure 2: Heteroscedasticity Test.
Note that according to Figure 2, there is no clear
pattern, and the points spread above and below the
number 0 on the Y axis, hence no heteroscedasticity.
4.2.5 Autocorrelation Test
Assumptions about residual independence (non-
autocorrelation) can be tested using the Durbin-
Watson test (Field, 2009). The statistical value of the
Durbin-Watson test ranges between 0 and 4. The
statistical value of the Durbin-Watson test that is
smaller than 1 or greater than 3 indicates an
autocorrelation.
Table 4: Autocorrelation Test.
Model
Durbin-Watson
1
1.798
According to Table 4, the value of the Durbin-
Watson statistic is 1.798. Note that since the Durbin-
Watson statistic value lies between 1 and 3, the non-
autocorrelation assumption is met. In other words,
there is no high autocorrelation symptoms in the
residual, then accept Ho and reject Ha.
4.2.4 Coefficient of Determination Analysis
The coefficient of determination (R²) is a value
(value of proportion) which measures how much the
ability of the independent variables used in the
regression equation, in explaining the variation of
the dependent variable.
Table 5: Coefficient of Determination.
Model Summary
b
.
Model
R
R
Square
Adjusted
R Square
Std. Error of
the Estimate
Durbin-
Watson
1
.521
a
.272
.224
1.00304
1.798
a. Predictors: (Constant), Industrial type (X8), Persentage
of public offering (X4), Financial Leverage (X3), ROA
(X2), Auditor reputation (X6), Trading volume (X5),
Company age (X7), Company size (X1)
b. Dependent Variable: Under-pricing (Y)
Based on Table 5, the coefficient of
determination value R² lies in the R-Square column.
It is known that the coefficient of determination is
R2 = 0.272. The value means all independent
variables, ie company size, ROA, financial leverage,
percentage of public offering, trading volume,
auditor reputation, company age, and industry type
can explain the effect of under-pricing variable by
27.2%, the rest of 72.8% influenced by other factors.
4.2.6 Significance of Simultaneous Effect
Test (F test)
F test aims to examine the effect of free variables
simultaneously or simultaneously to the dependent
variable.
Table 6: Significance of Simultaneous Effect Test (F test).
ANOVA
b
.
Model
Sum of
Squares
Df
Mean
Square
F
Sig.
1
Regression
45.445
8
5.681
5.646
.000
a
Residual
121.737
121
1.006
Total
167.182
129
ICMR 2018 - International Conference on Multidisciplinary Research
456

a. Predictors: (Constant), Industrial type (X8), Persentage
of public offering (X4), Financial Leverage (X3), ROA
(X2), Auditor reputation (X6), Trading volume (X5),
Company age (X7), Company size (X1)
b. Dependent Variable: Under-pricing (Y)
Based on Table 6, it is known that F count is
5,646 and Sig ,000 because the value of F arithmetic
is 5,646> F table 2.015 and the value of Sig 0,000
<0,05.
Hence company size, ROA, financial leverage,
percentage of public offering, trading volume,
auditor reputation, company age, and industry type
have a significant effect on under-pricing.
4.2.7 Multiple Linear Regression Analysis
and Partial Effect Significance t Test
Table 7 below presents the regression coefficient
value, as well as the statistical value t for partial
effect test.
Table 7: Multiple Linear Regression Analysis and Partial
Effect Significance t Test.
Coefficients.
Model
T
Sig.
1
(Constant)
1.349
.180
Company Size(X1)
-.680
.498
ROA (X2)
.050
.960
Financial Leverage (X3)
2.492
.014
Percentage of Public
Offering(X4)
.744
.459
Trading Volume (X5)
-3.615
.000
Auditor Reputation (X6)
-2.339
.021
Company Age (X7)
-.640
.523
Kinds of industry (X8)
-.102
.919
a. Dependent Variable: Under-pricing (Y)
Based on Table 7, multiple linear regression
equations are obtained as follows:
Y = 3,632 – 0,619X1 + 0,025X2 + 4,216X3 +
0,101X4 – 1,562X5 – 0,109X6 – 0,072X7 –
0,004X8 + e
Based on the multiple linear regression equation
above, it is known:
1. The regression coefficient value of company size
is -0.619 that is negative value. The value can be
interpreted company size negatively affect under-
pricing. Sig value of 0.498> 0,05 and t value | -0,680
| <t table | 1,979 |, then company size has no
significant effect on under-pricing.
2. The value of the regression coefficient of ROA is
0.025, which is positive. The value can be
interpreted ROA has a positive effect on under-
pricing. Sig value of 0.960> 0.05 and value of t
count | 0.050 | <t table | 1,979 |, then ROA has no
significant effect on under-pricing.
3. The regression coefficient value of financial
leverage is 4,216, which is positive. The value can
be interpreted financial leverage positive effect on
under-pricing. The Sig value is 0.014 <0.05 and the
value of t arithmetic | 2,492 | > t table | 1,979 |, then
financial leverage has a significant effect on under-
pricing.
4. The regression coefficient value of the percentage
of public share bid is 0.101, which is positive. The
value can be interpreted as percentage of public
offering positive effect on under-pricing. Given
value of Sig 0,459> 0,05 and t value count 0,744 | <t
table | 1,979 |, then the percentage of public offering
has no significant effect on under-pricing.
5. The value of the regression coefficient of trading
volume is -1.562, which is negative. The value can
be interpreted trading volume negatively affect
under-pricing. The value of Sig 0,000 <0,05 and t
value | -3,615 | > t table | 1,979 |, then trading
volume has a significant effect on under-pricing.
6. The regression coefficient value of the auditor's
reputation is -0.109, which is negative. The value
can be interpreted by the auditor's reputation
negatively affect under-pricing. Sig value of 0,021
<0.05 and value of t count | -2,339 | > t table | 1,979
|, then the auditor's reputation has a significant effect
on under-pricing.
7. The regression coefficient value of the company's
age is -0.072, which is negative. The value can be
interpreted the age of the company negatively affect
under-pricing. Given value of Sig 0,523> 0,05 and t
value count | -0,640 | <t table | 1,979 |, then the
company's age has no significant effect on under-
pricing.
8. The regression coefficient value of industry type
is -0.004 that is negative value. This value can be
interpreted by industry type negatively affecting
under-pricing. Given value of Sig 0,919> 0,05 and t
value count | -0,102 | <t table | 1,979 |, then the type
of industry has no significant effect on under-
pricing.
Analysis of Influencing Factors of IPO Under-pricing: Case Studies on Companies Listing in IDX during 2008-2017
457

5 CONCLUSIONS AND
SUGGESTIONS
5.1 Conclusions
From the results of research analysis and hypothesis
testing conducted earlier, it can be drawn conclusion
as follows:
1. Company size, return on asset, financial leverage,
percentage of public offering, trading volume,
auditor reputation, company age and industry
type simultaneously can influence the under-
pricing variable in the company IPO Indonesia
stock exchange for 2008 -2017 of 27.2%, the rest
of 72.8% influenced by other factors.
2. Company size return on asset, percentage of
public offering, company age and industrial type
partially have no significant effect on under-
pricing in companies with IPO in Indonesian
securities for the period of 2008-2017.
3. Company size has no significant negative effect
on under-pricing.
4. Return On Asset has no significant positive
effect on under-pricing.
5. Financial leverage has a significant positive
effect on under-pricing
6. Percentage of public offering has no significant
positive effect on under-pricing.
7. Trading volume has a significant negative effect
on under-pricing
8. Auditor reputation has a significant negative
effect on under-pricing
9. Company age has no significant negative effect
on underpricing.
10. Industrial type has no significant negative effect
on under-pricing.
5.2 Suggestions
The suggestions for the next research are:
1. For further research, it is better to use
independent variables other than independent
variables that have been used by researchers to
be more varied and developing.
2. Further research should increase the number of
samples for more accurate results.
3. Further research is to expand the source of
information and theory of international journals
for more quality research.
4. Further research must further modify variables
that have been widely used with non-financial
variables or other alternative information.
REFERENCES
Ghosh, Saurabh., 2005. Underpricing of Initial Public
Offering: The Indian Experience. International
Journal of Emerging Markets Finance and Trade. Vol.
41. No. 6.
Gunawan, Mega &Viriany., 2015.Faktor-Faktor yang
Mempengaruhi Tingkat Underpricing Saham Pada
Perusahaan Yang Melakukan IPO yang Terdaftar di
Bursa Efek Indonesia. Jurnal Ekonomi. Vol. XX. No.
02, Hal.174-192.
Hapsari, Venantia Anita & M. KholiqMahfud., 2012,
“Analisis Faktor-Faktor Yang Mempengaruhi
Underpricing Saham Pada Penawaran Umum”
Diponegoro Journal of Management, Vol. 1, No.1,
Hal. 1-9
How J. C H. Y Izan & G. S Monroe., 1995. Differential
Information and The Underpricing of IPO Australian
Evidence. International Journal of Accounting and
Finance. Vol. 8. No. 1.
Ghozali, Imam., 2013. Aplikasi Analisis Multivariate
dengan Program SPSS. Semarang, Badan Penerbit
UNDIP.
Hatta, A. J and Isfaatun., 2010. Analisis Informasi Penentu
Harga Saham Saat Intial Public Offering. Journal
Akuntansi Bisnis. Vol. 1.No. 15. Hal 66-74.
Islam, Aminul MD, Ruhani Ali & Zamri Ahmad., 2010.
An Empirical Investigation of The Underpricing of
Initial Public Offering in The Cittagong Stock
Exchange. International Journal of Economics and
Finance. Vol. 2.No. 4.
Katti, Supriya B.V. Phani., 2016, Underpricing of Initial
Public Offerings: A Literature Review. Universal
Journal of Accounting and Finance, Department of
Industrial and Management Engineering, Indian
Institute of Technology, India.
Kim, Joeng-Bon, Itzhak Krinsky & Jason Lee., 1995.
Motives for Going Public and Underpricing New
Findings from Korea. Journal of Business Finance
and Accounting. Vol. 20.No. 2.
Kristiantari, I dewa Ayu., 2012. Analisis Faktor-Faktor
yang Mempengaruhi Underpricing Saham Perdana di
BEI.T esis, Universitas Udayana, Denpasar.
Munawaroh, Lismawati., 2015. Faktor-Faktor yang
Mempengaruhi Underpricing Sahampada Penawaran
Umum Perdana di Bursa Efek Indonesia. Jurnal
Akuntansi & Bisnis. Vol 2. No 2.
Shoviyah, Nur Aini., 2013. Faktor-Faktor yang
Mempengaruhi Underpricing Pada Perusahaan IPO di
Bursa Efek Indonesia. Jurnal Ilmiah Manajemen. Vol.
1. No. 1.Hal.88-102.
Pahlevi, Reza Widhar., 2014. Analisis Faktor-Faktor yang
Mempengaruhi Underpricing Saham Pada Penawaran
Umum Perdana di BEI. Jurnal Siasat Bisnis. Vol. 18.
No. 2.
Purwoko, Krisman., 2010. Terlalu Murah Batalkan IPO
KrakatauSteel.https://republika.co.id/berita/breaking-
news/ekonomi/10/11/04/144256-bambang-soesatyo-
terlalu-murah-batalkan-ipo-krakatau-steel (Accessed
on 8, Juli 2017)
ICMR 2018 - International Conference on Multidisciplinary Research
458
