
Utilization of Waste Beef Cattle-corn as Formulation Material
in Compost Fertilizer Manufacturing
Muji Paramuji
Agricultural Product Engineering Study Program, Faculty of Agriculture, Medan UISU
Keywords: Compost, Formulation Material, Waste Beef Cattle-Corn, Manufacturing.
Abstract: The success of corn agro-industry is influenced by the availability of fertilizers, especially of artificial
fertilizers whose availability continues to decrease. The solution is to increase compost production through
the use of wet/ dry stover (WS/DS), commercial/ traditional cattle waste (C/T CW) in EM4 solutions (5 ml/l
and 10 ml/l). The purpose of this study was to obtain the formulation of compost making materials.
Composting was done by mixing C/T CW, WS and DS with formulation material (Control; 1: 0: 3; 1: 1: 2;
1: 2: 1; 1: 3: 0), putting into polybags in a bucket covered, performing an anaerobic fermentation for 40
days, and checking and stirring once in three days. Compost is ripely characterized by a distinctive
fermented aroma. The treatment of compost material formulation used a nonfactorial Completely
Randomized Design Model (non-factorial CRDM). Parameters observed were yield, moisture content
(oven), pH (potentiometry), P
2
O
5
(spectrophotometry), K
2
O (AAS), organic C (Gravimetric), N-total
(Volumetric), C/N ratio. The results showed that EM4 performance of 10 ml/l of water was better than 5
ml/l of water which could speed up the composting process, K
2
-1: 0: 3 compost material formulation
produced more compost in accordance with SNI quality standards with a yield of 30.86%, moisture content
28.92%, pH 5.97, P
2
O
5
1.12%, K
2
O 2.01%, organic C 50.06%, N total 1.95% and C / N ratio 25.67.
1 INTRODUCTION
The demand for maize in the country increases. This
is in line with the development of the corn
processing industry and the development of animal
husbandry sector (BPS, 2011; Kementan, 2016a). In
addition to the procurement of food and feed, corn is
also widely used in the food industry, beverages,
chemicals, and pharmaceuticals which give added
value to the commodity corn farming (Suarni and
Widowati, 2014).
According to BPS, corn production reached
19.61 million of shelled corn in 2015. This
production rose 3.17 percent if compared to 2014
(Kementan, 2016b). However, to meet the needs of
livestock feed in 2016, the government of Indonesia
imported corn as much as 2.4 million tons gradually
by as much as 200 thousand tons per month. In
2017, it was predicted that Indonesia imported corn
in 30% of the total national maize needs, which
reached 8.6 million tons per year or approximately
665 thousand tonnes per month (Kemenperin, 2016).
The problems faced in the development of agro-
industries, the corn are in low productivity. The
price of corn is fluctuating because of extensive land
and more small businesses and the risk of failed
harvest due to weather changes. One of the factors
of the success of industrial agriculture of maize was
strongly influenced by the availability of fertilizer.
Recently, most farmers have still used artificial
fertilizers. In addition to its decreasing availability,
the use of which is not wise. This also affects the
ecological balance so that resources support
neighborhood continues to decline and productivity
corn which still remains low.
The alternative is the counter measures which
increase the production of organic fertilizer
(compost) through the management and utilization
of the waste corn (waste is produced in the form of
stems, leaves, cornhusk about 14.88 million tons and
maize cobs as much as 34.06 million ton) (Setiawan.
2014). Corn plants produce waste whose proportions
vary. The largest proportion of corn stalks is (stover)
followed by leaf, fruit peels, and corn cobs. The
proportion of waste from several varieties of maize
was developed by maize and cereal crops research
hall Maros i.e. the proportion of stems varies
between 55.38-62.29%, the proportion of leaves
Paramuji, M.
Utilization of Waste Beef Cattle-corn as Formulation Material in Compost Fertilizer Manufacturing.
DOI: 10.5220/0008887401990205
In Proceedings of the 7th International Conference on Multidisciplinary Research (ICMR 2018) - , pages 199-205
ISBN: 978-989-758-437-4
Copyright
c
2020 by SCITEPRESS – Science and Technology Publications, Lda. All rights reserved
199

between 22.57-27.38% and the proportion between
cornhusk 11.88-16.41% (Anggraeny et al. 2006).
The proportion of the waste corn plants percent dry
ingredients consist of 50% of the stem, leaves 20%,
20% and 10% of cob, cornhusk (BPS, 2009). Cow
manure has excellent potential as a provider of plant
nutrients (fresh feces as much as 15-20 kg/head/day
and urine 10-15 liters/head/day) (Lutojo et al. 2010;
Wahyuni. 2010). The amount of waste is quite a lot
and it is very potential if it can be utilized
appropriately and optimally. Therefore, is it
important to handle it by utilizing waste such as
livestock droppings of organic fertilizer. Processing
beef cattle droppings into the compost (composting)
needs to consider a sustainable technology because it
aims for environmental conservation, and the use of
compost (organic fertilizer) can reduce the use of
chemical fertilizers and the larger value breeders
(Indrawaty, 2015). So far, the utilization of waste
stool and urine has still been untapped with
maximum livestock excrement. Many have
accumulated around the enclosure and not many are
utilized. Stool that was not processed can only be
allowed naturally into organic fertilizer, while the
urine passing from the cage can only be put into the
tub without treatment. Therefore, this will produce
solid organic fertilizers that are moist, not crumb,
immature, easily moldy, save time and the
manufacturing process (Swastike et al, 2015).
2 RESEARCH METHODS
2.1 Research Time and Location
This research was conducted from June to
September 2018. The research location was in Deli
Serdang regency, North Sumatra province. This
location was chosen by considering the area of corn
farming and beef cattle, in which transportation
facilities (axle road and sub-district ring road),
location plantations and beef cattle farms that are
close together were available.
2.2 Research Materials and Tools
The materials used in this study were corn waste
(wet stover/dry stover; WS/DS), cattle waste
commercial (C) and cattle waste traditional (T),
EM4, water. The equipments used in this study were
tissue, label paper, polybag, plastic bucket/tube,
wood stirrer, chopper machine, oven, furnace,
micropipette (Socorex Calibra 832; 1-10 ml, Gilson;
1000 μl, Transferpette; 10-100 μl), analytical scales
(mettler ae 100 ), whatmen paper, desiccator, and
other analysis tools.
2.3 Research Implementation
The process of making compost was done in several
steps of finely chopping WS/DS and mixing, cattle
waste (C/T) mixed with EM4 solution with a
concentration of 5 ml/l of water and 10 ml/l of
stirred water evenly. The composting formulation
was then carried out by comparing 1 part C/T: 3
parts WS/DS. Formulation of C/T : WS : DS
(Control; 1: 0: 3; 1: 1: 2; 1: 2:1; 1: 3: 0). The mixture
of WS/DS and cow manure was evenly mixed, then
put in a polybag in a closed bucket, followed by
checking and reversing once in three days. It was
estimated that after forty days the compost had been
ready. During the decomposition process, it did not
emit a foul odor, even the fermented aroma. The
parameters observed were closely related to the
quality of compost, namely yield, moisture content
(Oven), pH of compost (Potentiometry), P
2
O
5
(Spectrophotometry), K
2
O (AAS), compost organic
C content (Gravimetry), N-total compost content
(Volumetric), and C/N ratio (Supatma and
Arthagama, 2008; Surtinah, 2013).
2.4 Statistical Analysis
The experimental design used for the treatment of
compost material was a nonfactorial Completely
Randomized Design Model (non-factorial CRDM).
The independent variable used for the treatment of
compost material is the compost material
formulation, namely the C/T: WS: DS (Control; 1:
0: 3; 1: 1: 2; 1: 2: 1; 1: 3: 0). The compost produced
was then tested for yield, moisture content, and pH
of compost, P
2
O
5
compost, K
2
O compost, compost
organic C content, N-total compost content, C/N
compost ratio. A statistical model for complete
random design is as follow:
Y
ij
= μ + τ
i
+ ε
ij
(1)
information :
i : factor (i = 1,2,3,4 .... n)
j : replication (j = 1,2,3 ... n)
Y
ij
: the experimental response to compost material
is the factor and the jth test
μ: general average
τ
i
: influence of compost material factors
ε
ij
: trial error
ICMR 2018 - International Conference on Multidisciplinary Research
200
3 RESULTS AND DISCUSSION
Parameter test results and analysis of compost data
generated with the anaerobic composting system
using EM4 activator (Table 1) can be explained that
in general, the compost material formulation
treatment shows a very significant difference in
Duncan's test level of 5% although there were
several treatments which showed the difference that
was not real. The results showed that during the
composting process the performance of EM4
activator at a concentration of 10 ml/l of water was
better than 5 ml/l of water because it could speed up
the composting process. The results of compost
chemistry analysis showed that most of the compost
material formulation treatment had met the
requirements of quality standards of organic
fertilizer from SNI.
During the composting process, color changes
occur gradually. Brownish green-yellow color
changed to dark brown color. At the end of the
composting process the color changed to brownish
black due to the formation of humic acid. In addition
to discoloration, when the process took place, the
compost emited an unpleasant odor due to the
decomposition of the organic material that was still
running. However, at the end of composting,
compost smelled of perfection.
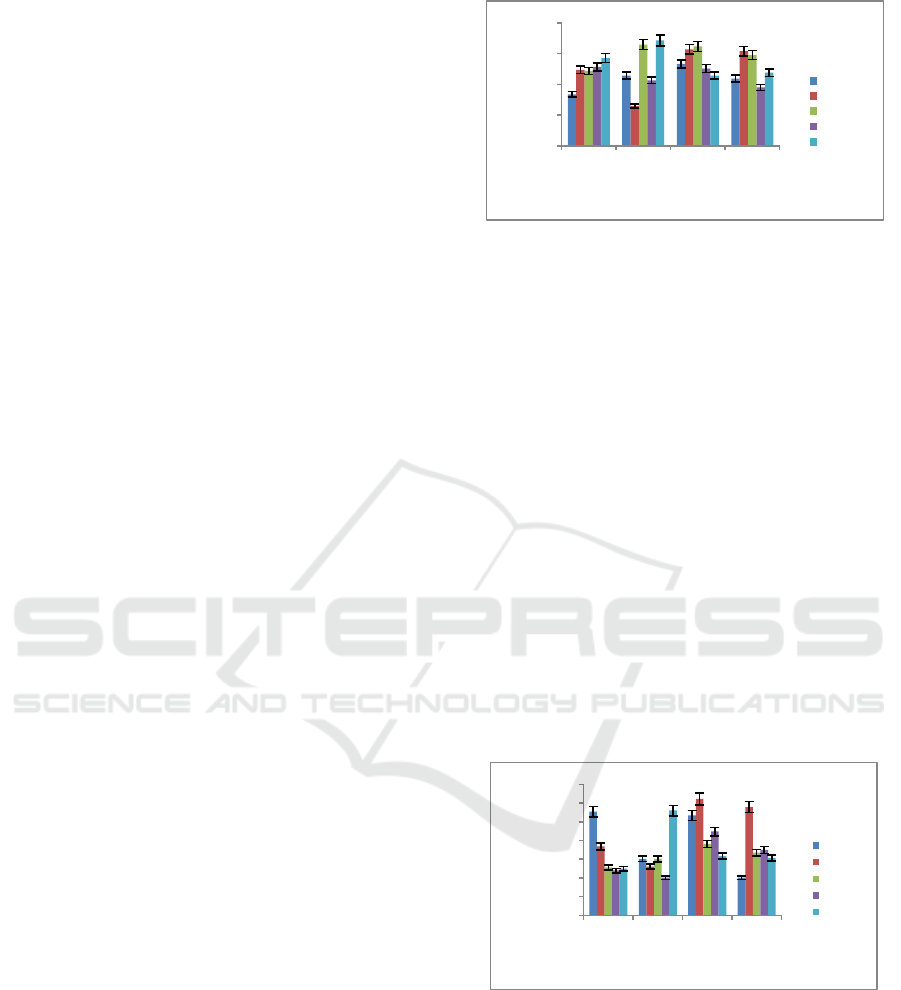
3.1 Yield
The decomposition process depends on the content
of the material used, where cellulose is more easily
decomposed than lignin. The decrease in compost
yield (Figure 1) is quite high. This is because the
compost material, especially corn stover contains
more cellulose than lignin and porous which ware
easy to absorb and release water. Depreciation of
compost material in the material formulation
because at the time of composting takes place a
process of decomposition of compost material by
microorganisms that convert organic matter into
carbon dioxide, water, hummus, and energy.
Depreciation of final mature compost is about 50-
75% of the initial weight of compost (Wahyono et
al, 2011). The lowest compost was in the T
2
-1: 0: 3
formulation (12.95%) and the highest was in T
2
-1: 3:
0 (34.29%).
Figure 1: The relationship between Formulation of
Compost Material and Yield.
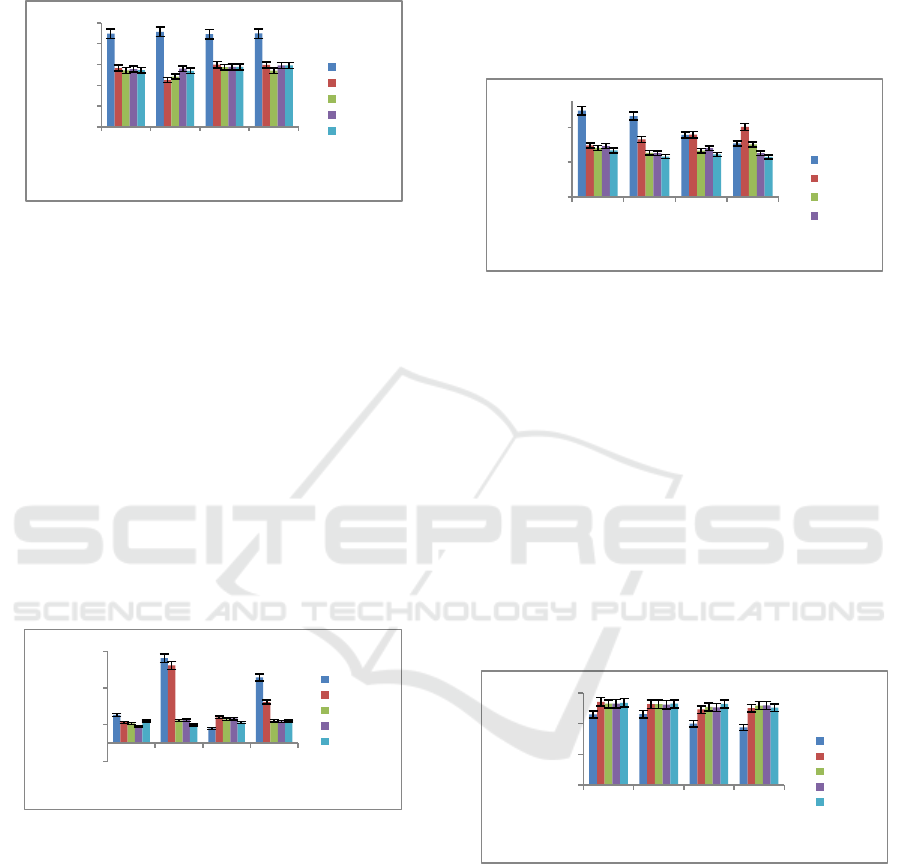
3.2 Moisture Content
Compost moisture content depicts moisture during
the composting process. When composting takes
place, the compost water content is quite high. High
water content is due to compost material consisting
of cattle waste in wet conditions, wet/dry field corn
stover and the addition of 1 liter EM4 solution
(Table 1). Compost water content is obtained from
the decomposition of organic matter into carbon
dioxide, water vapor and compost (Arumsari et al,
2012). Besides being needed directly by a
microorganism, water also affects the aeration
system and oxygen supply in the bucket media. The
compost water content produced (Figure 2) is lower
than SNI quality standards. This has met SNI quality
standards. The lowest compost moisture content was
in C
2
Control formulation (10.07%) and the highest
in C
1
-1: 0: 3 (31.08%).
Figure 2: The Relationship between Formulation of
Compost Material and Moisture Content.
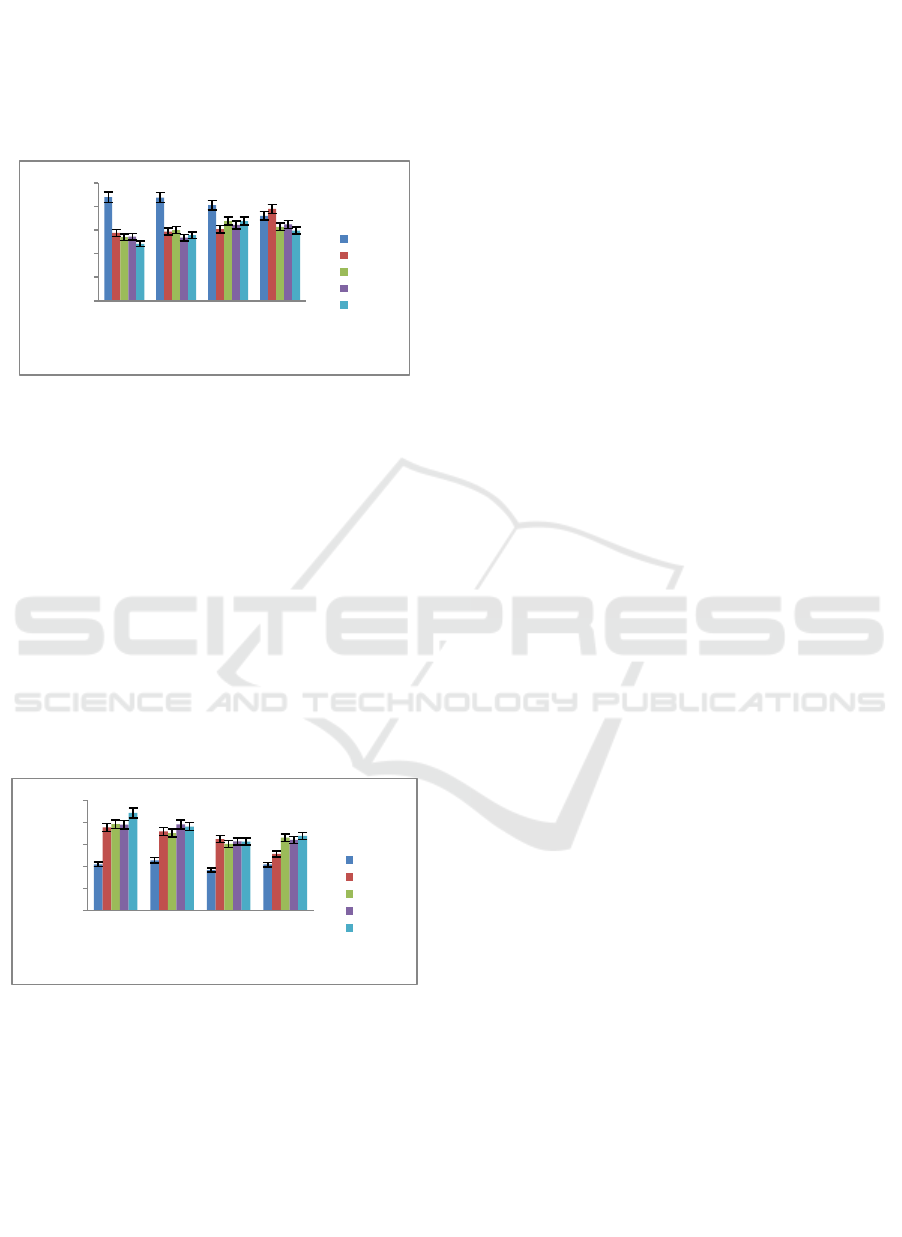
3.3 pH
The level of acidity or alkalinity of a solution can be
seen from the pH. When composting takes place,
organic matter decomposes into organic compounds.
The pH value of compost produced from compost
material formulation is not in accordance with SNI
quality standards (Table 1), because some pH is too
0
10
20
30
40
T1 T2 K1 K2
Yield%
FormulationofCompostMaterial
Kontrol
(1:0:3)
(1:1:2)
(1:2:1)
(1:3:0)
0,00
5,00
10,00
15,00
20,00
25,00
30,00
35,00
T1 T2 K1 K2
MoistureContent%
FormulationofCompostMaterial
Kontrol
(1:0:3)
(1:1:2)
(1:2:1)
(1:3:0:)
Utilization of Waste Beef Cattle-corn as Formulation Material in Compost Fertilizer Manufacturing
201
high and the others are too low (Figure 3). The
lowest compost pH was in T
2
-1: 0: 3 formulation
(4,51) and highest was in T
2
Control (9,15).
Figure 3: The relationship between Formulation of
Compost Material and pH.
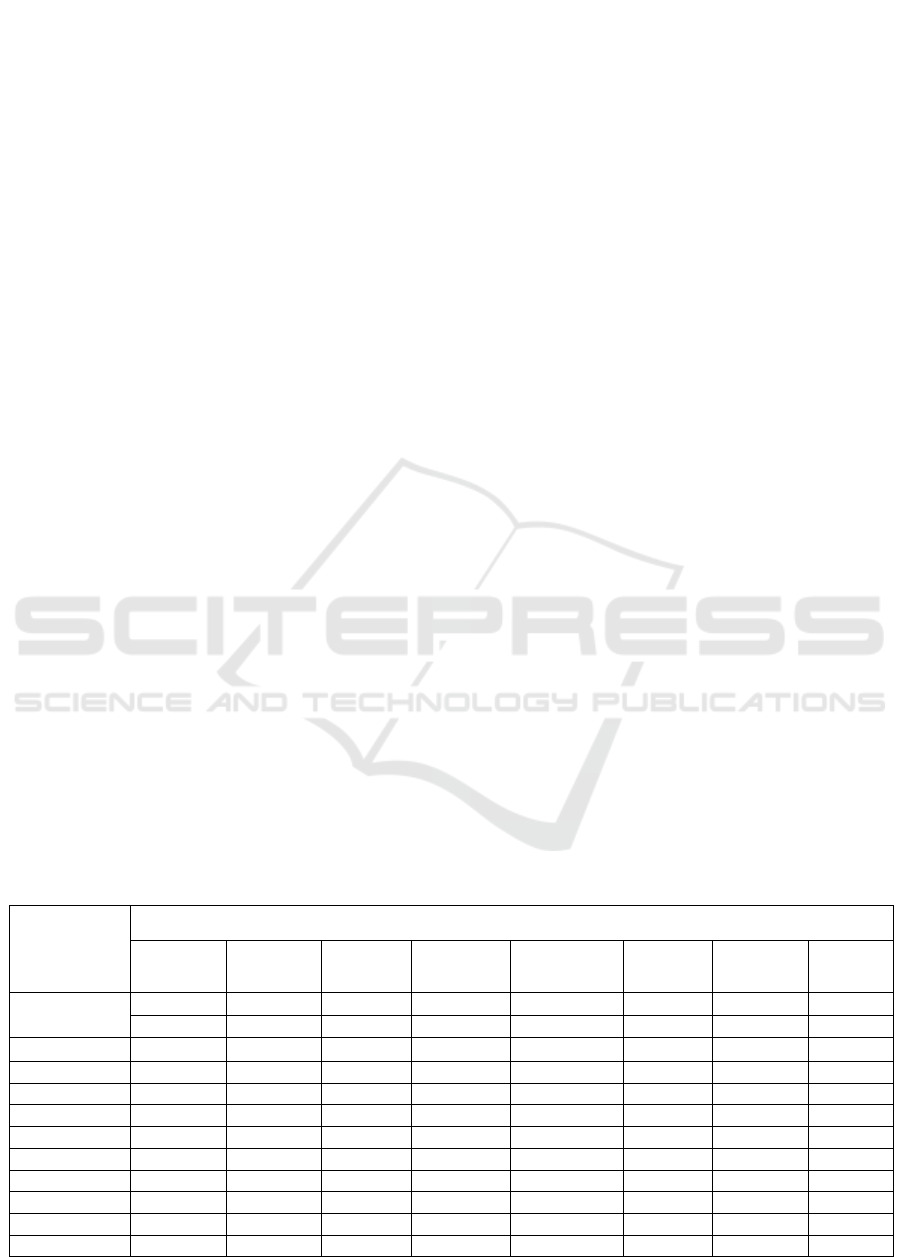
3.4 P
2
O
5
P
2
O
5
levels show high values (Figure 4). This is
because the control formulation is 100% cattle
waste. As stated by Miftahul (Miftahul, 2003) that
the high and low content of phosphorus in compost
is probably due to a large amount of phosphorus
contained in the raw material used and the number
of microbes involved in composting. The lowest
compost P
2
O
5
level was in C
1
Control formulation
(0.40%) and the highest was in T
2
-1:3:0 (2.12%).
P
2
O
5
compost from all compost material
formulations has met SNI quality standards (Table
1).
Figure 4: The relationship between Formulation of
Compost Material and P
2
O
5
.
3.5 K
2
O
The results of the analysis of compost material
formulation had a higher K
2
O compared to SNI
quality standards (Table 1). This condition was
possible because the formulation of compost
material also greatly affected the content of
potassium in composting for bacterial activity. This
is in accordance with the statement of Agustina
(Agustina, 2004), that potassium is a compound
produced by microbial metabolism, in which
microbes use free K
+
ions which are present in
fertilizer raw materials for metabolic purposes. K
2
O
of all compost material formulations have met SNI
quality standards (Table 1). The lowest compost
K
2
O was in C2-1: 3: 0 formulation (1.15%) and the
highest was in T
1
Control (2.48%).
Figure 5: The relationship between Formulation of
Compost Material and K
2
O.
3.6 Organic C
The results of the analysis of compost organic C
levels are still too high (Figure 6), because corn
stover and cattle waste contain high carbon. Jannah
(Jannah, 2003) has explained that during the process
of decomposition of organic matter, the activity of
microorganisms produces element C so that the level
of organic C increases. Then when the compost is
made, the decomposers will die and the C organic
content will slowly drop. The lowest compost
organic C was in the C
2
Control formulation
(40.01%) and the highest was in T
1
-1: 0: 3 (54.21%).
Figure 6: The relationship between Formulation of
Compost Material and Organic C.
3.7 Total N
The decomposition of organic matter by
microorganisms in the composting process will
produce a number of nitrogen elements. This is one
of the parameters in the quality standard of organic
fertilizer. The greater the content of N, P, and K
nutrients in compost, the better the compost used for
plants because it provides enough nutrients for
0
2
4
6
8
10
T1 T2 K1 K2
pH
FormulationofCompostMaterial
Kontrol
(1:0:3)
(1:1:2)
(1:2:1)
(1:3:0)
‐0,5
0,5
1,5
2,5
T1 T2 K1 K2
P2O%
FormulationofCompostMaterial
Kontrol
(1:0:3)
(1:1:2)
(1:2:1)
(1:3:0)
0
1
2
T1 T2 K1 K2
K2O%
FormulationofCompostMaterial
Kontrol
(1:0:3)
(1:1:2)
(1:2:1)
0,00
20,00
40,00
60,00
T1 T2 K1 K2
OrganikC%
FormulationofCompostMaterial
Kontrol
(1:0:3)
(1:1:2)
(1:2:1)
(1:3:0)
ICMR 2018 - International Conference on Multidisciplinary Research
202
plants and soil (Putro et al. 2016). In general, the
total N of all compost material formulations has met
the requirements and this is higher than the total N
SNI quality standard (Figure 7). The lowest total N
was in T
1
-1: 0: 3 (1.21%) and the highest was in T
1
Control (2.20%).
Figure 7: The relationship between Formulation of
Compost Material and Total N.
3.8 C/N Ratio
The C/N ratio of the formulation of compost
material is still in the range required by the quality
standard although there is a C/N ratio that is too
high. The lowest C/N ratio analysis results were in
C
1
Control (18.27%) and the highest was in T
1
-1: 3:
0 (44.32%). The high C/N ratio generated from the
compost material formulation (Figure 8) is in
accordance with Sulaeman (Sulaeman., 2011), that
compost materials, such as husks, rice straw, corn
stalks, and sawdust, have a C/N ratio between 50-
100.
Figure 8: The relationship between Formulation of
Compost Material and C/N Ratio.
4 CONCLUSION
The results showed that the EM4 performance of 10
ml/l of water was better than that of 5 ml/l of water,
which could speed up the composting process of
compost material formulation. Compost formulation
C
2
-1: 0: 3 produced compost with a yield of 30.86%,
moisture content 28.92 %, pH 5.97, P
2
O5 1.12%,
K
2
O 2.01%, organic C 50.06%, N total 1.95% and
C/N ratio 25.67 more. This is in accordance with
SNI quality standards.
RECOMMENDATION
1. Similar research needs to be done by increasing
fermentation time to obtain more quality
compost with a C/N ratio to meet quality
standards.
2. To follow up and support the development of
integrated corn agro-industry in Deli Serdang,
North Sumatra, it is better to apply compost
produced from compost material formulation.
THANK YOU NOTE
This research was funded by the Menristek Dikti
through the PDD Scheme in the LLDikti I and the
LP UISU Medan in the 2018 Budget Year; Faculty
of Agriculture UISU and RISPA Medan for
greenhouse facilities and compost parameter testing.
REFERENCES
Agustina. 2004. Book, Basic Plant Nutrition. Jakarta :
Rineka Cipta. Page 54.
Anggraeny, YN., Umiyasih, U., Krishna, NH. 2006. The
Potential for Corn Waste is Ready to be Released as a
Source of Forage for Beef Cattle. Pros. National
Workshop on Corn - Cattle Integration System
Development Network. Pontianak, 9-10 August 2006.
Bogor: Research Center for Animal Husbandry. p. 149
- 153.
Anonymous. 2015. Harvest and Postharvest Corn
Management. Corn Cultivation Technical Training for
Agricultural Extension. Agricultural Human
Resources Counseling and Development Agency.
Bogor: Agricultural Training Center.
Arumsari, A., Syafrudin, Winardi. 2012. Utilization of
Sludge Resulting from Wastewater Treatment PT.
Indofood Cbp. with the Addition of Domestic Waste
and Effective Microorganism (EM4) and Activated
Sludge as Activators Through the Composting
Process. Semarang: Diponegoro University. Faculty of
Engineering. Environmental Engineering Study
Program.
BPS (Statistics Center). 2009. Agricultural Statistics.
Center for Agricultural Data and Information. Ministry
of Agriculture. Jakarta.
0
0,5
1
1,5
2
2,5
T1 T2 K1 K2
TotalN(%)
FormulationofCompostMaterial
Kontrol
1;0;3
1;1;2
1;2;1
1;3;0
0
10
20
30
40
50
T1 T2 K1 K2
C/NRatio
FormulationofCompostMaterial
Kontrol
1;0;3
1;1;2
1;2;1
1;3;0
Utilization of Waste Beef Cattle-corn as Formulation Material in Compost Fertilizer Manufacturing
203
BPS (Statistics Center). 2011. Food Crop Production
Statistics. South Sulawesi: Directorate General of
Food Crops.
SNI (Standart of National Indonesian). 2004. SNI 19-
7030-2004: Specifications for compost from domestic
organic waste. Jakarta: BSN Pr.
Indrawaty, PV. 2015. Effect of the use of urine as a source
of nitrogen on the physical form and nutrients of cow
feces compost [Thesis]. Jambi: Jambi University
Jannah, M. 2003. Compost Quality Evaluation from
Various Cities as a Basis for Composting Compilation
of SOP (Standard Operating Procedure). Bogor:
Bogor Agricultural University, Faculty of Agricultural
Engineering.
Kementan (Ministry of Agriculture). 2016a. Corn
Production in 2016 is Enough to Fulfill the Feed
Industry. Retrieved from http: /www.repu-
blika.co.id/berita/kementan/berita-kementan/ 16/
06/28/o9gve7383-kementan-production-maize-2016-
quite-full-industry-feed.
Kementan (Ministry of Agriculture). 2016b. Harvested
Area and Productivity Increased, 2016 Corn
Production is Predicted to Penetrate 23 Million Tons.
Retrieved from http: //www.agro-
farm.co.id/m/pertanian/3548/ebaran-panen-dan-prod
Productivity-up-production-corn-2016-pre-dicted-
translucent-23-million-ton / # wgude9j97iu.
Agrofarm.co.id.
Kemenperin (Ministry of Industry). 2016. 2016 RI Imports
of Corn 2.4 Million Tons. Retrieved from
http://www.kemenperin.go.id/artikel/13892/2016,-ri-
import-corn-2,4- million-ton.
Lutojo, Sihombing G., & Rriyanto J. 2010. Application of
Integrated Installation Design of Faecal and Urine
Waste Processing for Solid and Liquid Organic
Fertilizer Industry in Beef Cattle Fattening Business.
Appl. Science and Technology. Semarang: Dipa Blu
UNS.
Mifathul. 2003. Evaluation of Compost Quality from
Various Cities as a Basis for Making Composting
SOPs. Bogor: IPB.
Putro, BP., Walidaini, RA., Samudro, G., Nugraha, WD.
2016. Quality Improvement of Campus Organic Waste
Compost Enriched with NPK and Urea Fertilizer.
Proceedings of the 7th 2016 SNTS. Semarang: Wahid
Hasyim University, Faculty of Engineering. Page.17-
22.ISBN 978-602-99334-5-1.
Setiawan, E. 2014. Utilization of Corn Waste (Cob,
Cornhusk, and Straw) as Animal Feed. Retrieved from
http://i1122.photobucket.com/albums/ l524/
riyosuke/tail2.gif. Tuesday, February 4, 2014. Broken
HTTP://ekasetiawanfapetunja .blog spot. co.id /
2014/02 / corn-waste-use-tongkol.html.
Suarni & Widowati, S. 2014. Corn Structure, Composition
and Nutrition. Bogor: Bogor Center for Agricultural
Postharvest Research and Development.
Sulaiman, D. 2011. Effect of Waste Compost Baglog White
Oyster Mushroom (Pleurotus ostreatus Jacquin) on
Soil Physical Properties and Growth of Yellow
Passion Fruit Seeds (Passiflora edulis var.
Flavicarpa Degner) [Thesis]. Bogor: Bogor
Agricultural University, Faculty of Agriculture,
Department of Soil Science.
Swastika, W., Handayanta, E., Purnomo, SH. 2015. The
Application of Faecal and Urine Waste Processing
Technology as an Entrepreneurial Business
Establishment in Jatikuwung Sebelas Maret University
Mini Farm. Proceedings of the 2015 National Seminar
on the 4th UNS SME Summit & Awards "Synergy of
MSME Development in the Era of the ASEAN
Economic Community (MEA)". Semarang: UNS Pr.
Wahyono, S., Sahwan, FL., Suryanto F. 2011. Making
Granule Organic Fertilizers from Various Wastes.
Jakarta: Agromedia Library.
Wahyuni. S. 2010. Produces Biogas from Various Wastes.
Jakarta: Argromedia Pustaka.
Table 1. Compost Composition Based on SNI and Compost Formulation Test Results
Formulation
Parameter (%)
Yield Moisture
Content
pH P
2
O
5
K
2
O Organic
C
N-total C/N
Ratio
* Minimum
Maximum
- - 6,8 0,10 0,20 9,8 0,40 10
- 50 7,49 - - 30 - 20
** Control T
1
16,78 b 27,70 k 8,96 j 0,77 e 2,48 i 46,00 c 2,20 g 20,91 b
T
1
(1:0:3) 24,76 fg 18,41 g 5,66 efg 0,57 abc
d
1,48 bcde 54,21
m
1,44 abc 37,65 l
T
1
(1:1:2) 24,38 efg 12,81 c 5,43 c
d
0,54 abc 1,41 abcde 52,96 j
k
1,35 ab 39,23
m
T
1
(
1:2:1
)
25,71
g
h 11,96 b 5,56 cde 0,45 ab 1,46 bcde 53,02
k
1,36 ab 38,99
m
T
1
(
1:3:0
)
28,57 i 12,50 bc 5,46 c
d
0,60 bc
d
1,34 abc
d
53,63 l 1,21 a 44,32 n
Control T
2
22,86 de 15,09
d
9,15
k
2,12 h 2,32 i 46,23 c 2,19
g
22,77 c
T
2
(1:0:3) 12,95 a 13,03 c 4,51 a 0,62 cde 1,65 efg 52,72 j 1,47 abc 35,86
k
T
2
(1:1:2) 32,95 kl 15,04
d
4,84 b 0,63 cde 1,27 abc
d
52,71 j 1,50 abc
d
35,14 j
T
2
(1:2:1) 21,33
d
10,08 a 5,59 def 0,50 ab 1,26 abc 52,34 i 1,34 ab 39,06 m
T
2
(
1:3:0
)
34,29 l 28,00
k
5,40 c 0,40 a 1,16 a 52,96
jk
1,39 abc 38,10 l
ICMR 2018 - International Conference on Multidisciplinary Research
204
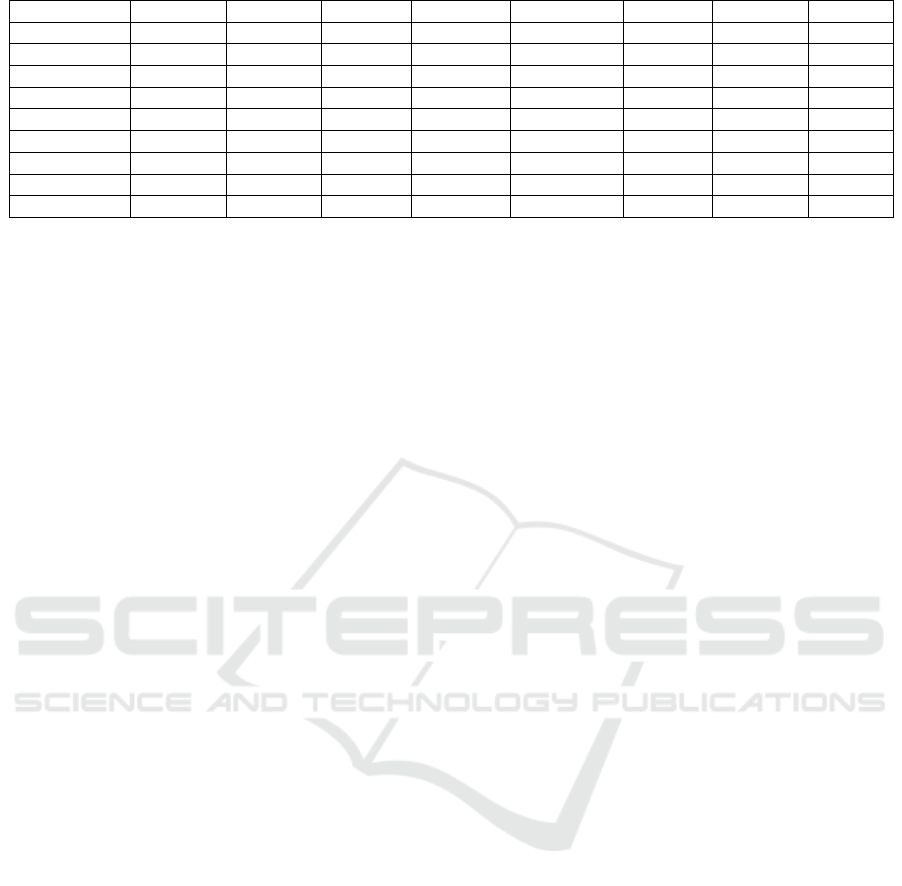
Control C
1
26,67 h 26,69
j
8,92
j
0,70 e 1,78 f
g
40,01 b 2,03 f
g
18,27 a
C
1
(1:0:3) 31,43 j
k
31,08 l 5,98 i 1,02 f 1,79 gh 49,23
d
1,52 abc
d
32,39 g
C
1
(1:1:2) 32,38 j
k
19,10 h 5,74 efgh 0,65 cde 1,33 abc
d
50,99 g 1,69 cde 30,17 e
C
1
(
1:2:1
)
25,14 f
g
h 22,39
j
5,78
g
h 0,67 de 1,40 abcde 50,54 f 1,61 bc
d
31,39 f
C
1
(
1:3:0
)
22,86 de 15,86
d
5,77 f
g
h 0,56 abc
d
1,22 ab 52,84
jk
1,69 cde 31,27 f
Control C
2
21,91
d
10,07 a 8,98
jk
1,79
g
1,54 def
g
37,50 a 1,80 def 20,83 b
C
2
(1:0:3) 30,86 j 28,92
m
5,97 i 1,12 f 2,01 h 50,06 e 1,95 efg 25,67
d
C
2
(1:1:2) 29,52 i 16,75 e 5,42 c
d
0,61 c
d
1,51 cdef 51,83 h 1,57 bc
d
33,01 h
C
2
(1:2:1) 19,05 c 17,46 f 5,91 hi 0,59 bc
d
1,26 abc 51,94 h 1,62 bc
d
32,06 g
C
2
(
1:3:0
)
23,81 ef 15,36
d
5,92 hi 0,60 bc
d
1,15 a 50,39 f 1,49 abc
d
33,82 i
Description: Numbers followed by the same letter in the same column showed no significant
difference In Duncan's test level of 5%.
Source : * SNI (2004); ** Research Data (2018).
Utilization of Waste Beef Cattle-corn as Formulation Material in Compost Fertilizer Manufacturing
205
