
Does Power Point Matter for Teaching and Learning Economics?
Khasan Setiaji
1*
, Bagus Shandy Narmaditya
2
1
Universitas Negeri Semarang
2
Universitas Negeri Malang
Keywords : PowerPoint, Teaching and Learning, Economics
Abstract : Learning is a complex communication process between teachers and students in an education environment.
Thus, the teachers’ competence in designing learning, such as the utilization of learning technology is
greatly required in achieving effective learning. Economic sciences require some analytical instruments to
mathematically and graphically explain and prove the theories to provide better explanations regarding the
economic theories. PowerPoint for the economic learning media is greatly necessary to meet the
characteristics and nature of economics. However, the empirical conditions show that the utilization of
PowerPoint for learning is modestly packaged that the main purpose of PowerPoint utilization in the
communication process is not properly realized. This article strives to provide guidance on the utilization of
PowerPoint as an effective learning medium for economic sciences learning. There are some important
things to consider in making PowerPoint for learning, such as in visual designing, text, graphics, static
visual display, dynamic visual display, transitional effects, use of colors, layout, and audio.
1 INTRODUCTION
The Government Regulation of the Republic of
Indonesia No. 74/2008 on Teachers states that
teachers should have academic qualifications,
competencies, educator certificates, physical and
mental health, as well as ability to realize the
national education objectives (Indonesia, 2008). The
teachers’ competencies include pedagogical,
personal, social, and professional competence as a
whole. Pedagogic competence is the teachers’ ability
in learners’ learning management, at least consisting
of; (a) understanding the educational insights or
foundations; (b) understanding the learners; (c)
curriculum or syllabus development; (d) learning
design; (e) the implementation of educating and
dialogical learning; (f) utilization of learning
technology; (g) evaluation of learning outcomes; and
(h) learners’ development to actualize their
potentials.
Learning is a communication process that the use
of teaching media is considered essential in assisting
the learning achievement success. (Danim, 2008)
asserts that many research results have proven the
effectiveness of instrument or media utilization in
teaching and learning processes in the classroom,
especially in terms of improving students’
achievement. The limited number of media used in
the classrooms presumably becomes one cause of
the student learning poor quality. Various efforts
should be made to create a learning situation which
enables the students to obtain various learning
experiences by implementing all effective and
efficient learning sources and techniques (Rusyan,
A. Tabrani, 1993). In this case, teaching media is
one effective support in assisting the learning
processes.
One learning medium may be conducted to
overcome the above obstacles is through the
Microsoft program of powerpoint media. "Microsoft
PowerPoint is one most popular and widely used
application program for presentations in terms of
learning, product introduction, meeting, seminar,
workshop and so forth (Susilana, Rudi, 2009). The
utilization of Microsoft PowerPoint media in
economic learning has proven improving the
students’ learning outcomes and activities
(Maryatun, 2015). However, some studies show that
the utilization of PowerPoint in presentations is less
effective than Prezi and Oral Presentation (Moulton
ST, Türkay S, 2017).
Harvard’s Department of Psychology (Moulton
ST, Türkay S, 2017) recently published the study in
the journal PLOS ONE titled, Does a presentation’s
medium affect its message? PowerPoint, Prezi, and
oral presentations. Participants evaluated Prezi
50
Setiaji, K. and Narmaditya, B.
Does Power Point Matter for Teaching and Learning Economics?.
DOI: 10.5220/0008785400500055
In Proceedings of the 2nd International Research Conference on Economics and Business (IRCEB 2018), pages 50-55
ISBN: 978-989-758-428-2
Copyright
c
2020 by SCITEPRESS – Science and Technology Publications, Lda. All rights reserved
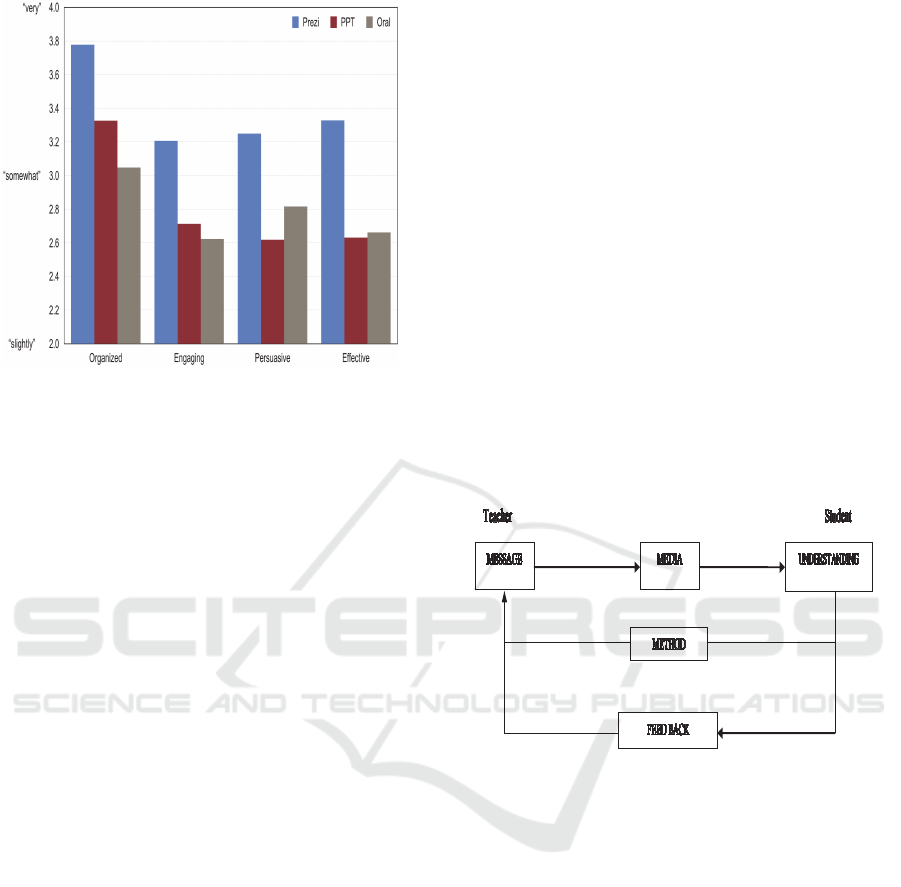
Figure 1: Audience Members Ranked the Presentations
from Best to Worst
presentations as more organized, engaging,
persuasive, and effective than both PowerPoint and
oral presentations. In fact, PowerPoint presentations
were rated as no better than verbal presentations
with no visual aids at all. Users rated the three
formats on a scale from 1 to 5 in a few major
categories.
This finding was true for both live and
prerecorded presentations, when participants rated or
ranked presentations, and when participants judged
multiple presentations of different formats or only
one presentation in isolation. Presenters giving Prezi
presentations were also noted as being “more
knowledgeable and professional” by their audience.
Although PowerPoint is considered as one most
popular and widely used application program for
various presentation purposes in the learning
process. Practically, there are still many mistakes
found in designing PowerPoint for learning in order
to make an interesting presentation but the result is
in the other way around. The presentation becomes
unattractive and extremely boring. Many people
make various mistakes in designing their
presentation slides, such as (a) The slides are created
for presentation purposes; (b) The slides are wordy
and full of bullet points; (c) Slides are made with
irrelevant photographs or images; (d) Slides are
made with low quality photographs or images; (e)
Slides are made with weak color contrast; (f) Slides
are created by entering the actual data tables; (g)
Slides are created with excessive animations; (h)
Slides are made with 4D theater sound effect
(Sutomo, 2007).
From the above explanations, it is obvious that
teaching media are considered unavoidable
requirements in economic learning in order to
achieve the expected learning outcomes.
Consequently, the teachers should be able to play
their roles in selecting the right media and planning
based on the most appropriate techniques and
procedures. In facts, due to the phenomena found in
the field, many teachers do not perform and
understand the procedures in utilizing PowerPoint
for better learning results. If those phenomena are
not well-paid attention, there is a possibility that the
economic learning process may become less
optimal. This article explains how to create a
sophisticated PowerPoint for more effective
economic learning.
2 LITERATURE REVIEW
2.1 Learning Media
Figure 2: The Position of Media in Learning System
Regarding its process, education is considered a
communication. Learning process contains five
communication components consisting of teachers
(communicators), learning materials, learning media,
students (communicants), and learning objectives.
Thus, learning media are defined as everything used
to convey the messages (learning materials) in order
to stimulate the students’ attention, interests,
thoughts, and feelings in learning activities to
achieve the goals (Santyasa, 2007). The word
“media” is the plural noun of the word “medium”.
The medium may be defined as communication
intermediary or conveyor from the sender to the
receiver (Heinich et al., 2002). Media is one
communication component as a messenger from the
communicator to communicant (Criticos, 1996).
Berlo (1960) states that the message sender and
Does Power Point Matter for Teaching and Learning Economics?
51
receiver are greatly influenced by various factors,
such as communication skills, behaviors,
knowledge, the social and cultural system (Powell
and Powell, 2010).
Since the learning process is considered as a
communication process and occurs within a system,
learning media occupy an important position as one
learning system component. Without media,
communication may not occur and the learning
process as a communication process may also unable
to optimally occur. Learning media is an integral
component of the learning system. The position of
instructional media as a communication component
is shown in Figure 2.
a
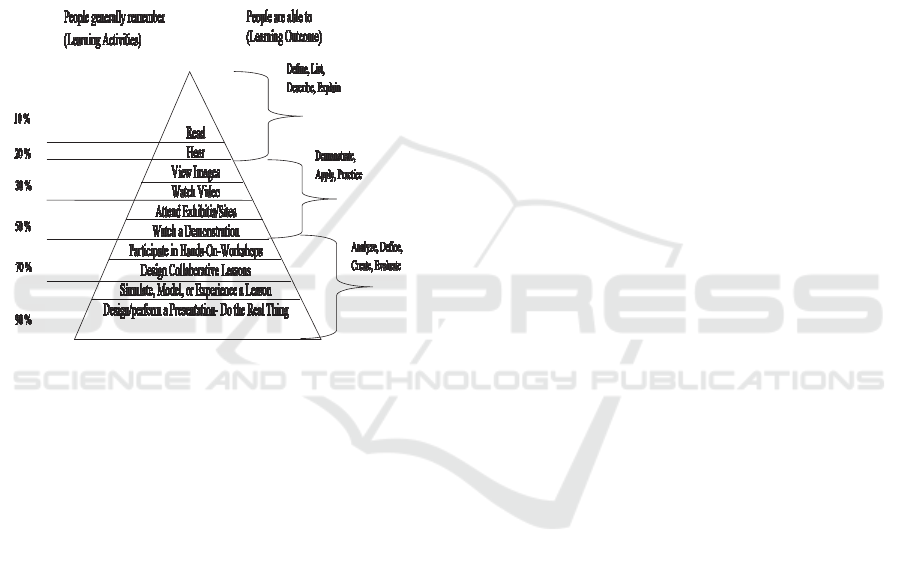
Figure 3: Cone of Experience concept (Dale, 1969)
In selecting the media, (Winkel, 2005) states that
media are selected not only due to their
compatibility with the specified instructional
objectives, learning materials, didactic procedures
and student grouping forms, cost factor, equipment
availability, and time (availability factor), electricity
and technical quality (technical quality), classrooms,
and teachers’ ability to appropriately use the media
(technical know-how) are greatly required.
Accordingly, (Dale, 1969) classifies experience into
layers from the most concrete level to the most
abstract one that the classification is known as" cone
of experience".
Dales’ cone of experience is a tool to help
instructors make decisions about resources and
activities (Anderson, n.d.). The instructor can ask the
following:
a. Where will the student’s experience with this
instructional resource fit on the cone?
b. How far is it removed from real-life?
c. What kind of learning experience do you want to
provide in the classroom?
d. How does this instructional resource augment the
information supplied by the textbook?
e. What and how many senses can students use to
learn this instructional material?
f. Does the instructional material enhance learning?
2.2 Characteristics of Economic
Sciences
Economics is the science that deals with production,
exchange, and consumption of various commodities
in economic systems. It shows how scarce resources
can be used to increase wealth and human welfare.
The central focus of economics is on the scarcity of
resources and choices among their alternative uses.
Economics as a social science discipline is a science
that investigates how people manage scarce
resources (Mankiw, 2006). Economics as a science
adopts two methods for the discovery of its laws and
principles (a) deductive method and (b) inductive
method. In the deductive method, we start from
certain principles that are either indisputable or
based on strict observations and draw inferences
about individual cases. In the inductive method, a
particular case is examined to establish a general or
universal fact. Both deductive and inductive
methods are useful in economic analysis.
Figure out the general characteristics of
economic theory, there are several important
elements of economic theory as follows (Sukirno,
2003) :
a. The definitions explaining the variables in which
the relationship characteristics may be applied in
theory. Variables are important elements in each
theory. A theory actually aims at explaining how
an economic condition is determined. For
example, in price theory, it is explained that the
nature of the demands required by the buyers is
known with the law of demand. The law says "if
the price of an item changes then the number of
demands for goods will also change". It is clearly
seen that the theory/law of demand has two
variables, namely price and the demanded
quantity of goods.
b. A number of assumptions or segregations about
conditions which should exist that the theory
may apply well. Making assumptions is one
important condition in making theory in
economic sciences. It means that the theory
should simplify the actual events taking place in
the society.
IRCEB 2018 - 2nd INTERNATIONAL RESEARCH CONFERENCE ON ECONOMICS AND BUSINESS 2018
52

c. One or more hypotheses about the relationship
characteristics between variables. The hypothesis
is a statement of how the variables relate to each
other. The relationship characteristics are
classified into two groups: (1) direct relationship,
such as a state in which the variable value
changes move to the same direction. For
example, if people's income increases, their
consumption will also increase; (2) inverse
relationship, that is, when the variable values
change in the opposite direction. For example,
the price increase may cause the demand
decreases. Hypothesis plays an important role in
explaining a theory. A hypothesis is a functional
relationship which states about the relationship
characteristics between variables.
d. One or more predictions about the upcoming
applicable conditions. Making predictions is one
important part of economic theory. Economic
theory makes an important contribution in
analyzing the economic activities in the society,
explaining why certain events may apply and
what causes them to take such event forms.
Economic theory may also predict the applicable
conditions which may be utilized as a basis in
formulating strategies to improve an economic
condition. Economic sciences require some
analytical instruments to mathematically and
graphically explain and prove the theories.
Various efforts to provide more complete
explanations of economic theories may be
conducted with the mathematical and graphical
assistance.
3 RESULTS AND DISCUSSION
3.1 Effective PowerPoint for Teaching
and Learning Economics
PowerPoint as one of learning media may help the
teachers deliver the learning materials effectively,
moreover, regarding the materials of economic
theory deal with its characters and characteristics.
Thus, PowerPoint for learning presentation may not
be carelessly made. There are some aspects to
consider in making PowerPoint presentation for
learning, such as visual designing, text, graphics,
static visual display, dynamic visual display,
transitional effects, and use of colors, as well as
layout, and audio (Chee and Wong., 2003).
3.2 Designing Visual
Visuals that are well designed can also help motivate
students to learn by attracting and maintaining their
attention. Often complicated information and those
that are difficult to remember can be simplified
using appropriate visual. For example, diagrams
such as flowchart or timelines, can be used to help
the student organize, store and retrieve information
more easily. Teachers face facing numerous
considerations when dealing whit a visual problem.
3.3 Text
The choice of font, style, and size are important
considerations when selecting the appropriate
lettering or text to be used. Some guidelines to help
teachers with this task are as follows: (1) Font Type,
this should be consistent and harmonies with the
other elements of visual (Figure 4). (2) A number of
lettering styles, keep this to no more than two in any
static display or a series of related visual and make
sure that the two font types harmonize with each
other. If variations of a particular font (bold, italics,
underline and difference size) are to use, keep into a
maximum of four variations. (3) Use of capital, short
headlines or titles of no more than six words may be
written in all capital. However, for anything longer
than that, best legibility is archived by using lower
case lettering for all word, adding capitals only
where normally required. (4) Lettering color,
contrast lettering with the background. This makes
the words easy to see and read. (5) Lettering size,
choose a lettering size that when projected allows
good visibility even by the student seated right at the
back of the classroom. Usually, the minimum
lettering size for these is 24 point. (6) The spacing
between line, if lines of text are too close together,
they tend to blur out at a distance, while lines too far
apart will seem disjointed. For computer generated
paragraphs of text, a one- and –a- half line spacing
the best choice. (7). A number of lines, this depends
on the type and purpose of the visual.
ECONOMICS EDUCATION Economics Education
ECONOMICS EDUCATION Economics Education
ECONOMICS EDUCATION Economics Education
Figure 4: Style versus Legibility of Lettering
Does Power Point Matter for Teaching and Learning Economics?
53

3.4 Graphics
Graphics refer to pictures and illustrations
which can be used in your visuals. Since graphics
can be in the form of static or dynamic (moving)
display, the discussions that follow will explore the
guidelines for using each type of graphics in your
presentations.
3.5 Static Visual Display
Therefore they can vary from realistic to graphic to
event abstract representations of the actual object. In
some instances, a photograph may have too much
detail within it, and a simple line drawing may be a
better choice. Another type of more abstract
representations that could be used includes
analogical visual and organizational charts. When
choosing your graphics, is also important to ensure
that it matches the next that goes with it. Do not use
pictures just for decorative purposes as they may
distract the learner from the main message.
3.6 Dynamic Visual Display
Dynamic visual displays include animation and
video. The can help students learn. Some guideline
for you to consider when using the dynamic visual
display in your presentations. (1) Replay feature,
consider providing the replay feature for the students
because they may not have been able to see the
animation or video clearly during their first viewing.
(2) Clarity, ensure that the visual quality of the
animation or video clip is good. They would be of
little educational value if the image is not focused.
(3) Support learning, the purpose of using dynamic
visual display is to help the student to learn better
faster. (4) Simplicity, short simple animations may
be more effective the complex ones.
3.7 Transitional Effects
There are many text animations features available
for users. Inappropriate use of animations can do
more harm than good to the learning process. It may
end up diverting the learner's attention to irrelevant
information, or it may illustrate concepts incorrectly.
Do not use text animations unless there is a good
reason to use it.
3.8 Use of Colors
Two considerations to keep in mind are color
scheme and color appeal. Select colors that effect
harmony rather than an annoyance. Since it is not
possible to present a color picture in black and white
print. Consider the emotional impact of color. For
example, highlight important information using red
or orange
.
3.9 Layout
The idea to establish an underlying pattern to decide
how the viewer's eye will move across the visual.
Consider the following factor as you decide on the
overall look of visual: (1) alignment of the graphic
and text element. Use this to show the clear visual
relationship between the main elements in the visual.
(2) Shape, the graphic and text elements can also be
arranged in a shape that is familiar to the student.
The circle is one of the most widely used shapes, as
it is often used in depicting the life cycle of living
things and the water cycle too. (3) Balance. A sense
of balance is achieved when the weight of the
elements in a visual is equally distributed on each
side of its vertical or horizontal axis. (4) Style,
choose a design style which matches your audience.
But as far as possible, choose to use an uncluttered
primary color design style rather than one filled with
complex imagery.
3.10 Audio
Some general guidelines for teachers to bear in mind
when including audio in their computer presentation.
(1) Learner control feature. When audio is used in
computer presentations, teachers should consider
providing features such as turn on, turn off and
replay to allow students to control the medium. (2)
Clarity, although most teachers do not have the
professional equipment to record voice, music
and/or sound effects, they still need to ensure that
the audio quality is good enough to serve its
purposes. (3) Audio quality, the recorded voice/
speech should be pleasant. The pace should not be
too fast or too slow. Monotones should be avoided.
(4) Comprehensibility, the teacher should avoid
using difficult vocabulary in their narration.
4 CONCLUSION
Nowadays, the utilization of technology in learning
is a great necessity. In a learning presentation, a
teacher should be able to present a real situation to
involve all human senses that the messages to
convey are well received. The research theories and
IRCEB 2018 - 2nd INTERNATIONAL RESEARCH CONFERENCE ON ECONOMICS AND BUSINESS 2018
54

results show that the right combination of audio,
visual and text in a presentation may bridge the
learning messages more effectively. The
combination may be performed through the use of
PowerPoint for the economic learning media. There
are some considerations in making PowerPoint in
learning, including the visual design, text, graphics,
static visual display, dynamic visual display,
transitional effects, and use of colors, as well as
layout, and audio.
REFERENCES
Anderson, H. M. (n.d.). Dale’s Cone of Experience.
Retrieved January 1, 2018, from
http://www.queensu.ca/teachingandlearning/modules/a
ctive/documents/Dales_Cone_of_Experience_summar
y.pdf
Chee, T. S., and Wong., A. F. L. (2003). Teaching and
Learning with Technology: An Asia-Pacific
Perspective. Singapore: Prentice Hall.
Criticos, C. (1996). Media selection. Plomp, T., and Ely,
D. P. (Eds.): International Encyclopedia of
Educational Technology, 2nd edition. New York:
Elsevier Science, Inc.
Dale, E. (1969). Audio-Visual Methods in Teaching, 3rd
ed. New York: Holt, Rinehart and Winston.
Danim, S. (2008). Media komunikasi pendidikan:
Pelayaran profesional pembelajaran dan mutu hasil
belajar (Proses belajar mengajar di Perguruan
Tinggi). Jakarta, Indonesia: Bumi Aksara.
Heinich, R., Molenda, M., Russell, J. D., and Smaldino, S.
. (2002). Instructional media and technology for
learning, 7th edition. New Jersey, USA: Prentice Hall,
Inc.
Indonesia, P. P. R. Tentang Guru, Pub. L. No. 74 (2008).
Indonesia.
Mankiw, N. G. (2006). Principles Economics 3th Editions.
Jakarta, Indonesia: Salemba Empat.
Maryatun. (2015). Pengaruh Penggunaan Media Program
Microsoft Powerpoint Terhadap Hasil Belajar Strategi
Promosi Pemasaran Mahasiswa Semester 2 Program
Studi Pendidikan Ekonomi Universitas
Muhammadiyah Metro Tahun Ajaran 2014/2015.
Jurnal Promosi, 3(1), 1–13.
Moulton ST, Türkay S, K. S. (2017). Does a presentation’s
medium affect its message? PowerPoint, Prezi, and
oral presentations. PLoS ONE, 12(7).
https://doi.org/https://doi.org/10.1371/journal.pone.01
78774
Powell, R.G., and Powell, D. (2010). Classroom
Communication and Diversity: Enhancing
Instructional Practice 2ed. New York: Routledge.
Rusyan, A. Tabrani, D. (1993). Penuntun Belajar yang
Sukses. Jakarta, Indonesia: Nine Karya.
Santyasa, I. W. (2007). Landasan Konseptual Media
Pembelajaran. Bali, Indonesia.
Sukirno, S. (2003). Pengantar Teori Mikroekonomi: Edisi
Ketiga. Jakarta, Indonesia: Raja Grafindo Persada.
Susilana, Rudi, R. and C. (2009). Media Pembelajaran.
Bandung, Indonesia: CV Wacana Prima.
Sutomo, E. (2007). 9 Presentasi Kreatif dengan
PowerPoint 2007. Yogyakarta: Andi Offset.
Winkel, W. . (2005). Psikologi Pengajaran. Yogyakarta:
Media Abadi.
Does Power Point Matter for Teaching and Learning Economics?
55
