
Wave Analysisi in near Shoreline for Coastal Morphology in Mouth
of Kali Porong Sidoarjo
Mahmud Mustain, Abdul Holil Situmorang, Suntoyo and Sujantoko
Department of Ocean Engineering FTK, Instititute Technology of Sepuluh Nopember (ITS) Surabaya, Indonesia
Keywords: Wave Analysis, Kali Porong, Shoreline.
Abstract: The wave is one of the important parameters in the dynamics of seawaters. Waves can cause energy to form
the beach, sorting sediments, causing the flow and transport of material sediments (sediment transport). This
research was conducted to find out the characteristics of the waveform that occurs around the mouth of Kali
Porong. This study uses data from the meteorological station of Cape Wind Silver during the period of 5 years
from the year 2011 – 2015 with the fetch direction of the dominant East. The calculation of the length of the
fetch effectively amounted to 161968.65 meter with the significant wave height H1/3 and (significant wave
period) T1/3 is 1.26 meters and 7.35 seconds. As for looking for refraction, shoaling and the surge broke the
researcher looking for using three slices that represent characteristics of an existing wave on site research. In
this research obtained for Slice 1 high waves broke 1.5459 meters with a depth of wave broke of 1.8989 m,
Slice 2 high waves broke 1.5458 meters with a depth of wave broke of 1.9181 m, Slice 3 high waves broke
1.5458 meters with a depth of wave burst of 1.9578 m.
1 INTRODUCTION
The Kali Porong (Porong River) canal is one of the
Brantas River in Mojokerto, flows eastward and
empties in the Madura Strait. Figure 1 shows
Location Study of the Coast around the Mouth of the
Kali Porong. The River is limiting Sidoarjo Regency
Pasuruan. This River is the river an artificial Canal
used aliases to redirect a portion of the flow of the
Brantas River that empties in Surabaya. Kali Porong
has two streams namely River Sedati (KP. 100) with
DAS of 406.7 Km2 and River Kambing (KP. 148)
with DAS of 196.6 Km2. The basic conditions are an
irregular river without large stones and shrub. The
natural geology of the Valley River Porong contains
volcanic rocks such as the piedmonte grumosol,
latosol, mediteran and alluvial. In November 2006,
the Government set Sidoarjo mud caused by Porong
Mud disaster in May 2006 is thrown through River
Porong to be streamed to the sea in the Madura Strait.
This has to be one of the causes of the occurrence of
a change of the coastline around the mouth of the
porong times (Mustain, et.al, 2010, 2017, 2018).
In addition to the extra mud from the river one of
the factors that also affect very large changes in the
coastline that is ocean waves. Waves can be caused
by energy to form the beach, sorting sediments,
causing the flow and transport of material sediments
(sediment transport) base towards the shore, offshore,
and along the coast as well as cause the forces acting
on the building of the coast. So the wave data is
indispensable in planning coastal buildings (such as a
jetty, of Groin, seawall, breakwater, reclamation etc.),
determining the layout of the Harbour, cruise and
flow management of the marine environment, and
marine and recreation area determination aquaculture
in the coastal area (Sugianto, 2010). Because of the
importance of the wave data for coastal structure
planning and coastal changes to the feature, then this
research needs to be done to find out the
characteristics of the wave itself. Characteristics of
waves that will be searched in this study i.e. the
refraction of waves and wave shoaling which broke
out. Therefore, the data from the study can be used
for further research needs in order to improve the
development and to estimate the possible happens in
the beach area.
Mustain, M., Situmorang, A., Suntoyo, . and Sujantoko, .
Wave Analysisi in near Shoreline for Coastal Morphology in Mouth of Kali Porong Sidoarjo.
DOI: 10.5220/0008767201890194
In Proceedings of the 6th International Seminar on Ocean and Coastal Engineering, Environmental and Natural Disaster Management (ISOCEEN 2018), pages 189-194
ISBN: 978-989-758-455-8
Copyright
c
2020 by SCITEPRESS – Science and Technology Publications, Lda. All rights reserved
189
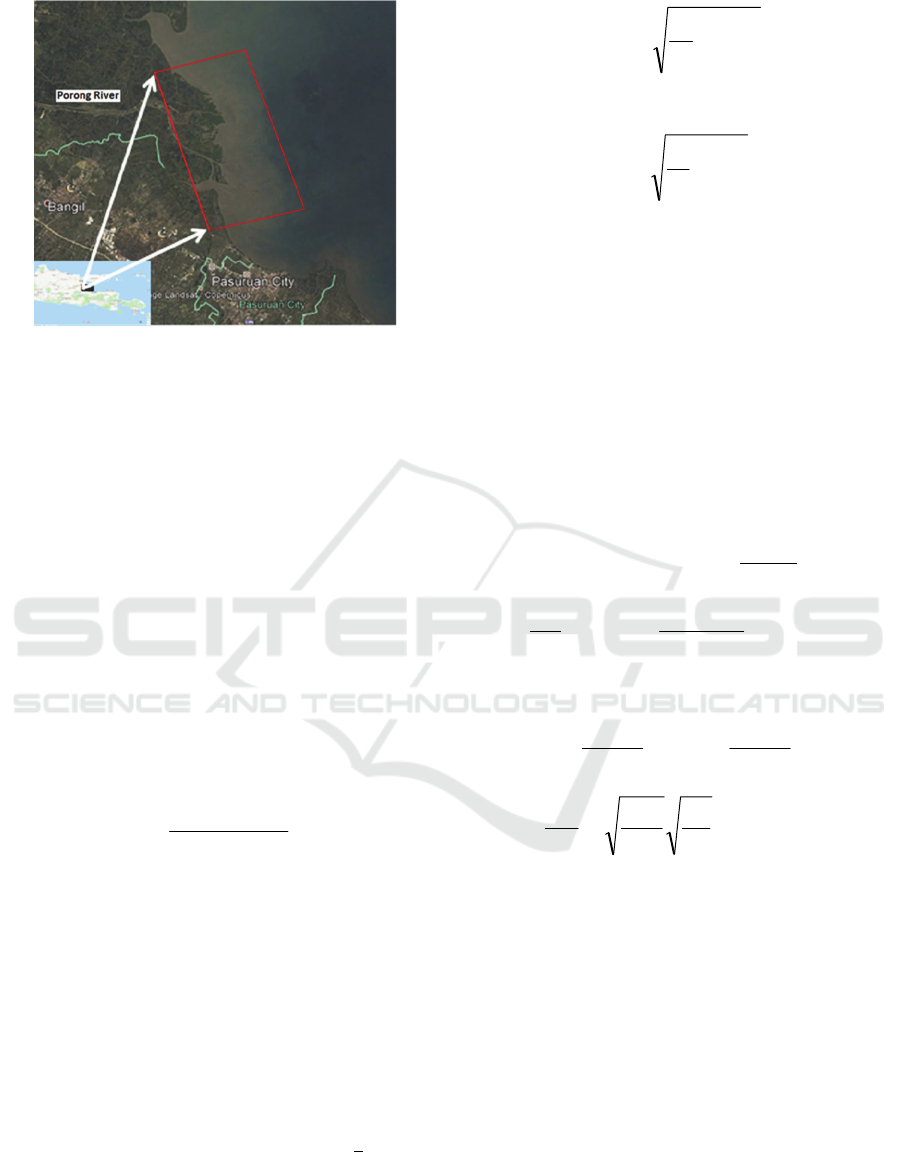
Figure 1: Location Study of the Coast around the Mouth of
the River Porong (Google earth, 2018).
2 THEORITICAL BACKROUND
2.1 Wind Driven Wave
The ripples on the surface water will be generating by
wind driven forces. The bigger of wind blowing will
produce the bigger and the longer of the ripples as
well. For the continuous of the wind, blowing the
ripples will become the wave. The high and the wave
period will depend on the wind velocity (U), time
blowing (t), and length of Fetch (F). The length of
Fetch need the long enough distance due to enough
energy from the wind to drive then to transfer to the
water to become the wave. Fetch formulation have
been given by Triatmojo (1999):
i
ii
eff
X
F
cos
cos
(1)
where:
Feff = Fetch effective
Xi = Length of fetch
αi = Deviation on either side of the wind direction
Using the angles added up to, 6o to 42o on both side
of wind direction, then the wave parameters could be
calculated by deep-sea wave forecasting formulas:
𝐻
5.112 𝑥 10
𝑥 𝑈𝑎 𝑥 𝐹
.
(2)
𝑇
6.238 𝑥 10
𝑥 𝐹_𝑒𝑓𝑓^2/𝑈𝐴
(3)
Where UA is the wind stress factor. These wave
parameters could be used to determine the Hrms,
Trms, H01/3, and T01/3 using the formulation below;
N
i
irms
H
N
H
1
2
1
(4)
𝐻
/
1.416 𝑥 𝐻
(5)
N
i
irms
T
N
T
1
2
1
(6)
𝑇
/
1.42𝑥 𝑇
(7)
2.2 Refraction and Shoaling Waves
To calculate the refraction wave we could use the
formulation from the illustration of orthogonal wave.
Figure 2 illustrates the orthogonal wave. These
formulations are based on the fluxed conservation.
There are;
𝑃0𝑃𝐶𝑜𝑛𝑠𝑡𝑎𝑛𝑡
𝑛0 𝐵0 𝐸0 𝐶0 𝑛 𝐵 𝐸 𝐶
(8)
Where:
𝐸 𝑤𝑎𝑣𝑒 𝑒𝑛𝑒𝑟𝑔𝑦 𝐸
𝜌 𝑔 𝐻
8
(9)
5.0;
2sinh
2
15.0
0
n
kd
kd
C
C
n
g
(10)
Then we could write;
C
gH
nBC
gH
B
88
5.0
2
0
2
0
0
(11)
rs
KK
B
B
nL
L
H
H
00
0
2
(12)
Where;
H0 = height wave in deep sea
H = height wave in site area
L0 = length wave in deep sea
L = length wave in site area
B0 = wide of orthogonal wave in deep sea
B = wide of orthogonal wave in site area
Ks = Shoaling coefficient
Kr = Refraction coefficient
2.3 Breaking Wave
The change of bathymetry near shoreline from the
offshore direction, normally create the slope so
ISOCEEN 2018 - 6th International Seminar on Ocean and Coastal Engineering, Environmental and Natural Disaster Management
190

steeply to the shoreline. This will change the wave
properties due to this slope, the wavelength become
shorter then, before and wave high so become higher.
The ratio between high wave to the length wave is
called by wave steepness. The reduction of wave
steepness is automatically will reduce the wave
stability. When the wave stability become lest then
the minimum, then the wave will automatically break.
This case normally is called the breaking wave. The
wave stability has the formulation (CERC, 1984) of:
b
b
b
m
L
d
LeH
2
tanh095.0
4
max
(13)
m
b
edH
5.3
max
65.0
(14)
Where;
Hmax = the maximum wave height before breaking
(m)
Lb = the wave length when breaking wave in site
location (m)
Db = the depth of the position of breaking wave in
site location (m)
3 DATA COLLECTION
3.1 Bathymetry
Bathymetries map data required to perform the
analysis of refraction, shoaling and changing
coastline. For the analysis of refraction, existing
bathymetries map was divided into several slices,
then to calculate coefficients of refraction and the
characteristics of the breaking wave. As for the
analysis of the changes of coastline, the existing map
first divided into a smaller number of slices. Then
done the measurements to get the initial Y-value (the
distance from the zero point to the shorelines early).
Next, the initial Y-results used in the calculation to
get the Y-end in every step of the time to illustrate the
changes in the coastline at the site of the study.
3.2 Wind
Wind data used in this research is the wind data from
the meteorological station of Tanjung Perak during a
period of 5 years from the year 2011 – 2015. Wind
direction will be stated in the form of eight parts of
the wind direction with the speed in knots. Before the
wind data logging results using WRPLOT, first data
is stored in the form of excel with the first column
containing format date data. The second column
contains the Moon, the third column contains the
year, fourth column contains, and then the fifth and
sixth column contains the direction and speed of the
wind. After that, wind data will be processed using
the program WRPLOT to get the dominant wind
direction and the number of occurrences of the wind
according to the direction and phase.
3.3 Wave
Wave data is necessary to know the quantity and
behaviour of waves heading toward the beach. Wave
data is used based on the conversion of wind data on
surface and land near the location of the research.
In the propagation of a wave to the beach, the waves
undergo a process of change in characteristics such as
height wave and long wave from Pratikto (1996).
Winds that blow across the surface cause disruption
on the surface of the water, the ripples with the
appearance of small waves on the surface of the
water. When the wind speed increases, the ripple will
be even greater when the wind blows continuously
then it will be making waves.
Characteristics of waves include form, height and
period of a wave that is formed depends on the
influence of wind speed (U), wind gusts (t), the length
of the fetch (F), as well as the direction of the wind.
Fetch can be defined as the length of the wave
generation area in the direction of the oncoming wind,
generally limited by the land surrounding the area of
wave generation. The length of the fetch influence on
characteristics of wave, when fetch is getting longer
it will be formed waves with periods of great.
In the form of irregular power, generation areas,
then the calculations can be done effectively fetch and
then the results will be used to predict the
characteristics of waves in the deep ocean.
4 RESULT
4.1 Wind
Wind data analysis is conducted to find out the
dominant wind direction and the number of
occurrences of the wind according to directions. After
wind data obtained, then wind data processed to be
classified. The classified data shows the genesis Wind
around the coast of the estuary of Kali Porong for year
period of 2011-2015 in the shape of event frequency
and percentage respectively.
Wave Analysisi in near Shoreline for Coastal Morphology in Mouth of Kali Porong Sidoarjo
191
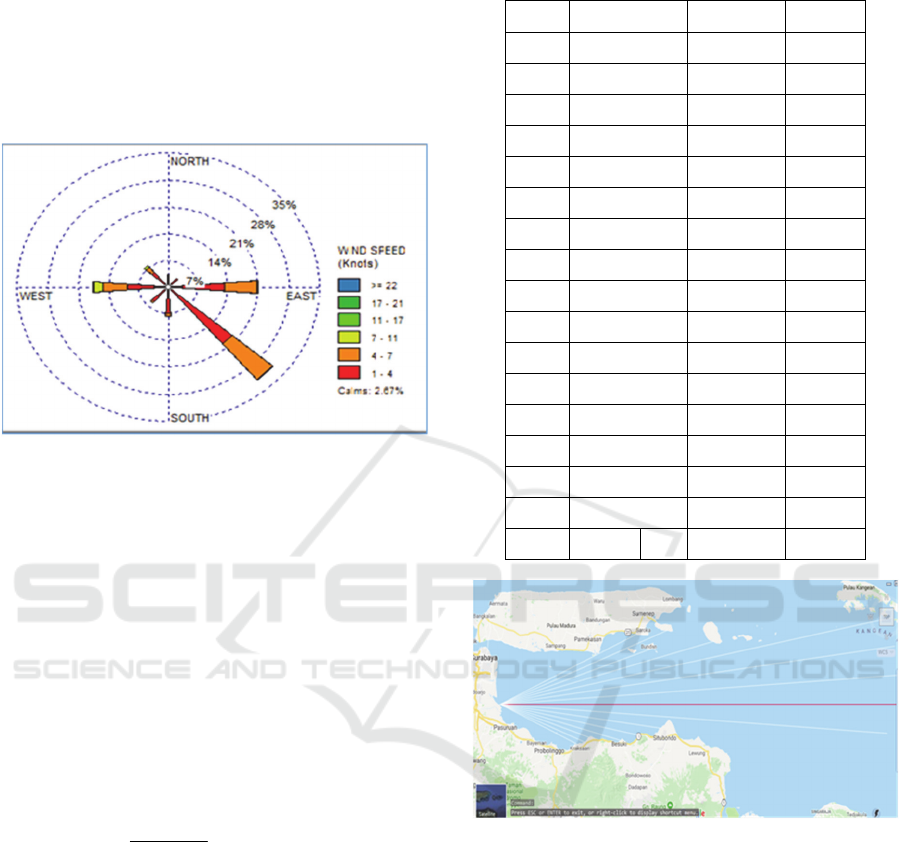
It also can be seen that the dominant wind
direction blows from the southeast with the number
of events 13927, with a percentage of 31.785% of all
events in a period of 5 years. The data above can be
presented in the form of a rose wind. Figure 2 shows
the Rose of the Wind (Tanjung Perak of Maritime
Meteorology Station (2011 - 2015).
Figure 2: Rose of the Wind (Tanjung Perak of Maritime
Meteorology Station 2011-2015).
4.2 Fetch
After the analysis of wind, data and the direction of
the dominant wind are obtained, and then the fetch
length is calculated (length of wave generation area).
Fetch will be longer, a wave with a large period will
be formed. In this research, the biggest fetch become
the dominant wind direction. Therefore, this
calculation uses the fetch of the dominant east
direction. When the waveform generation area is
irregular, then for effective fetch calculation can be
done equation (1) below (Triatmojo, 1999):
m
i
X
eff
F 65.161968
cos
cos
(15)
With:
Feff = fetch effective
Xi = fetch-th line length
αi = deviation on both sides of the wind direction,
dominant by using an increment of 6 ° to an angle of
42 ° on both sides of the dominant wind direction.
Figure 3 shows the map for Effective Fetch
Length Calculation. Fetch effective calculation
results have be presented in table 1.
Table 1: Fetch Effective calculations.
a cos a X
i
(km) X
i
cos a
42 0,74 117,05 86,98
36 0,81 140,47 113,64
30 0,87 126,10 109,21
24 0,91 173,90 158,86
18 0,95 250,00 237,76
12 0,98 250,00 244,54
6 0,99 250,00 248,63
0 1,00 250,00 250,00
6 0,99 250,00 248,63
12 0,98 127,32 124,54
18 0,95 111,67 106,20
24 0,91 97,54 89,10
30 0,87 73,32 63,50
36 0,81 70,84 57,31
42 0,74 66,51 49,43
∑ 13,51 2188,35
F
eff
= 161,97 km 161968,65 m
Figure 3: Map for Effective Fetch Length Calculation.
The value of α0 is the dominant wind direction,
where the study uses the second dominant wind
direction (East) because the fetch is greater than the
direction of the first dominant wind direction. Xi is
the distance from the study location to the nearest
land. Likewise for other angles. After obtaining the
distance for each angle, the effective fetch from the
calculation using equation (1) is 161.96865 km. The
next step is to change the data from the land recording
(UL) to the sea wind speed data (Uw) to find the value
of RL that can be obtained by plotting UL values into
the characteristic graph. Then to calculate the H0, T0,
Hrms, Trms, H1/3, T1/3, could be used the
formulation of 2 till 7. Table 2 and 3 show the result
of the calculation.
ISOCEEN 2018 - 6th International Seminar on Ocean and Coastal Engineering, Environmental and Natural Disaster Management
192
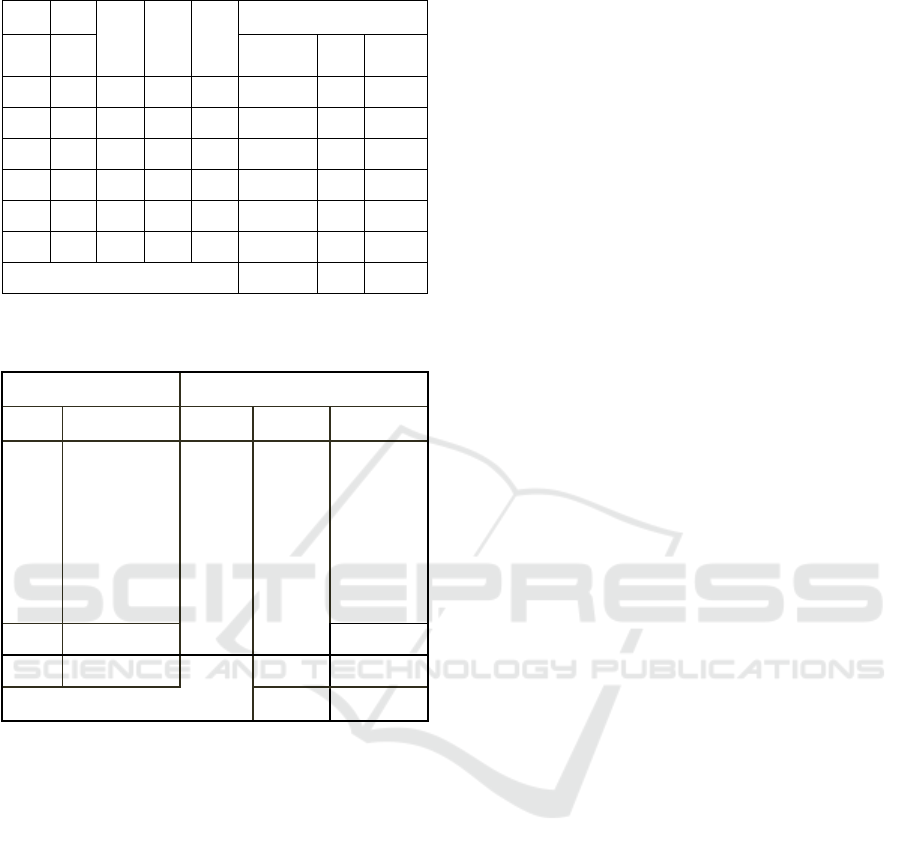
Table 2: The calculation of H0 and T0.
U
L
U
L
R
L
U
W
U
A
315
0
Knots m/s m/s m/s F eff (m)
H
0
(m)
T
0
(s)
4
2,06 1,68 3,46 3,27 161968,65 0,67 4,83
7
3,61 1,47 5,30 5,52 161968,65 1,14 5,74
11 5,67 1,31 7,42 8,35 161968,65 1,72 6,58
17 8,76 1,13 9,89 11,90 161968,65 2,45 7,40
21 10,82 1,05 11,36 14,10 161968,65 2,90 7,82
22 11,33 1,04 11,78 14,75 161968,65 3,04 7,94
∑ 8,88 32,37
Table 3: The calculation of Hrms (Significant wave height)
and T1/3 (Significant wave period).
90
o
H
0 1/3
(m) = 1.42 x Hrms
N
n x H
0
2
(m)
Hrms
H
0 1/3
(m) n x T
0
2
(s)
28889 13068,81
0,8840 1,2553
673878,62
12342 15925,85 406869,50
1361 4021,12 58972,88
52 311,64 2845,52
0 0,00 0,00
0 0,00 0,00
42644 33327,41 1142566,52
Hrms 0,88404
Trms
5,1762
T
0 1/3
(s)
7,3502
From the calculation results in Table 2, the values
of H1/3 and T1/3 are 1.26 meters and 7.35 seconds,
next for analysis of; Refraction, Shoaling, and
Breaking Waves. To perform analysis of refraction,
shoaling, and breaking waves used calculations in
Excel programs.
4.3 Breaking Wave
For analysis of; shoaling, refraction, and breaking
waves the input and assumptions used are one (1.0).
The wave data used is significant wave data obtained
from wind wave forecasting (Table 2). Coastal slope
is obtained from the height difference between
contours being reviewed divided by the distance
between the depth contours obtained from the
bathymetry map, which is then processed in the
AutoCAD system. The wave direction of calculated
result is from the Southeast. The seabed contour is
considered parallel to the coastline.
The study area have been divided become three
slices in order to calculate the slope. These calculated
slopes for each slice are; 0.0064, 0.0046, and 0.0018.
The largest distance of breaking wave from these
three slices is around it that about 1200 meter from
the shoreline perpendicular to the offshore direction.
5 DISCUSSION
Regarding to the East of dominant wind direction, the
distance as fetch effective for this direction is limited
to 250 km as a maximum fetch due to no boundary
such as island. The result of H1/3 and T1/3 are 1.26
meters and 7.35 seconds is a typical for the Madura
Strait. Annually, this dominant wind will create the
wave that furthermore to produce the near shoreline
current that have parallel direction to the shoreline.
This current normally called long shore current. In
this case, of shoreline profile, the long shore current
will flow from South to North direction.
Related to the breaking wave, the slope of
bathymetry causes the range of distance where the
breaking wave wills accordance. This research area
have been divided become three slices. These slopes
for each slice are; 0.0064, 0.0046, and 0.0018. The
distance furthest of breaking wave from these three
slices is around 1200 meter from the shoreline
perpendicular to the offshore direction. On the other
hand, the nearest distance of breaking wave from
these three slices is gradually difference the bigger of
slope the nearest distance. The largest slope, i.e.
0.0064 makes nearest distance of breaking wave of
200 meter from the shoreline perpendicular to the
offshore direction. While the smallest slope, i.e.
0.0018 makes shortest distance of breaking wave of
680 meter from the shoreline perpendicular to the
offshore direction as well. This information may
useful for related stakeholders, for instance; to
designer of coastal eco-truism planning, to local
fisheries for finding the certain fish (Mustain, et.al,
2015; Mustain, 2016; Fauzi, et.al, 2017; Mustain,
et.al, 2018).
6 CONCLUSION
The results of the analysis and calculations have been
carried out; some conclusions can be drawn as
follows:
1. The dominant wind direction in the study used in
the effective fetch calculation is the east dominant
Wave Analysisi in near Shoreline for Coastal Morphology in Mouth of Kali Porong Sidoarjo
193

direction with the effective fetch value in this
research location at 161.96865 km.
2. Significant wave height H1/3 and (significant wave
period) T1/3 at the location of this study is 1.26
meters and 7.35 seconds.
3. The height of the breaking wave for slice 1 is
1.5459 meters with a breaking wave depth of 1.8989
m; the height of the wave breaking for slice 2
amounting to 1.5458 meters with a breaking wave
depth of 1.9181 m, the breaking wave height for slice
3 is 1.5458 meters with a breaking wave depth of
1.9578 m.
ACKNOWLEDGEMENTS
The authors thank the Directorate of Empowering of
smaller islands, Directorate General Ocean and Small
Islands of the Ministry of Fisheries on support of
provided data up to this paper then could be finished
very well. This research was also supported by the
Minister of Research and Technology (Indonesia) and
LPPM-ITS. Therefore, the authors thank and
appreciate both institutions for the funds.
REFERENCES
B. Triatmodjo, 1999. Teknik Pantai, Beta Offset,
Yogyakarta.
CERC., 1984. Shore Protection Manual Volume I * II.U.S
Army, Coastal Engineering Research Centre,
Washington.
D. N. Sugianto, 2010. Maritime. Jour. 15, 3, 143-152.
M. Mustain, A. Sufyan, R. Akhwady, 2018. Int. Jour.
Civ.Eng- Techn. (IJCIET), 9, 2, 565–576.
M. Mustain, 2016. Jour. Appl. Mech.-Mate. (AMM), 836,
236, 239-244.
M. Mustain, 2017. Int. Jour. Eng-Appl. Sci. (IJEAS), 4, 11.
M. Mustain, 2018. Int. Jour. Civ.Eng- Techn. (IJCIET), 9,
1, 688–701.
M. Mustain, D.A. Haryo, T. K. Danu, 2015. Proc. Earth-
Plan.Sci., 17-24.
M. Mustain, R. I. Salim, Sholihin, Sujantoko, 2010. IPTEK,
Jour. Tech. Sci. 21, 7.
M. A. R., Fauzi, D. A. Haryo, M. Mustain, A.R. Amalia,
2017. The Third International Conference on Civil
Engineering Research (ICCER), Surabaya-Indonesia.
W. A. Pratikto, 1996. Coastal Protection Structure, ITS FTK
Surabaya.
ISOCEEN 2018 - 6th International Seminar on Ocean and Coastal Engineering, Environmental and Natural Disaster Management
194
