
Application of Weighted Objective Method in Searching Appropriate
Teaching Aids for Lecturing Column Buckling in Mechanical
Engineering Department of Andalas University
Eka Satria
1
, Jhon Malta
1
, and Hendery Dahlan
1
1
Mechanical Engineering Department, Faculty of Engineering, Andalas University, Padang, Indonesia
Keywords: Teaching Aids, Weighted Objective, Column Buckling.
Abstract: This paper shows how the appropriate teaching aid was selected in lecturing column stability (buckling),
which is considered as the most challenging topic in the subject of Strength of Materials in Mechanical
Engineering Department of Andalas University. However, most students are not interested in this topic as it
contains a number of mathematical derivations. Teaching aid such as a presentation of materials and figures
taken from reference books are not able to stimulate student’s interest in the topic. In order to select the best
way to explain theoretical concepts without making students bored, the teaching staffs are suggested to use
the teaching aid which can stimulate the curiosity of students. For this reason, this paper describes how to use
a weighted objective method in determining appropriate teaching aids for the intended topic. The method is
usually applied based on several criteria of evaluation, decided by both students and teaching staff. The criteria
should be able to fulfill all the demands of the students and the teaching staff. The selected teaching aid
theoretically should be able to increase students' curiosity and understanding of students about the topic.
1 INTRODUCTION
The Strength of Material is one of the compulsory
courses which is offered by a curriculum of bachelor
degree program of Mechanical Engineering
Department of Andalas University. It has 3 credits
and has 12 topics. According to the survey given to
the students, the most challenging topic in this subject
is the column buckling. The main reason for this fact
is that the topic has too many mathematical
derivations. Besides, most students are not good at
mathematics. On the other side, the current teaching
aids, such as material presentation and reference
books are still traditional aids; they are not able to
stimulate students’ interest in this topic.
In addition, the class size which is big also made
the situation worse. That is why in the current
situation, the class is quite boring for some students.
Most of the science teachers do not pay attention to
scientific and technological methods, and this reflects
the difficulties that are teaching science (Nasab,
Esmaelli, and Sareem, 2015). Since 75% of learning
is learned by sight and vision, therefore the use of
technological teaching aids are considered very
efficient to achieve student’s attention.
Shabiralyani (Shabiralyani, et.al, 2015) explored
the opinions of selected teachers on the use of visual
aids as a motivational tool in enhancing students’
attention in reading literary texts in the district of
Dera Gazi Khan. The results show that 70% of the
students and teachers agree that the visual aids help
in motivation; 75% agree that they help in
clarification of contents under researching; 68%
agree that they increase the vocabulary; 82% agreed
that they help save the time in preparing the lessons;
71% agree that they help avoid the dullness; and 92%
agree that through visual aids the direct experience
increased to observe the things.
Although there are many works have been done
related to the effectiveness of the use of teaching aids
in teaching, there is still a few works which
investigate how to select the best teaching aid among
many available aids. Edward (2008) used four
specific criteria to evaluate learning resources. The
criteria are content, instructional design, technical
design, and social considerations. The criteria are
intended to encourage teaching staffs to think
critically about the resource and evaluate some of its
more detailed aspects. Andambi and Kariuki (2013)
describes several criteria for selecting relevant
22
Satria, E., Malta, J. and Dahlan, H.
Application of Weighted Objective Method in Searching Appropriate Teaching Aids for Lecturing Column Buckling in Mechanical Engineering Department of Andalas University.
DOI: 10.5220/0008678700220028
In Improving Educational Quality Toward International Standard (ICED-QA 2018), pages 22-28
ISBN: 978-989-758-392-6
Copyright
c
2019 by SCITEPRESS – Science and Technology Publications, Lda. All rights reserved
learning resources by teachers of social education and
ethics in Bungoma District, Kenya. However, the
selection was done only for available learning
resources, and the main criteria are based on the
relevancy of teaching resources with the subject of
the lecture.
This paper focussed on how to select an
appropriate teaching aid for a lecturer to teach column
stability. The aim is to select the best teaching aid to
stimulate students' interest in the topic and to involve
the student’s role when the aid is used. In order to
understand this current problem properly, two quick
surveys were given to the students. The first is aimed
to see the students' level of understanding to the topic
of column buckling. The data are taken from the
students who took a subject the Strength of the
Material in even semester 2017/2018. The result of
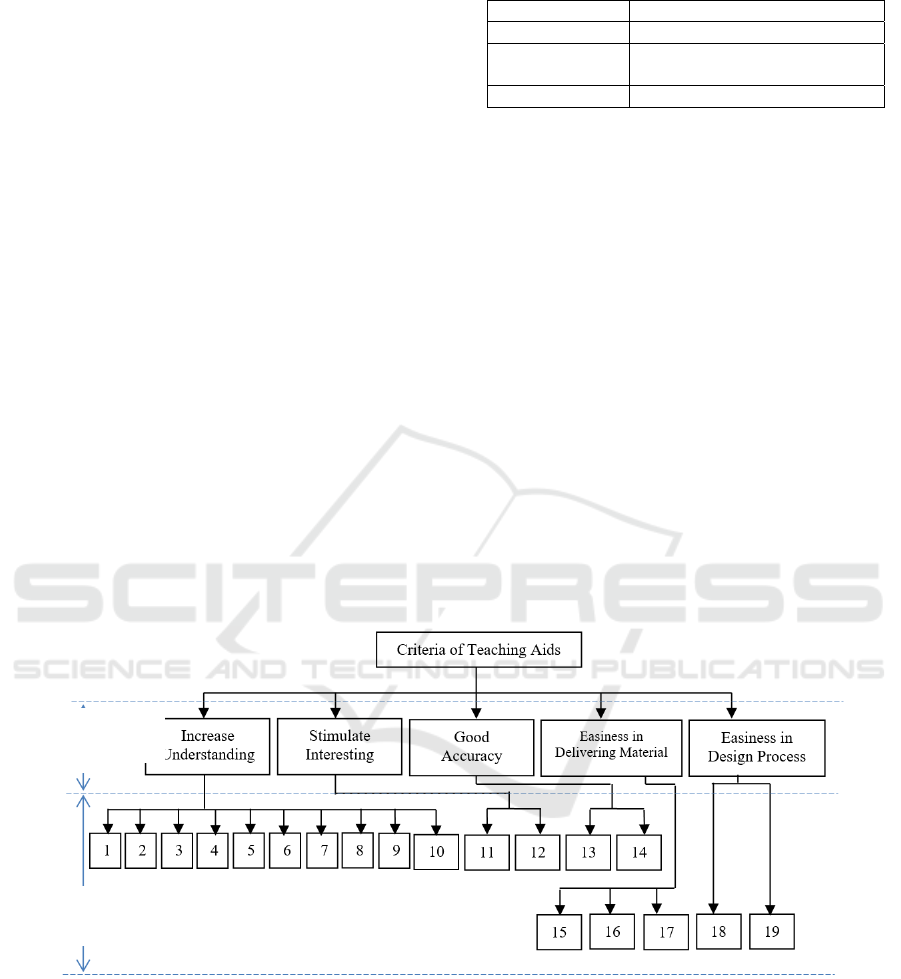
this survey is given in Fig.1, showing that about
61.5% of the students are in the medium, weak, and
very weak level of understanding. Only 38.5% of the
students are in good and very good level of underst .
It means that in general the course outcome is not
reached yet.
Figure 1: Level of understanding of students for the topic of
column buckling.
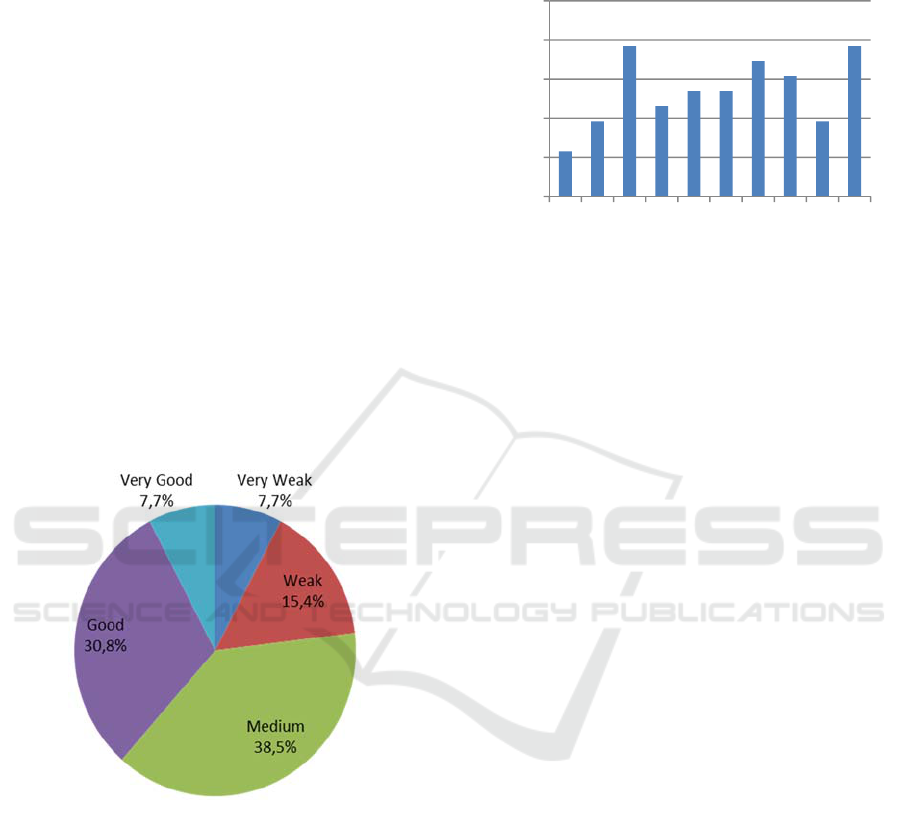
The second survey is aimed to determine which area
of the topic of structural stability is considered very
difficult for the students. Fig. 2 shows the list of
difficult sub-topics chosen by students in
understanding the concept of column buckling. The
result shows that the six sub-topics with the number
of choices greater than 50% of the total survey are:
Q3 (76.9%), Q10 (76.9%), Q7 (69.2%), Q8 (61.5%),
Q5 and Q6 (both are 53.8%). The detail description
of sub-topics can be seen in Fig. 2. Based on this
condition, the criteria of teaching aid should be based
on these 6 sub-topics. Other criteria, from the
perspective of the students and the teaching staff, are
discussed later.
Figure 2: List of difficult topics chosen by students in
understanding column buckling.
Q1. How does column buckling occur?
Q2. How to calculate the theoretical and
critical buckling load?
Q3. How to determine the mode shapes of
buckling?
Q4. How the geometrizal sizes and shapes
affect the critical buckling load?
Q5. How to determine the direction of
buckling?
Q6. :How the types of support can affect the
critical buckling load?
Q7. How the geometrical imperfections can
affect the critical buckling load?
Q8. How the eccentricity of load can affect the
critical buckling load?
Q9. How to determine the minimum length of
the column that create the buckling?
Q10. How to use the standards such as CRC,
AISC in determining the critical buckling
load?
As a number of criteria must be considered in this
selection, it is essential to have a specific method for
evaluation. This method should be able to guide the
selection for the best result. Thus, this paper adopts a
weighted objective method (WOM), a well-known
method for evaluation solutions in the procedure of
design, to evaluate all the used criteria in the design
process. WOM is frequently used to evaluate several
alternatives and to select the best alternative based on
several evaluation criteria (Diaz and Diaz, 2015;
Kota
and Chakrabakti, 2007; Hongjiu and Yanrong, 2015)
23,1
38,5
76,9
46,2
53,8 53,8
69,2
61,5
38,5
76,9
0,0
20,0
40,0
60,0
80,0
100,0
Q1 Q2 Q3 Q4 Q5 Q6 Q7 Q8 Q9 Q10
Application of Weighted Objective Method in Searching Appropriate Teaching Aids for Lecturing Column Buckling in Mechanical
Engineering Department of Andalas University
23
2 METHOD AND GENERATING
ALTERNATIVES
The method of weighted objectives aims to compare
the utility values of alternative designs, by
performance against differentially weighted
objectives [8]. The procedure is as follows: (i).list
design objectives or evaluation criteria, (ii). Rank
order the list objectives, (iii). Assign relative
weightings to the objectives, (iv). Establish
performance parameters or utility scores for each of
objectives, and (v).calculate and compare the relative
utility values of the alternative designs and multiply
each parameter score by its weighted value. The best
alternative has the highest sum value comparison and
discussion of utility value profiles may be a better
design aid than simply choosing the best.
There are three types of alternatives of the
teaching aids which are selected: 3D_Model,
Program_Simulation, and Poster, as shown in Table
I. The 3D_Model is a prototype of a column structure
under axial loading, the Program_Simulation is result
of a computational program in the form of animation
and video, and the Poster is a group of figures or
pictures with a simple explanation about the
characteristics of column buckling.
Table 1: Types of Alternatives to Solution
Types Description
3D_Model 3D Real Model of Column
Program
Simulation
Video and Animation from
Numerical Program
Poster Pictures/ Figures
3 RESULT AND DISCUSSION
3.1 Evaluation Criteria
The general criteria are taken from some
considerations in the perspective of students,
lecturers, and easiness of design process. The best
method to derive the criterion of evaluation is through
the application of the objective tree method (OTM).
The OTM offers a clear and useful format for such a
statement of objectives (Cross, 2000). It shows a
diagrammatic form how different objectives are
related to each other, and the hierarchical pattern of
objectives and sub-objectives. The procedure of this
method is listed as follows: (i) prepare a list of design
objectives, (ii) order the list into sets of higher-level
and lower-level objectives, and (iii) draw a
diagrammatic tree of objectives showing hierarchical
relationship and interconnections.
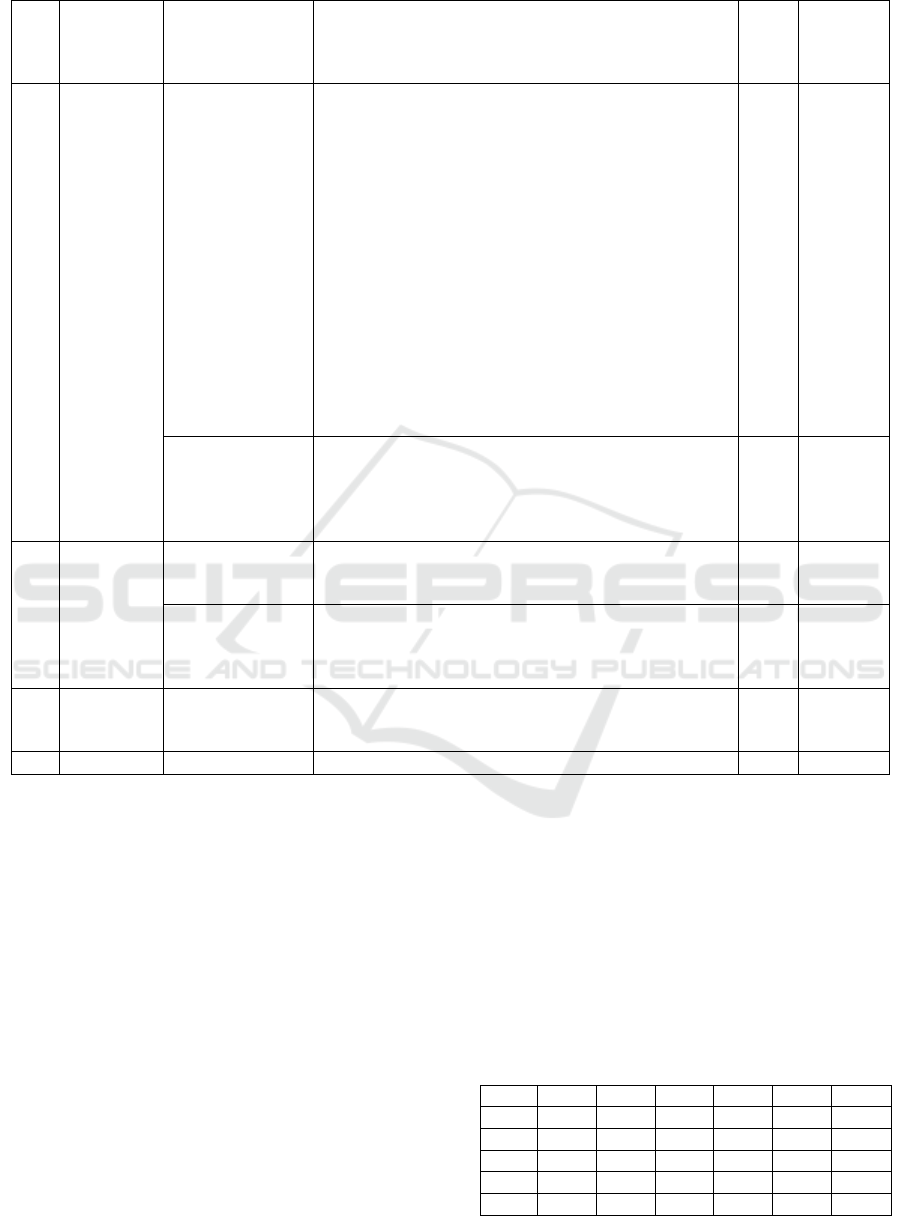
Fig. 3 Finding EC through the application of the objective tree method
High
Level
Low
Level
ICED-QA 2018 - International Conference On Education Development And Quality Assurance
24
Tabel 2. Criteria of Evaluation of Teaching Aids
No. Perspective Criteria of
Evaluation
(High-Level
Objectives)
Sub Criteria of Evaluation (Low-Level Objectives) Rank Weighted
Factor
(%)
1. Students
(60%)
EC1: Ability to
Increase
Student’s
Understanding
(50%)
SC1. How does buckling of the column occurs?
SC2. How to calculate the theoretical critical buckling
load?
SC3. How to determine the mode shapes of buckling?
SC4. How do the geometrizal sizes and shapes affect
the critical buckling load?
SC5. How to determine the direction of buckling?
SC6. How the types of support can affect the critical
buckling load?
SC7. How the geometrical imperfections can affect the
critical buckling load?
SC8. How the eccentricity of load can affect the
critical buckling load?
SC9. How to determine the minimum length of
column that create the buckling?
SC10. How to use standards such as CRC, AISC in
determining the critical buckling load?
1 2%
4%
6%
4%
2%
6%
6%
6%
4%
10%
EC2: Ability to
Stimulate
Student;s
Interesting
(10%)
SC11. Interesting Appearance
SC12. Easy to Understand
4 4%
6%
2. Teaching
Staffs
(32%)
EC3: Good
Accuracy
(20%)
SC13. Good in accuracy
SC14. Easy to show the basic phenomena of buckling
2 10%
10%
EC4: Easiness in
Delivering
Material
(12%)
SC15. Easy to use
SC16. Safe to use
SC17. Easy to bring and operate
3 4%
4%
4%
3 Design
Process
(8%)
EC5: Design
Process
(8%)
SC18. Easy to make
SC19. Cost
5 4%
4%
=100% =100%
=100%
Figure 3 shows 5 criteria (EC) of evaluation (as
higher-level objectives). They are (i) ability to
increase student’s understanding; (ii) ability to
stimulate student’s interesting; (iii good in the
accuracy, (iv) easiness in delivering material of
lecture, and (v) easiness in the design process. From
these five criteria, 19 sub-criteria (SC1-SC19) of
evaluation, as lower-level objectives, to evaluate the
appropriate teaching aid is derived. Ten sub-criteria
is from the derivation of EC1, two from EC2, two
from EC3; three from EC4; and two from EC5. A
detailed description of SC can be seen in Table 2.
3.2 Rank Order of Evaluation Criteria
The next step is to give a rank order for EC. For this
purpose, the level of importance of each criterion will
be compared to each other. For example, if the first
criterion is decided more important than the second
one, the first will be given a score “1” while the
second will be given a score “0”. Then the
comparison is continuously repeated for other
criterions. In the end, the highest rank order is given
to the highest score, as the most important criterion
among all criteria. In contrary, the lowest rank order
is given to the criterion whose score is the lowest.
From Table II, the rank order of EC is started by EC1,
EC3, EC4, EC2 and the last by EC5..
Table 3. Simple Method of Rank Order of EC
EC1 EC2 EC3 EC4 EC5 Total
EC1 - 1 1 1 1 4
EC2 0 - 0 0 1 1
EC3 0 1 - 1 1 3
EC4 0 1 0 - 1 2
EC5 0 0 0 0 - 0
Application of Weighted Objective Method in Searching Appropriate Teaching Aids for Lecturing Column Buckling in Mechanical
Engineering Department of Andalas University
25

The next step is to give a weighted factor (WF) for
each EC. Off course, the highest rank is assumed to
have a higher percentage than the lowest one. From
Table II, the WF of each EC is 50% for EC1, 20% for
EC3, 12% for EC4, 10% for EC2 and 8% for EC5
(totally 100%).
The same procedure is also applied to all
subcriteria (SC) for each EC. Therefore, every SC
should also have their weighted factor, as shown in
the last column in Table II.
3.3 Establish Performance Parameters
For each SC, a scale with a range between 1 to 5
is used as a score of performance. A score of 1 shows
the worst condition, 3 shows medium condition, and
5 shows the best condition, as shown in Table IV.
Table V shows the description of the performance of
each SC and scales to measure the performances. The
values later are called ‘utility values’ (see Tabel VI).
The utility value is given based on the performance of
evaluated alternatives for each SC. For example, SC-
16: Safe to Use, where 3D_Model is given 3 points
(medium), Program_Simulation is given 5 points (the
safest), and the poster is given 4 points (between
medium and the safest).
Tabel 4. Criteria of Evaluation of Teaching Aids
Score Description
1
Not Understand/Ugly/Most Expensive/ Not
Safe
2
3 Medium
4
5 Very Understand/Good/Cheap/Very Safe
Tabel 5. Performance Parameters
Score Description
SC1-
10
5: Most Difficult, 3: Medium, 1:Easiest
SC11 5: Most Interesting, 3: Medium, 1:Ugliest
SC12 5: Easiest, 3: Medium, 1: Most Difficult
SC13
5: Very Accurate, 3: Medium, 1:Not
Accurate
SC14
SC15
SC16
SC17
SC18
SC19
5: Easiest, 3: Medium, 1: Most Difficult
5: Easiest, 3: Medium, 1: Most Difficult
5: Safest, 3: Medium, 1: Most Dangerous
5: Easiest, 3: Medium, 1: Most Difficult
5: Easiest, 3: Medium, 1: Most Difficult
5: Most Expensive, 3: Medium, 1: Cheapest
3.4 Comparison of Alternative Solutions
The value of each SC is given from
multiplication of WF and utility values. Again, if SC-
16 is taken as an example, the value 3D_Model is
4%×3=0.12, Program_Simulation is 4%×5=0.20, and
Poster is 4%×4=1.6. The same procedure is given for
the other SCs. Table VI shows the result of evaluation
using the method of WOM. Based on this method, the
best teaching aid for lecturing the column buckling is
through program simulation, because the relative
utility value of this program simulation is the highest
among the others. Its value is about 4.18 compared to
3.18 for 3D_Model and 3.56 for Poster, in the scale
of 1 to 5.
3.5 Actual Design
Based on the result, the next step is preparing
some data for computational programming based on
finite element analysis to make a numerical
simulation which is later used as a part of lecturing
video. This video can show several characteristics
asked by EC1 and EC3. Both ECs are criteria of
evaluation which cover some technical aspects of
column buckling. There are some procedures for this
work as generally described in the following section:
(1). Prepare numerical models of the column. It
must be in a variety of lengths (slenderness
ratios) and also types of cross-sections. This
step is prepared for SC4.
(2). Prepare numerical models of a variation of
supports for column (pin-roller, clamped-
roler, and clamped-clamped). This step is
prepared for SC3 and SC6.
(3). Prepare a variety of geometrical imperfections
to the length of columns. This step is prepared
for SC7.
(4). Prepare a variation of eccentricity loads to the
columns. This step is prepared for SC7.
(5). Prepare material properties of the column.
Use a finite element package software to calculate the
buckling loads.
ICED-QA 2018 - International Conference On Education Development And Quality Assurance
26
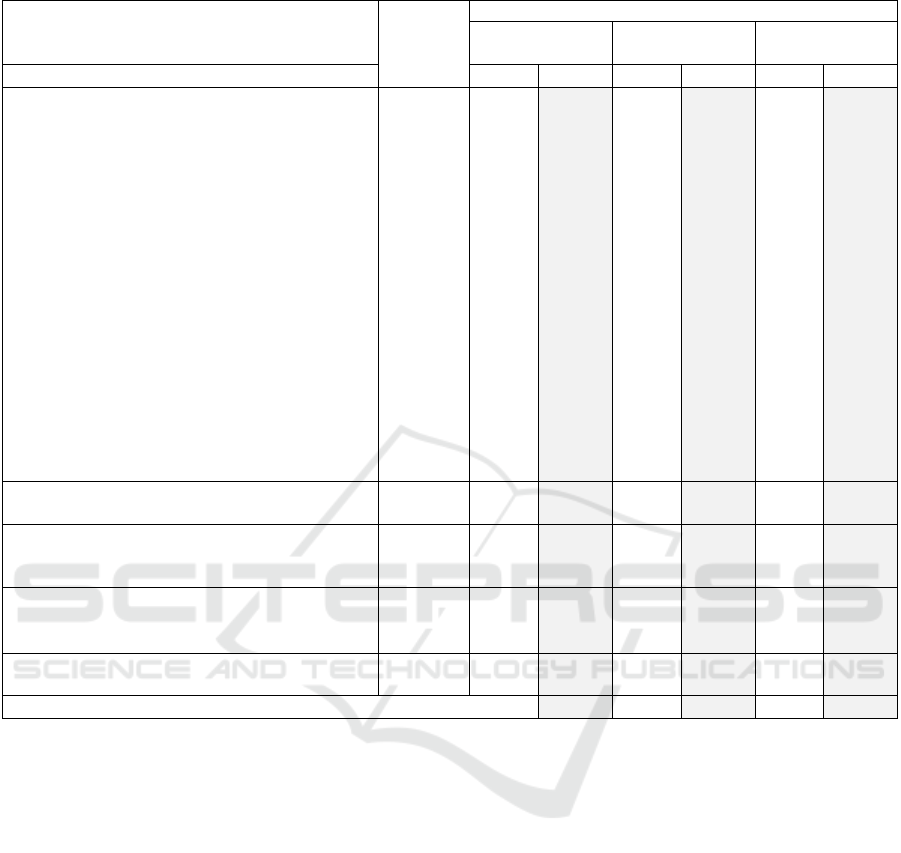
Table 6. The result of Total Grade for Every Alternative solution
Subcriteria of Evaluation (SC)
Weighted
Factor
(%)
Alternatives of Solution
3D_Model
Program
Simulation
Poster
Utility Value Utility Value Utility Value
SC1. How buckling of column occurs?
SC2. How to calculate the critical buckling load?
SC3. How to determine the mode shapes of
buckling?
SC4. How the geometrizal sizes and shapes
affect the critical buckling load?
SC5. How to determine the direction of
buckling?
SC6. How the types of support can affect the
critical buckling load?
SC7. How the geometrical imperfections can
affect the critical buckling load?
SC8. How the eccentricity of load can affect the
critical buckling load?
SC9. How to determine the minimum length of
column that create the buckling?
SC10. How to use the standards such as CRC,
AISC
SC11. in determining the critical buckling load?
2%
4%
6%
4%
2%
6%
6%
6%
4%
10%
4
2
3
2
4
4
3
3
2
2
0,08
0,08
0,18
0,08
0,08
0,24
0,18
0,18
0,08
0,2
5
2
5
4
3
4
5
5
5
4
0,1
0,08
0,30
0,16
0,06
0,24
0,3
0,3
0,2
0,4
2
4
3
3
2
3
4
4
4
4
0,04
0,16
0,18
0,12
0,04
0,18
0,24
0,24
0,16
0,4
SC12. Interesting Appearance
SC13. Easy to Understand
4%
6%
3
4
0,12
0,24
5
4
0,2
0,24
2
3
0,08
0,18
SC14. Good in accuracy
SC15. Easy to show the basic phenomena of
buckling
10%
10%
4
4
0,4
0,4
4
4
0,4
0,4
4
3
0,4
0,3
SC16. Easy to use
SC17. Safe to use
SC18. Easy to bring and operate
4%
4%
4%
4
3
3
0,16
0,12
0,12
5
5
5
0,2
0,2
0,2
4
4
4
0,16
0,16
0,16
SC19. Easy to make
SC20. Cost
4%
4%
3
3
0,12
0,12
2
3
0,08
0,12
5
4
0,20
0,16
Skor Total
=3,18
=4,18
=3,56
(6). Convert the results to numerical animation
forms using post-processor software.
(7). Compare the results to the variation of
standard designs. This step is prepared for
SC10.
(8). Use all animations, resulted in figures, result
of the comparison to design standards to
produce a lecturing video which is very
interesting in visual.
(9). Asked students in a group to prepare their data
to create their animation.
4 CONCLUSION
Through this paper, the method in how to select the
best teaching aid for teaching column buckling in the
subject of strength of the material is detailly
described. The result shows how the simulation of the
program is selected as the best teaching aid based on
several criteria given by students, teaching staffs and
design process. They are (i) ability to increase
student’s understanding (weighted factor=50%); (ii)
ability to stimulate student’s interesting (weighted
factor=10%); (iii) good in accuracy (weighted
factor=20%), (iv) easiness in delivering material of
lecture (weighted factor=12%); and (v) easiness in
design process (weighted factor=8%).
ACKNOWLEDGMENT
This paper is funded by Andalas University through a
research grant for improving teaching-learning
effectiveness. The research grant is provided by
LP3M of Andalas University in the 2018 financial
year.
Application of Weighted Objective Method in Searching Appropriate Teaching Aids for Lecturing Column Buckling in Mechanical
Engineering Department of Andalas University
27

REFERENCES
Andambi, R., and Kariuki, B, 2013. Criteria for Selecting
Relevant Learning Resources by Teachers of Social
Education and Ethics in Bungoma District, Kenya,
Journal of Emerging Trends in Educational Research
and Policy Studies, Vol. 4(1): 133-140.
Cross, N. 2000. Engineering Design Methods: Strategies
for Product Design. John Wiley & Sons, Ltd, 3rd
Edition.
Diaz, W.P., Diaz, A.P. 2015. Design Methodology for the
Selection of the Best Alternative of Industrial Machine
Maintenance for Time Reduction, INGE CUC, Vol.
Edward, Prince. 2008. Evaluation and Selection Learning
Resources, Education and Early Childhood
Development English Programs.
Hongjiu, L., and Yanrong, H. 2015. An Evaluating Method
with Combined Assigning-Weight Based on
Maximizing Variance. Hindawi Publishing Corporation
Scientific Programming.
Kota, S., andChakrabakti, A. 2007. A Method of
Comparative Evaluation of Product Life Cycles
Alternatives under Uncertainty, International
Conference on Engineering Design (ICED) Paris,
France, August 2007.
Nasab, M.Z, Esmaelli, R, Sareem, HN. 2015. The Use of
Teaching Aids and Their Positive Impact on Student
Learning Elementary School, International Academic
Journal of Social Sciences Vol. 2, No. 11, pp. 22-27.
Shabiralyani, G., Hasan, K.S., Hamad, N, Iqbal, N. 2015.
Impact of Visual Aids in Enhancing the Learning
Process Case Research: District Dera Ghazi Khan,
Journal of Education and Practice, Vol.6, No.19 11(2):
18-26.
ICED-QA 2018 - International Conference On Education Development And Quality Assurance
28
