
Experimental Study on the Analysis of the Use of Forward and Rearward
Wingtip Fences 90
◦
Cant Angle on Wing Airfoil Eppler 562
Bayu Dwi Cahyo
1,2
∗
, Sutardi
1
and Setyo Hariyadi
1,2
1
Fluid Mechanic Laboratory, Mechanical Engineering Department, FTI, ITS, Surabaya, Indonesia
2
Aviation Polytechnic of Surabaya, Surabaya, Indonesia
Keywords:
Wingtip Fence, Eppler 562, Oil Flow Visualization, C
L
/C
D
.
Abstract:
This research is a detailed experimental study on aerodynamic characteristics for wing model airfoil Eppler
562 with and without wingtip. There are two types of wingtip fences at variations that will be used in this
research that are rearward and forward wing tip fence set at cant angle 90
◦
. The chord length of the airfoil is 72
mm and the span length is 300 mm. The Reynolds (Re) number used is 2.3× 10
4
(U
∞
= 10 m/s) with angle of
attack variations (α) = 0
◦
to 19
◦
. For this research, pressure distributions over the airfoil were measured using a
pressure transducer. Moreover, measurements lift and drag forces of the airfoil were obtained by using a load-
cell system. Oil flow visualization method was used to represent the surface flow patterns. The experimental
results showed that as the angle of attack increased, the separation and the transition points moved towards the
leading edge at all models. Furthermore, for airfoil with forward wingtip fence with cant angle 90
◦
C
L
/C
D
is
better than for airfoil with rearward wingtip fence with cant angle 90
◦
and plain wing. Forward wingtip fence
showed the best optimum performance of α = 10
◦
settings compared to the other models.
1 INTRODUCTION
The development of aviation technology is currently
growing a rapid and promising, especially in the de-
sign of aerodynamic forms of aircraft. The outer edge
of the wing (wingtip) is one part that has an impor-
tant role in aircraft. Wingtip design will affect the
air flow conditions along the wingspan which will af-
fect the lift coefficient and drag coefficient to improve
aerodynamic performance of aircraft(Sutrisno et al.,
2015). One important thing to note in the design of
a plane is the selection of an airfoil and its modifi-
cations. The advantages of the optimal design are a
reduction in drag and increasing in lift. The main
parameter of wing performance is the C
L
/C
D
ratio.
The wing design is considered good if it has a high
value of C
L
/C
D
ratio. The low value of C
L
/C
D
ratio
is caused by flow separation followed by wake and
vortex occurring on wingtip. Flow separation occurs
due to excessive adverse pressure gradient (APG) and
friction effect. Next, the tip vortex is circular pattern
of air flows from below the wing to the top of the wing
around the wingtip. Separation and vortex are two
phenomena that increase drag component and reduce
lift due to reduce the wingspan effectiveness. One at-
tempt to reduce the vortex is delaying the separation.
Another attempt is wingtip modifications by addition
of winglet.
Turanoguz and Alemdaroglu (2015) performed a
numerical simulation on airfoil type Eppler 562 by
varying winglet in the form of shifted downstream
type wingtip, hoerner type wingtip, and blended type
wingtip. In the research, it was showed that the
winglet was able to increase the C
L
/C
D
value. My-
ilsamy et al. (2015) et al conducted numerical inves-
tigation on NACA 4412 airfoil coordinates for the
wing design and the winglet with the blended design.
The design of the entire wing including winglet were
examined at different cant angles of winglets vary-
ing from 0
◦
, 30
◦
and 90
◦
degrees at different angles of
attack from -2
◦
to 10
◦
. They have observed among
the cases of this study, wings with winglets produces
higher C
L
/C
D
ratio performance than the normal air-
craft wing without winglets.
Suranto Putro et al. (2016) investigated by numer-
ical simulation on airfoil type NACA 43018 by affix-
ing winglet in the form of forward wingtip fence and
rearward wingtip fence. In the study it was showed
that the addition of winglet was able to increase the
C
L
/C
D
value up to 22.9% for forward wingtip fence
type at α = 2
◦
. Ristic (2007) studied experimentally
on NACA2415 airfoil by varying angle of attack from
206
Cahyo, B., , S. and Har iyadi, S.
Experimental Study on the Analysis of the Use of Forward and Rearward Wingtip Fences 90o Cant Angle on Wing Airfoil Eppler 562.
DOI: 10.5220/0008549102060214
In Proceedings of the 3rd International Conference on Marine Technology (SENTA 2018), pages 206-214
ISBN: 978-989-758-436-7
Copyright
c
2020 by SCITEPRESS – Science and Technology Publications, Lda. All rights reserved
-12
◦
to 20
◦
at low Reynolds. In this study, the flow
visualizations were done by using oil flow technique
for qualitative analysis of the transition zone. The
experimental results showed that as the angle of at-
tack increased, the separation and the transition points
moved towards the leading edge at all Reynolds num-
bers.
The aim of this study is to evaluate aerodynamic
performance of airfoil Eppler 562 (E562) without and
with the addition of wingtip fence. There are two
types of wingtip fence variations that will be used
in this research. They are rearward wing tip fence
and forward wing tip fence with cant angle 90
◦
The
Reynolds (Re) number used is 2.3 × 10⁴ (U
∞
= 10
m/s) with angle of attack variations (α) = 0
◦
, 2
◦
, 4
◦
,
6
◦
, 8
◦
, 10
◦
, 12
◦
, 15
◦
, 17
◦
and 19
◦
.
2 RESEARCH METHODOLOGY
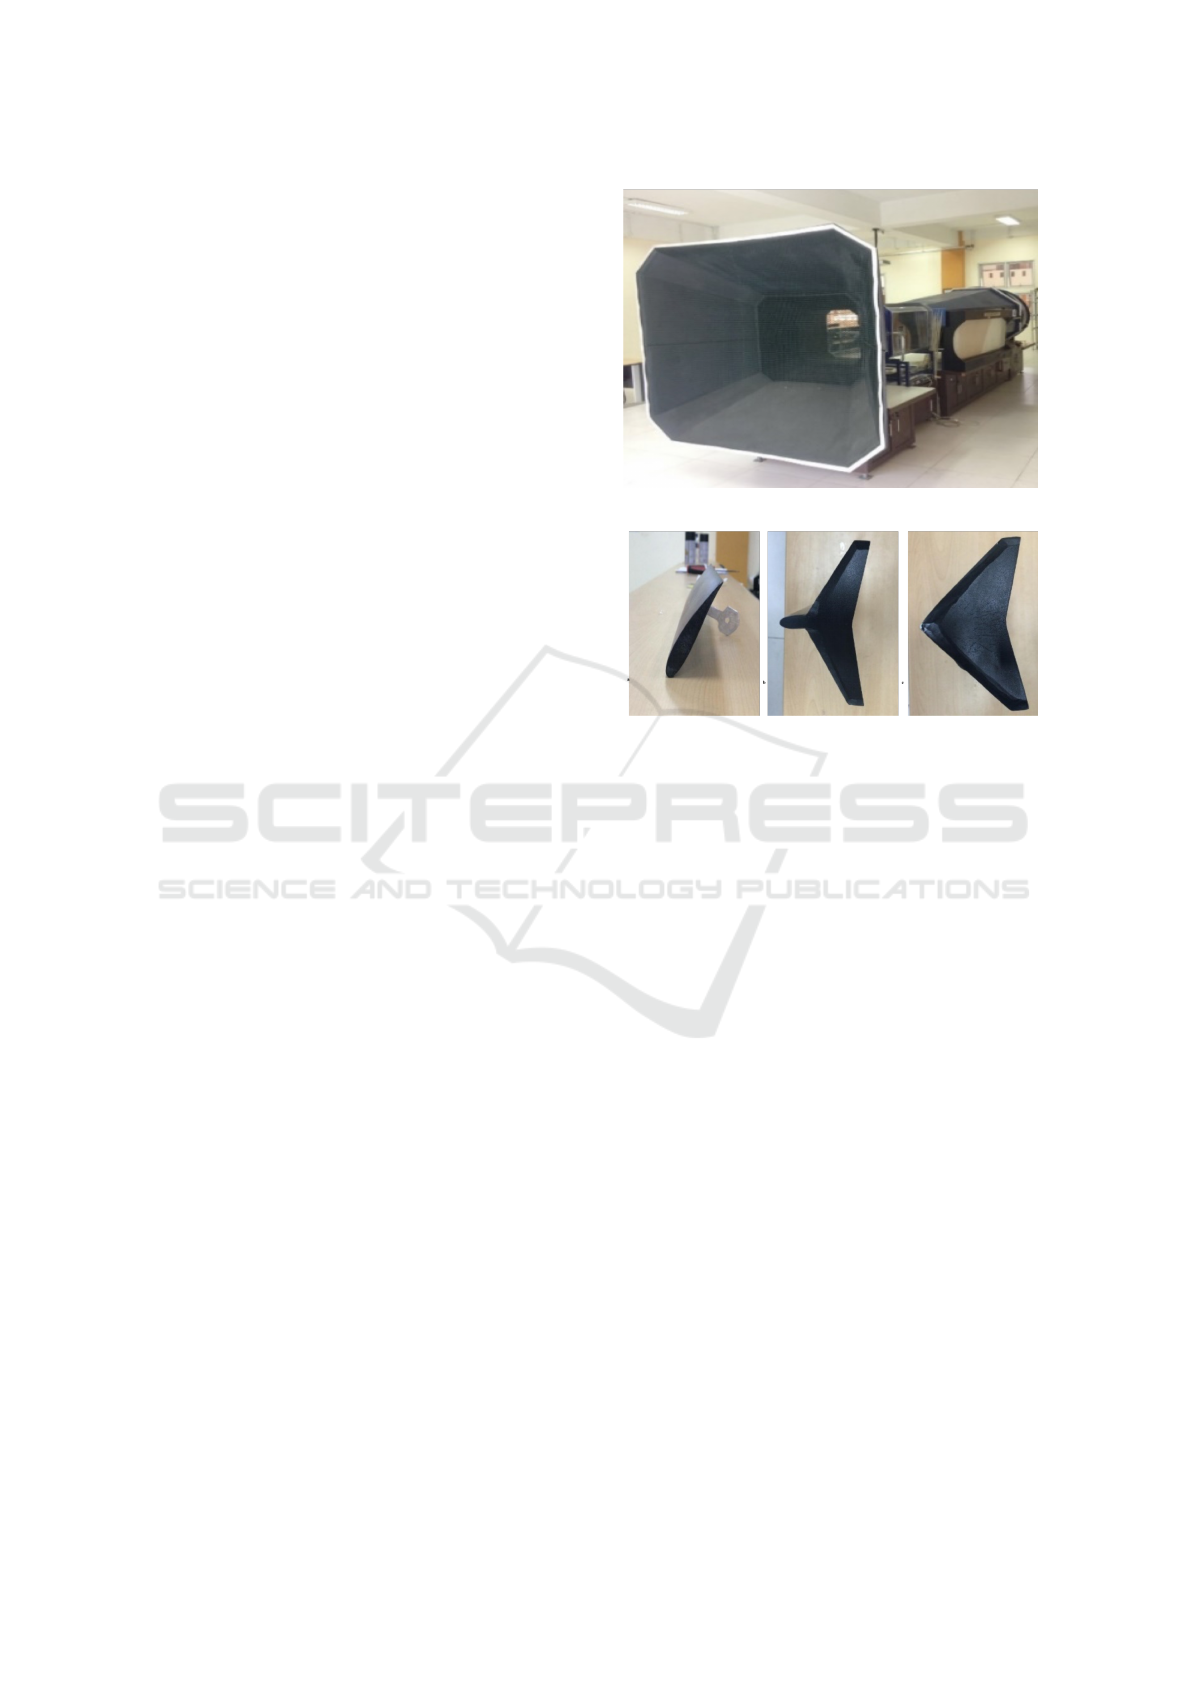
2.1 Wind Tunnel and Models
Experiments were conducted in the Aerodynamics
Laboratory Department of Aircraft Engineering at
Aviation Polytechnic of Surabaya The experiments
were carried out in a low-speed, suction-type wind
tunnel with a square test section dimension of 600
mm × 600 mm. The ratio of cross sectional area of
contraction cone was ± 9:1 and the side walls of the
working section were expanded with a divergence an-
gle of 0.3
◦
on each side to minimize boundary layer
effects on the working section walls, and to give a
constant static pressure. The wind tunnel could be
operated at a maximum air speed of 50 m/s. The ex-
periments were carried out at Reynolds (Re) numbers
of 2.3 × 10⁴ based on chord length of airfoil (c) and
free-stream velocity (U∞). The experimental setup
and schematic diagram are shown in Figure 1 and 2.
The airfoil models were manufactured out of
acrylic sheet (Figure 3) that was formed according to
airfoil Eppler 562 profile performed by heated. The
manufactured airfoils have a span length of 300 mm,
and a chord length of c= 72 mm. The profile winglet
maximum chord forward wingtip fence from leading
edge and winglet maximum chord rearward wingtip
fence from leading edge are 72 mm and 22.62 mm re-
spectively, and the winglet minimum chord is 15.12
mm.
2.2 Pressure Measurements
For the measurement of pressure distributions of suc-
tion and pressure surfaces on the Eppler 562 airfoil,
Figure 1: Wind Tunnel WT-60 Set-up
Figure 2: Schematic Diagram of The Experimental Set-up.
a system including a pitot-static tube, a National In-
strument unit, a 32 channel pressure transducer and
32 pressure tapping of 1/16 inch in diameter, which
are flush along the mid-span and tip-span alternately
of the upper and lower surfaces of the wing was used
(Figure 4). Pressure measurements were carried out
by using a computer data acquisition system. The
pressure was measured by using ni cdaq-9172 Na-
tional Instrument which the output was a voltage. The
maximum response time of the pressure transducer
was about 1 ms. Pressure signals were obtained at
a sampling rate of 100 samples data per second or
in one snapshot and a Signal Express software from
Ni-max was used to display the results of conversion
analog pressure data to digital (A/D) in ASCI format
data, and final post-processing was complemented in
Microsoft Excel Software to calculate the mean pres-
sure distributions and created the graph. Experiments
were investigated over a range of angles of attack in
order to calculate the pressure coefficient distribution
on all type airfoil.
2.3 Force Measurements
An external load-cell system was used for measuring
the lift and drag forces on the airfoil. The Eagle Tree
system data recorder (Figure 5) software used to dis-
play data from DAQ system that converted an ana-
log input to digital output of the lift and drag forces
Experimental Study on the Analysis of the Use of Forward and Rearward Wingtip Fences 90o Cant Angle on Wing Airfoil Eppler 562
207
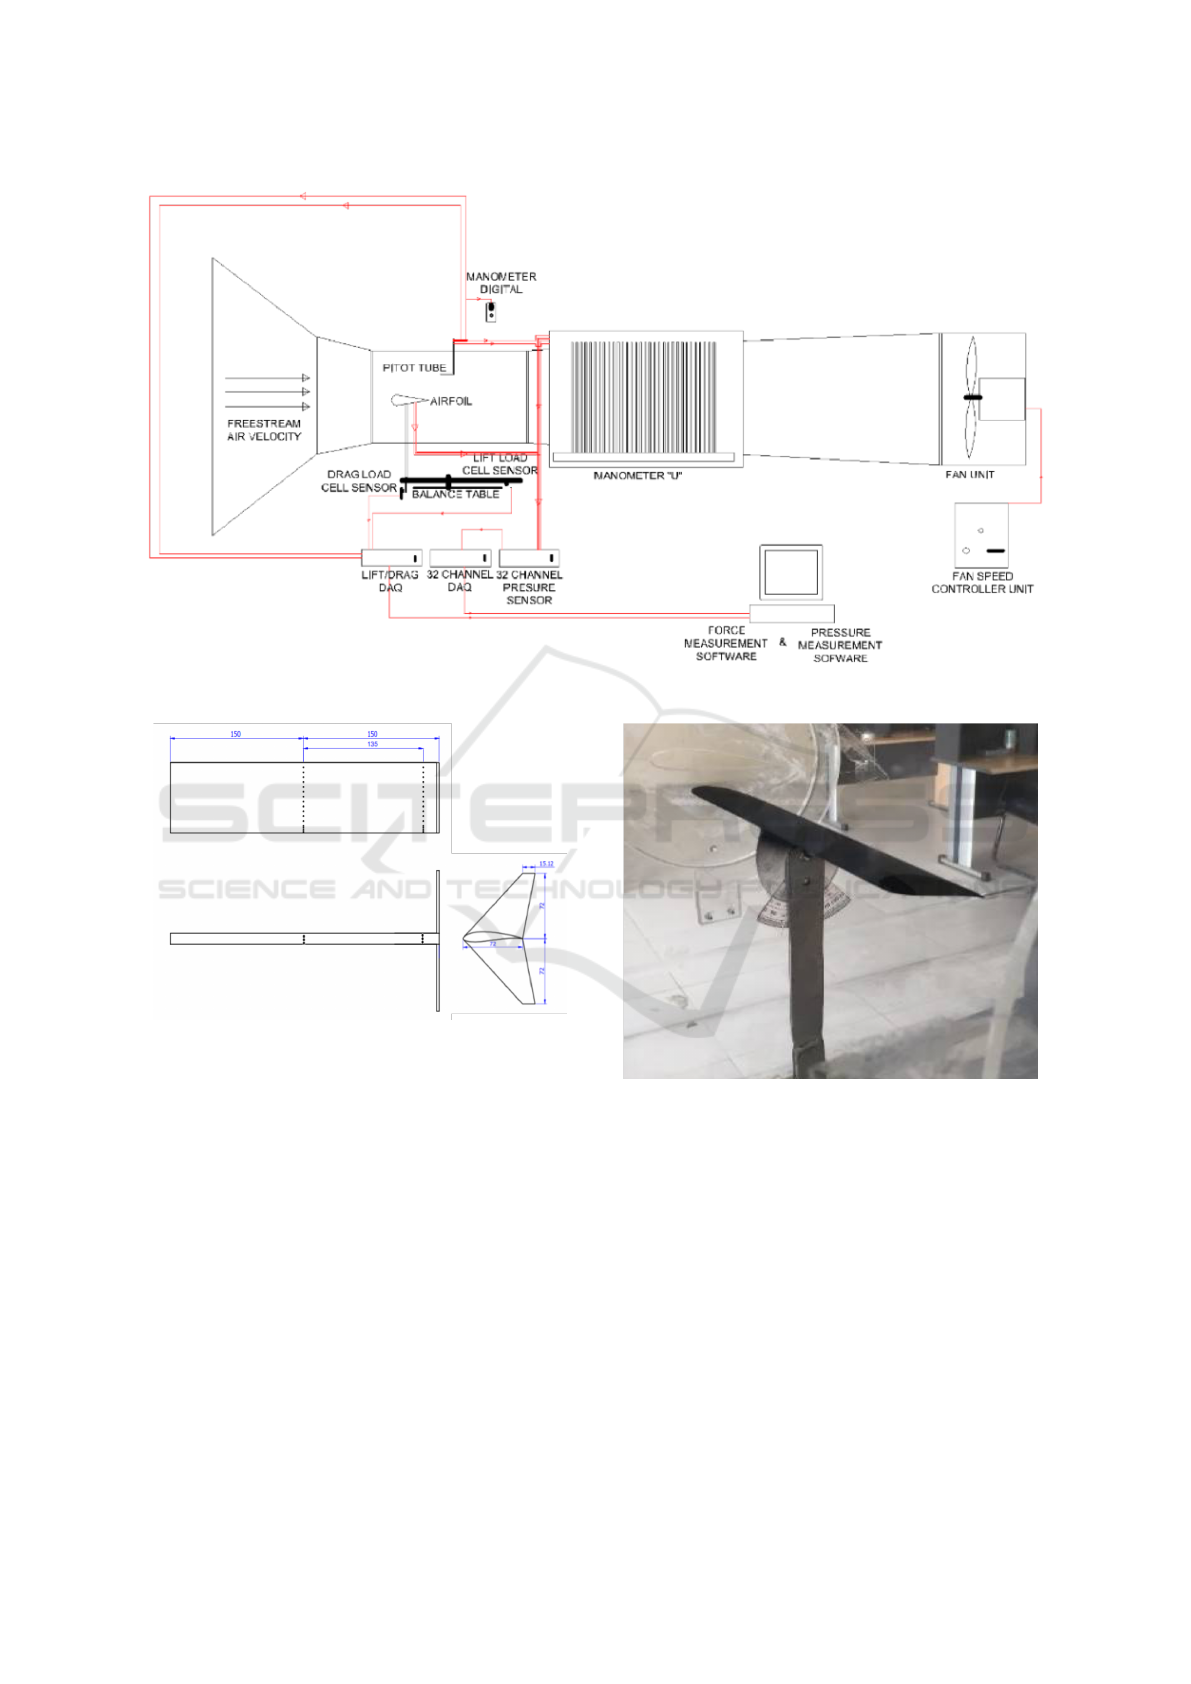
Figure 3: Airfoil models manufactured with end-plate: a) plain wing b) rearward wingtip fence and c) forward wingtip fence.
Figure 4: Pressure Tap Location on Midspan and Tip Span
at All Models.
in gram. The calibration was performed by loading
the load cell with known weights. Calibration was re-
peated before each set of experiments to ensure con-
sistency. Sets of data chosen at random were repeated.
The force data was collected at a sampling 100 sam-
ples data over 120 s in FDR format data. Mean forces
and its coefficients were calculated using Microsoft
Excel Software.
2.4 Oil Flow Visualization
The simple and effective way of observing surface
flow events was used oil flow visualization(Ristic,
2007). This method performed on the mat black air-
foil surface was painted before with pigmented oil
Figure 5: Experimental Set-up for The Force Measure-
ments.
was used to get the clear photograph of surface flow
events (Figure 6) and the wind tunnel is run. It is im-
portant that the type of oil mixture which would work
at the speed of the wind tunnel. The mix should have
the right consistency to effectively indicate the devel-
opment of the boundary layer. The simplest mix to
make was palm oil and titanium dioxide (TiO
2
) the
ratio of palm oil to titanium dioxide was roughly 5:1
then stir for 15 minutes until the TiO
2
fine granules
not visible. Furthermore, the mixture was diluted by
adding kerosene the ratio 5:1, respectively. And this
ratio of mixture was used in the present study (Figure
SENTA 2018 - The 3rd International Conference on Marine Technology
208
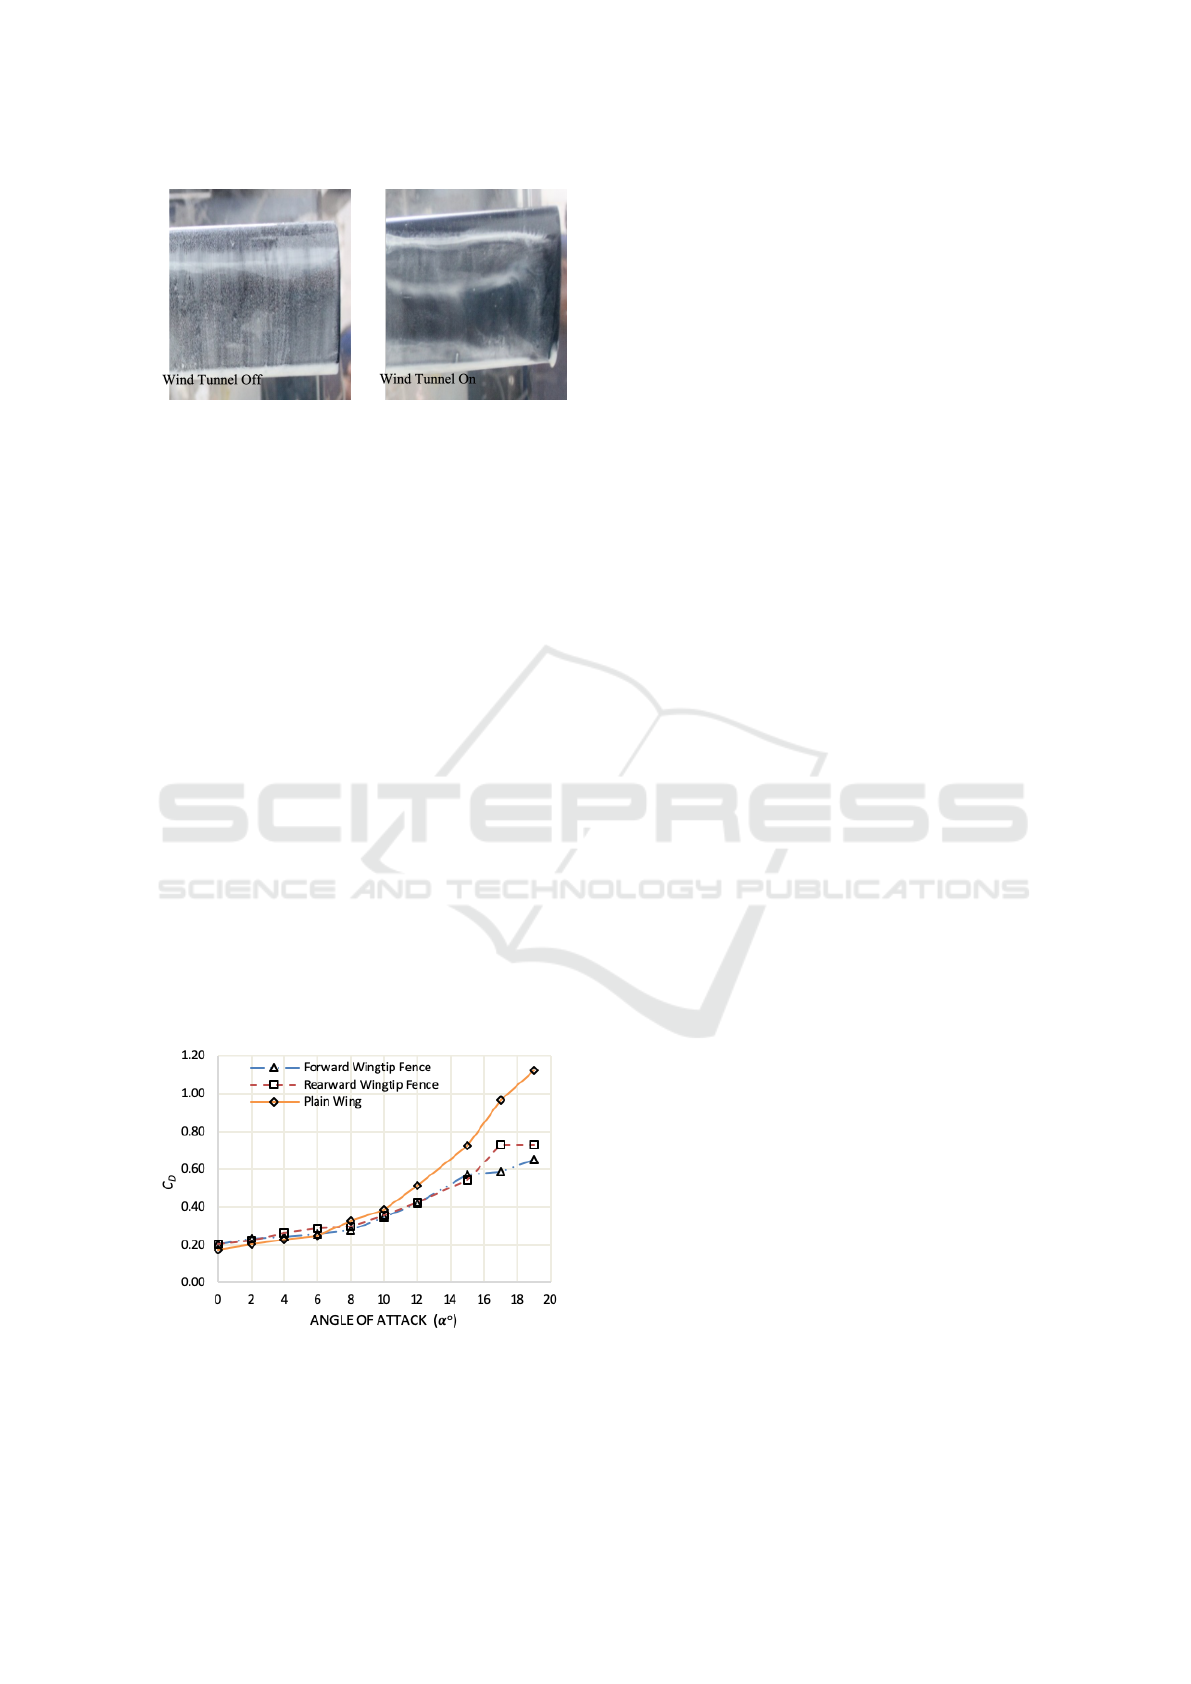
Figure 6: Sample of Oil-flow Visualization Experiment over
Eppler 562 Aerofoil on which Oil laid.
6). However, the pigment was added in some doses
based on Reynolds number.
3 RESULTS AND DISCUSSIONS
3.1 Drag Coefficient (C
D
)
The nature of the air which always moves from high
pressure to lower pressure towards the tip of the
wing, causes movement of air from lower side wing
which is directed outward around the outer edge of
the wing such as ”spill” and created a vortex around
the wingtip. The existence of vortex will disrupt the
air flow along the wing thereby reducing the effective
area of the wing which resulted in an increase in drag.
This leads to a decrease in the average attack angle
relative to the airflow around the wing, too. The co-
efficient of lift and the coefficient of drag have been
calculated from the experimental results. Also vari-
ous graphs have been drawn to examine the measured
and calculated data nature.
Figure 7: Drag Coefficient (C
D
) vs α on Plain Airfoil and
using Winglet.
In Figure 7, it is shown that the drag coefficient
all of the aircraft wing model under test. The drag
increases slowly with increase in angle of attack to a
certain value and then it increases rapidly with further
increase in angle of attack. The initial value of drag
coefficient of the plain wing at zero angle of attack
for Reynolds number 2.3 × 10
4
is 0.1713. The value
of the drag coefficient at the transition point i.e. at
an angle of attack of 8
◦
is 0.3271. The experiments
have been done up to an angle of attack of 19
◦
. At the
maximum angle of attack of 19
◦
the drag coefficient is
1.1216. The rapid increase in drag coefficient, which
occurs at higher values of angle of attack, is probably
due to the increasing region of separated flow over
the wing surface, which creates a large pressure drag.
The comparison drag coefficient data for wingtip for
the three variations i.e. plain wing (without wingtip),
rearward wingtip fence cant angle 90
◦
, and forward
wingtip fence cant angle 90
◦
are given in Fig.7. For
all wingtip variations, a similar pattern has been ob-
served. At 10
◦
angle of attack the drag coefficients for
the plain (without wingtip), rearward wingtip fence
cant angle 90
◦
, and forward wingtip fence cant angle
90
◦
are 0.3832, 0.3561, and 0.3468 respectively, and
began to effectively reduce the drag. It appears that
drag coefficient using forward wingtip fence is lowest
than the other models.
3.2 Lift Coefficient (C
L
In Figure 8, it is shown that the lift coefficient all of
the aircraft wing model under test. The lift increases
with increase in angle of attack to a maximum value
and thereby decreases with further increase in angle
of attack. The initial value of lift coefficient of the
plain wing at zero angle of attack for a chord based
Reynolds number 2.3 × 10
4
is 0.2897. The max-
imum value of the lift coefficient is 1.542 and this
maximum values occur at an angle of attack of 12
◦
.
The experiments have been done up to an angle of
attack of 19
◦
. At the maximum angle of attack of
19
◦
the lift coefficient is 0.5452. The reason for a
drop in lift coefficient beyond a certain angle of at-
tack e.g. 12
◦
is probably due to the flow separation,
which occurs over the wing surface instead of hav-
ing a streamlined laminar flow there. This condition
is called stalling condition and the corresponding an-
gle of attack is called stalling angle. The stalling an-
gle occurs to be 12
◦
. The comparison maximum lift
coefficient data for wingtip for the three variations:
plain wing (without wingtip), rearward wingtip fence
cant angle 90
◦
, and forward wingtip fence cant an-
gle 90
◦
are given in Figure 8. are 0.6075, 0.7277 and
0.8423 respectively corresponding to an angle of at-
tack of 12
◦
, 17
◦
, and 17
◦
respectively which is also
the stall angle of attack. The addition of the winglet
Experimental Study on the Analysis of the Use of Forward and Rearward Wingtip Fences 90o Cant Angle on Wing Airfoil Eppler 562
209
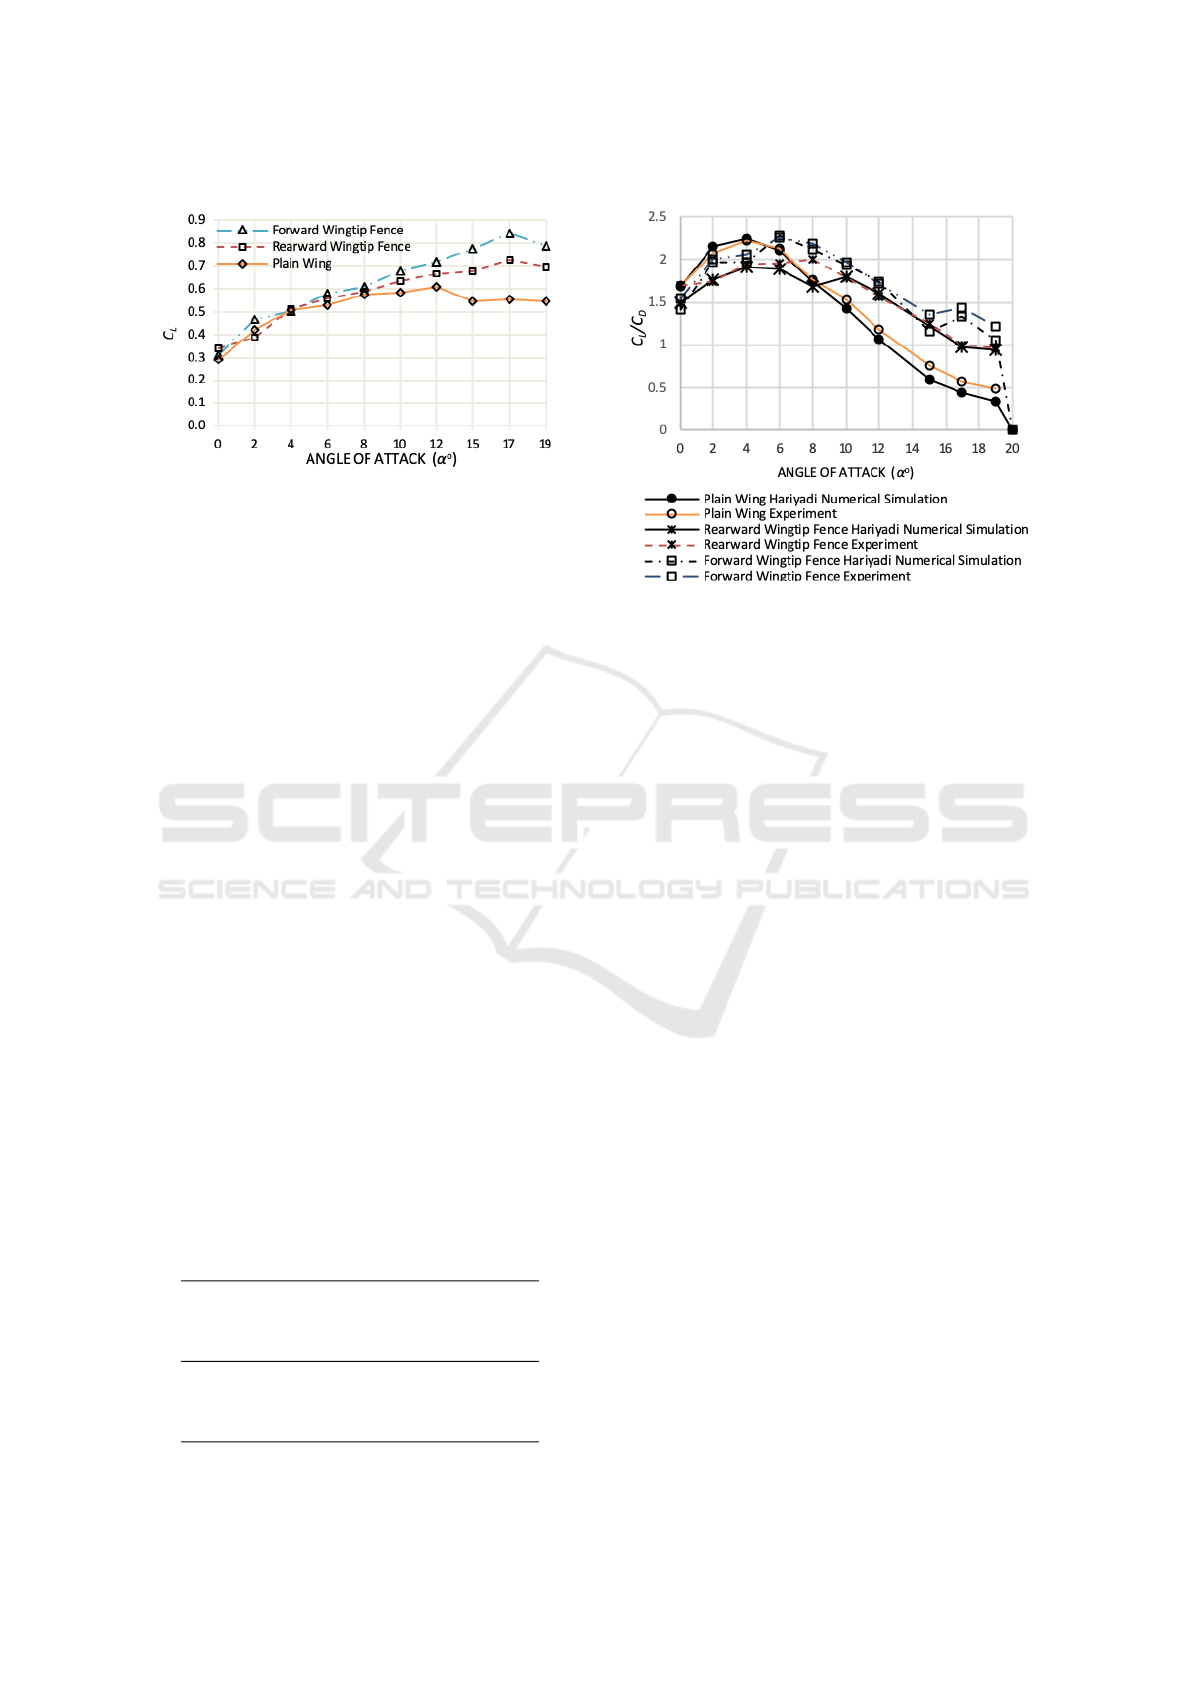
Figure 8: Lift Coefficient (C
L
) vs α on Plain Airfoil and
using Winglet.
effective enough to prevent air rotation (vortex) on the
wingtips caused by the encounter of the lower air of
the high pressure wing with low pressure upper air
wing which reduces the angle of attack effectively.
From the graph, it can be concluded that lift coeffi-
cient for using forward wingtip fence is highest than
the other variations and it is also seen that the use of
wingtip fence can delay the occurrence of stalls.
3.3 Lift and Drag Coefficient (C
L
/C
D
)
A winglet’s main purpose is to improve performance
by reducing drag. By using the winglet, the strength
of the vortex can be reduced and the induced drag can
also be reduced. Such performance improvements
can be seen in the C
L
/C
D
comparison graph. The
C
L
/C
D
ratio is the outcome of the observations made
in the two preceding sections. It is observed from
the Fig. 9 that the C
L
/C
D
ratio for all the configu-
rations considered increases with an angle of attack
to its maximum value and thereby it decreases with
further increase in angle of attack. As the effective
area of the wing increased, the value of the C
L
/C
D
get in increased. Vortex tips derived from the lower
side wings contribute to reducing this effective area
and also increase the induced drag of the wing. If the
winglet can prevent or minimize air spill effectively,
it can reduce tip vortex.
Table 1: The Separation Point (X
s
) vs x/c obtained from
The Results of The Oil-flow Visualization.
Re Number α
◦
X
s
X
s
X
s
Plain Rearward Forward
Wingtip Wingtip
Fence Fence
2.3 x 10⁴ 0 0.1 0.1 0.1
4 0.08 0.03 0.03
8 0.03 0.02 0.02
12 0.01 0.01 0.01
Figure 9: Comparison of C
L
/C
D
between Plain Airfoil and
Airfoil with Addition of Winglet from Experimental Result.
Figure 9 shows comparison of C
L
/C
D
ratio on
plain wing and with variations winglet in some an-
gle of attack. This indicates that with the addition
of winglet will increase the C
L
/C
D
ratio and show an
improve trend along with the increase of angle of at-
tack. The airfoil wing model without winglet gives a
measured C
L
/C
D
ratio of 1.762 whereas the respec-
tive values of the C
L
/C
D
ratio for rearward wingtip
fence cant angle 90
◦
, and forward wingtip fence cant
angle 90
◦
are 2.00, and 2.188 respectively at an angle
of attack of 8
◦
.
Practically it is observed that the C
L
/C
D
ratio ver-
sus angle of attack curve gives similar results for 8
to 15 degrees, for the all type of without and with
winglet. It can be said that the wing with forward
wingtip fence cant angle 90
◦
variation has the bet-
ter performance as compared to plain wing (with-
out wingtip) and rearward wingtip fence cant angle
90
◦
and it is giving the better C
L
/C
D
ratio (2.188). It
also shown that the result of experimentally have quite
good agreement with Suranto Putro et al. (2018) nu-
merical research did. The graph indicated as the an-
gle of attack increase, the trend C
L
/C
D
experimentally
have a similar to numerical simulation.
3.4 Pressure Coefficient (C
P
)
The pressure coefficients were calculated from the
pressure readings of Signal Express software that ob-
tained from the pressure tapping at many points across
the midspan and tip span airfoil surface. Figure 10
describes the evolution of the pressure coefficient as
the angle of attack were increased, the graphs of pres-
sure distribution (C
P
) over the Eppler 562 airfoil plain
SENTA 2018 - The 3rd International Conference on Marine Technology
210
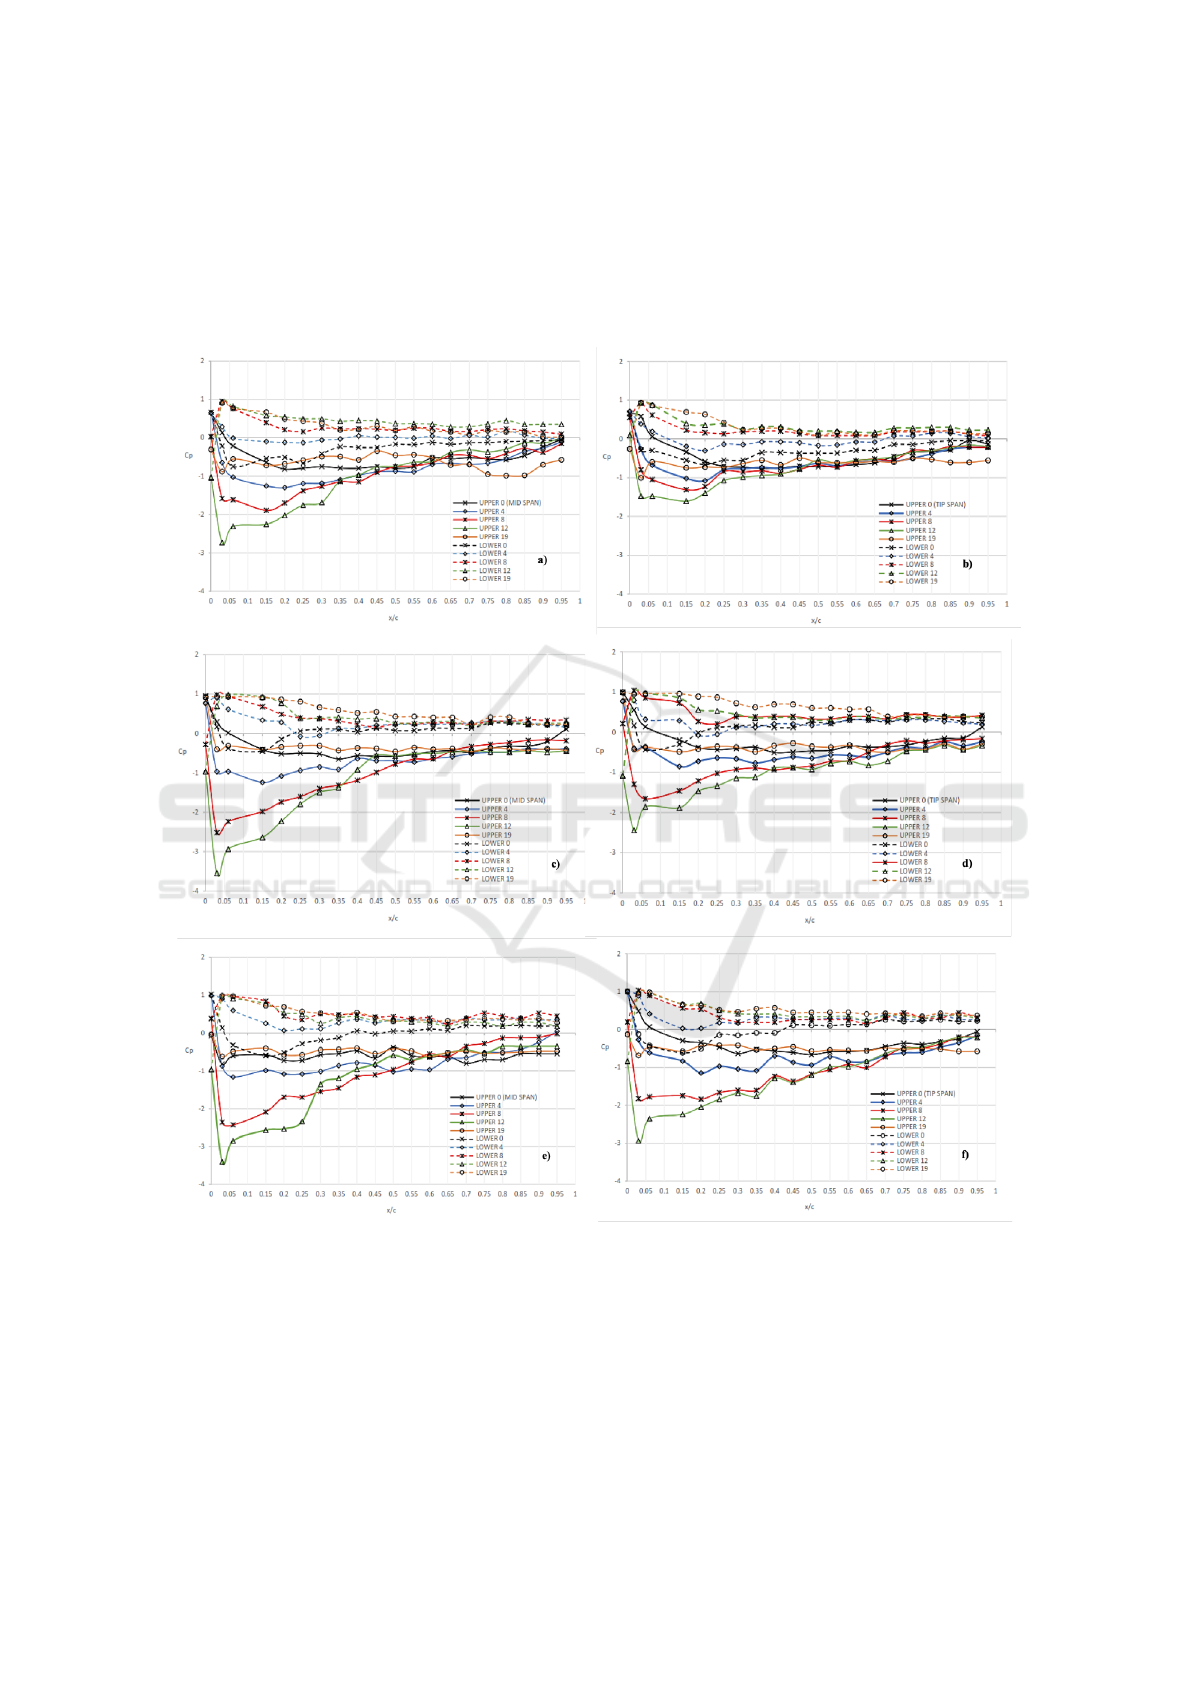
Figure 10: Pressure coefficient (C
P
) versus the angle of attack (α) 0
◦
to 19
◦
at pressure tap location: a) plain wing mid span b)
plain wing tip span c) rearward wingtip fence mid span d) rearward wingtip fence tip span e) forward wingtip fence mid span
f) forward wingtip fence tip span.
Experimental Study on the Analysis of the Use of Forward and Rearward Wingtip Fences 90o Cant Angle on Wing Airfoil Eppler 562
211

wing and with variations of winglet at angles of α =
0
◦
, 4
◦
, 8
◦
, 12
◦
, 19
◦
at Re = 2.3 × 10
4
. In general
these plots illustrate the development of the boundary
layer as the pressure slowly increases after peak suc-
tion from the leading-edge to the trailing-edge. Figure
10a shows at the plain wing (without winglet) that the
effective midspan better than tip span area. This can
be known that the resulting plot pressure coefficient
magnitude at midspan is wider than tip-span area at
all condition of angle of attack. This indicates that tip
vortex affecting characteristics air flow at the wingtip
area, while midspan area not affected because it was
longer distance from the wingtip.
Figures 10c and 10e are airfoil with adding rear-
ward wingtip fence cant angle 90
◦
, and forward
wingtip fence cant angle 90
◦
, respectively. It can
be seen that forward wingtip fence has a bigger
area pressure coefficient distribution than rearward
wingtip fence. This condition is caused by tip on
rearward wingtip fence model not completely cover
by the endplate. So, there is still an air spill from
lower side disrupts effective air flow on upper side
especially in the leading edge wingtip area. Conse-
quently, wing performance at rearward wingtip fence
types worse than forward wingtip fence ones.
3.5 Oil Flow Visualization Results
In Figures 11 and 12, it is describes the concept
boundary layer separation process, oil flow visualiza-
tion was applied to the upper surface of the airfoil at
angles of attack of 0
◦
, 4
◦
, 8
◦
, and 12
◦
. The dense
area of pigment describes the flow has decelerated, it
means the point at which the pressure gradient repeal
causing separation.
As the angle of attack increases the separation
point moves towards the leading edge at all four an-
gle of attack that the vorticity magnitude of the vortex
will increase as the angle of attack increases. At an-
gle of attack 0
◦
(Fig. 11a) this occurs at 10% chord,
4
◦
(Figure 12d) at 8% chord, 8
◦
(Figure 13a) at 3%
chord and for 12
◦
(Figure 12d) at 1% chord. Further-
more, the separation point (X
s
) vs x/c obtained from
the results of the oil-flow visualization and pressure
coefficient experiments can be seen in Table 1. It
also seen tip vortex get in interference at upper side
wingtip has an impact to coefficient of lift. The higher
the angle of attack the vortex is formed the wider. As
the vortex formation area increase the lift coefficient
will be decrease. In Fig. 12 shows vortex formation
of the tip where plain wing produces widest vortex
contour.
The forward wingtip fence produces smallest vor-
tex contour than other types. It was occurs due to
the vortex formation of the tip is obstructed by the tip
of the winglet. Therefore, design endplate cover tip
from front until rear of the tip causes tendency of air-
flow from the lower surface near the end of the wing
to ”jump” to the upper surface can be effectively re-
duced. As the disruption of airflow from lower sur-
face decrease the vortex formation area will decrease.
It follow the rising of lift coefficient.
4 CONCLUSIONS
The results of this experimental investigation show
that the use of winglet can improve the performance
on airfoils Eppler 562 using variations of wingtip
fence will increase drag along with increasing angle
of attack. However, with the addition of winglet, lift
force can be improved better than plain wing. Winglet
causes the formation of vortex tip can be reduced sig-
nificantly.
From the experimental study it was concluded that
the use of winglet can produce some flow characteris-
tics, namely:
• Increased angle of attack will increase wingtip
vortices and drag coefficient.
• Wing with the addition of forward wingtip fence
cant angel 90
◦
produces C
L
/C
D
higher than plain
wing and rearward wingtip fence cant angel 90
◦
.
• To produce a high C
L
/C
D
then the pressure re-
quired on the lower surface is much higher than
the upper surface. Forward wingtip fence cant
angel 90
◦
produces better C
L
/C
D
than rearward
wingtip fence cant angel 90
◦
because forward
wingtip fence enlarges the formation of effective
area so that the lift can be increased. It is gen-
erally found that the addition of forward wingtip
fence reduces the induced drag than plain wing.
• On forward wingtip fence cant angel 90
◦
produce
higher performance than other wing start at α
= 6
◦
while rearward wingtip fence cant angel
90
◦
produce better performance start at α = 8
◦
.
• In the oil-flow visualization and pressure distribu-
tion experiments, it was concluded that as the an-
gle of attack increased the separation point moves
towards the leading edge at wing airfoil Eppler
562 without and with winglet.
• Forward wingtip fence cant angle produce small-
est vortex formation area at tip than other types
that performed by oil-flow visualization.
SENTA 2018 - The 3rd International Conference on Marine Technology
212
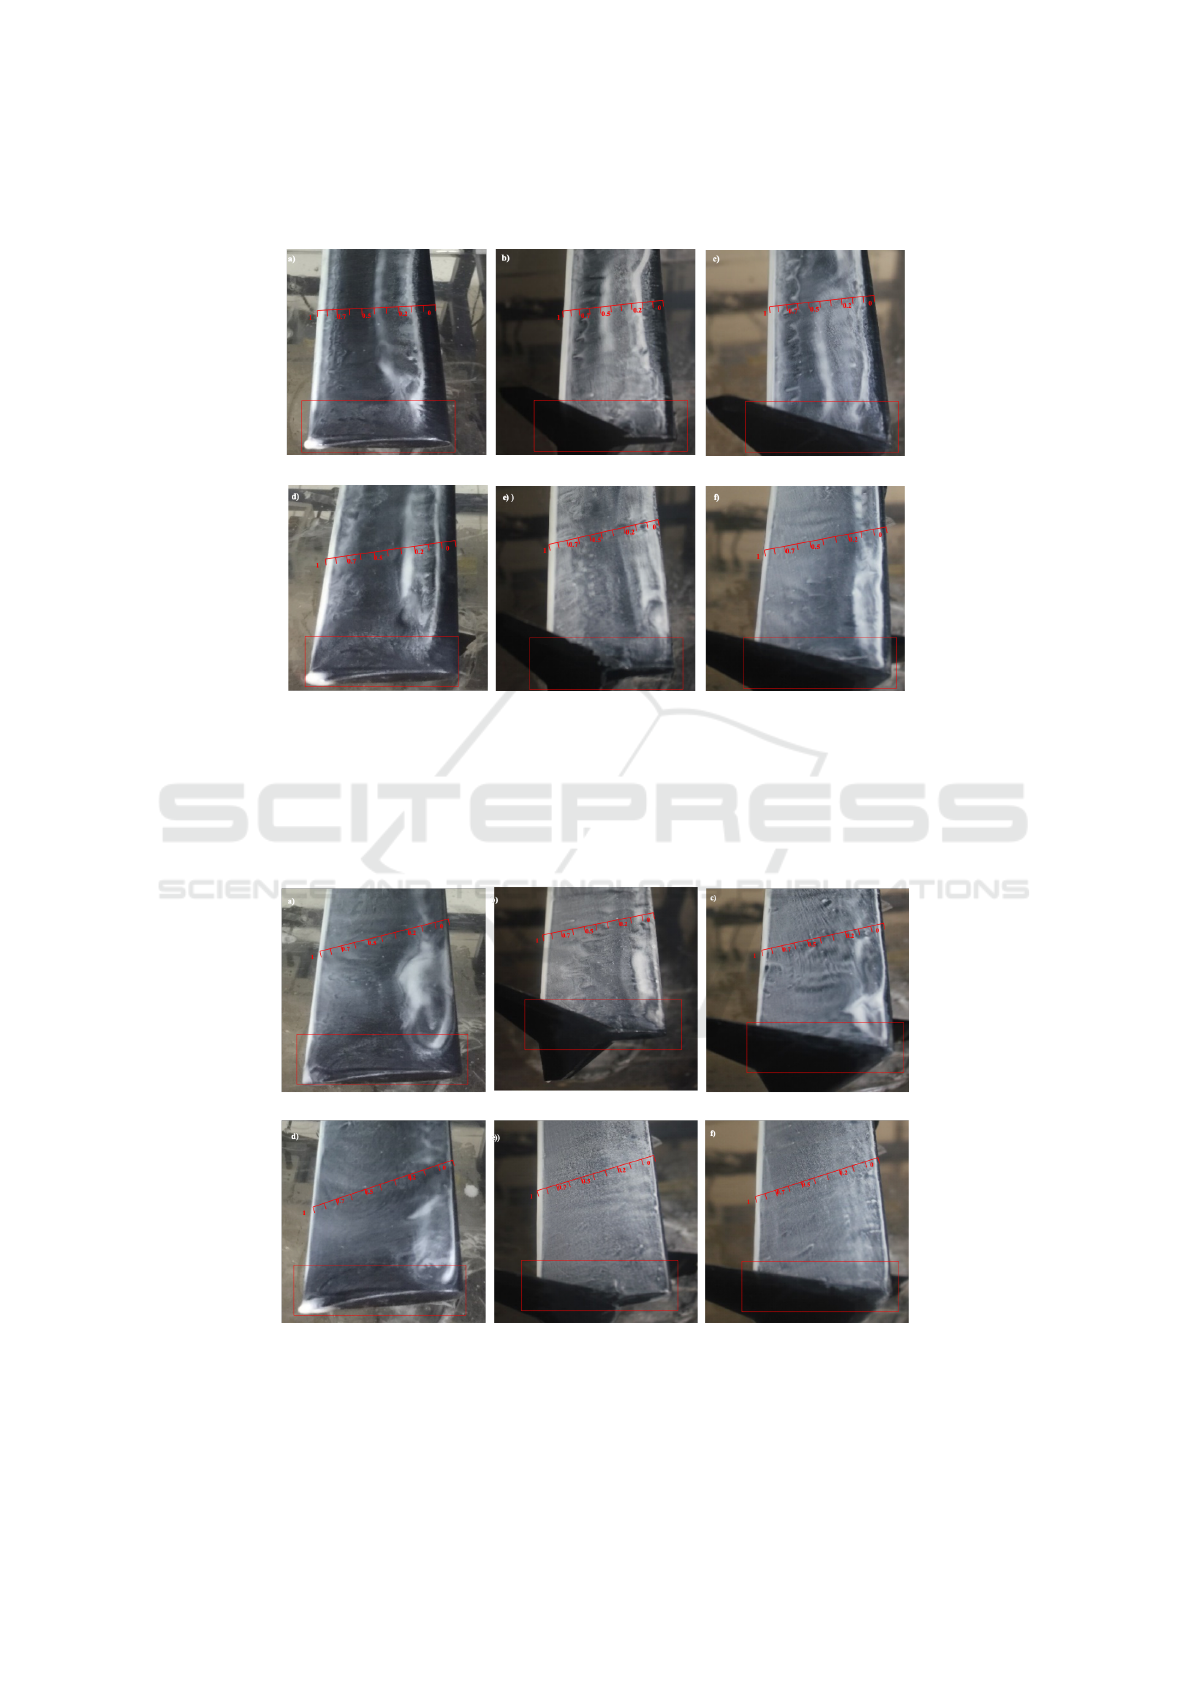
Figure 11: The photographs of oil-flow visualization experiments over the Eppler 562 airfoil for α = 0
◦
(a) plain wing (b)
rearward wingtip fence (c) forward wingtip fence, for α = 4
◦
(a) plain wing (b) rearward wingtip fence (c) forward wingtip
fence.
Figure 12: The photographs of oil-flow visualization experiments over the Eppler 562 airfoil for α = 8
◦
(a) plain wing (b)
rearward wingtip fence (c) forward wingtip fence, for α = 12
◦
(a) plain wing (b) rearward wingtip fence (c) forward wingtip
fence.
Experimental Study on the Analysis of the Use of Forward and Rearward Wingtip Fences 90o Cant Angle on Wing Airfoil Eppler 562
213

REFERENCES
Myilsamy, D., Thirumalai, Y., and P S, P. (2015). Perfor-
mance investigation of an aircraft wing at various cant
angles of winglets using cfd simulation.
Ristic, S. (2007). Flow visualisation techniques in wind tun-
nels part i – non optical methods. Scientific Technical
Review LVII N., 1.
Suranto Putro, S., Sutardi, S., and Widodo, W. (2016). Nu-
merical study of aerodynamic analysis on wing airfoil
naca 43018 with the addition of forward and rearward
wingtip fence. volume 1778.
Suranto Putro, S., Sutardi, S., and Widodo, W. (2018). Drag
reduction analysis of wing airfoil e562 with forward
wingtip fence at cant angle variations of 75
◦
and 90
◦
.
volume 2001, page 050003.
Sutrisno, T., Mirmanto, H., Sasongko, H., and Noor, D.
(2015). Study of the secondary flow structures caused
the addition forward facing step turbulence generated:
Case study: Horseshoe vortex between 9c7/32.5c50
body and endwall. Advances and Applications in
Fluid Mechanics, 18:129–144.
Turanoguz, E. and Alemdaroglu, N. (2015). Design of a
medium range tactical uav and improvement of its per-
formance by using winglets. pages 1074–1083.
SENTA 2018 - The 3rd International Conference on Marine Technology
214
