
Numerical Study of Multistage Municipal Solid Wate Gasification
Downdraft System With Air Ratio Pyrolysis, Oxidation, and Reduction
1:8:1
Rizqiana Yogi Cahyaningtyas
1
∗
, Bambang Sudarmanta
1
and Arif RahmanSaleh
1
1
Department of Mechanical Engineering, ITS, Sukolilo Surabaya 60111, Indonesia
Keywords:
Gasification, CFD, Oxidation, Reduction.
Abstract:
This research was carried out numerically to determine the sequential process in each zone due to pyrolysis,
oxidation, and reduction air input ratios of 1: 8: 1. Whereas equivalent ratio (ER) is fixed at 0.4. The simula-
tion on the reactor is carried out completely and separately for each zone, by applying the reaction according
to the zone. Computational Fluid Dynamics (CFD) software is used to predict syngas composition, chemical
reactions, and temperature distribution in each zone. The making of geometry, meshing, and determination of
the modeling domain is done with Gambit 2.4.6 software. While numerical simulations are performed with
Ansys Fluent 15.0 software. The modeling used is the standard model k-epsilon, Radiation P1, the trans-
port species model with turbulence used is finite-rate/eddy-dissipation, and Discrete Phase Model (DPM).
So different chemical reactions are considered in the reactor depending on the operating zone, oxidation and
reduction. A three-dimensional modelling for the geometry is used. For the purpose of model validation,
experimental data of temperature profiles and syngas composition are used. Besides, the influence of concen-
tration of an oxidant agent is numerically investigated. Results show that the maximum temperatures reached
in oxidation and reduction processes are, respectively, 932.38
◦
C.
1 INTRODUCTION
Gasification is a thermochemical process that con-
verts carbon materials such as biomass into use-
ful gas fuels or becomes chemical raw materials
through a partial oxidation process with air, oxygen,
or steam(Basu, 2013). The performance of the gasi-
fication process can be reviewed based on gas qual-
ity, namely gas composition, LHV gas, cold gas ef-
ficiency, and tar content. Gasification is a chemical
reaction that is very sensitive to temperature changes
and air supply. Increasing the gasification tempera-
ture can be done by modifying a single downdraft
type air reactor (oxidation zone) to double / multi-
level air input. The gasification process is influenced
by biomass characteristics, gasifier design, gasifying
agent, and air-fuel ratio (AFR) ratio. Knowing the
effect of adding air to the pyrolysis zone and the re-
duction zone on gasification performance can be done
by experiment. The research and experiment process
certainly require time, huge costs, and repeated exper-
iments to get the desired results. So modeling can be
an alternative.
Dzulfansyah (2014) analyzed the performance of
downdraft type rice husk gasification reactors for sev-
eral simulation scenarios of 70
◦
, 80
◦
, and 90
◦
throat
angles, as well as 10
◦
and 20
◦
nozzle angles. In the
simulation, the k-epsilon model is used as a viscous
model (turbulence), the reactions involved in the gasi-
fication process (3 heterogeneous reactions and 6 ho-
mogeneous reactions) are solved by the finite rate /
Eddy dissipation model. Comparison with the test
data results in a RMSE value of 0.78%. The simu-
lation is capable of predicting the composition of the
gas quite accurately but is unable to accurately pre-
dict the temperature accurately in part of the reactor
zone (drying and pyrolysis). In addition, the temper-
ature distribution is not evenly distributed, there is no
reaction as a result of air input. Hidayatulloh (2018)
carried out modeling of the gasification process in the
reactor with the inlet air temperature variations of the
oxidation zone, namely 80
◦
C, 110
◦
C, 150
◦
C, 180
◦
C,
and 200
◦
C. The model used is the standard k-epsilon
model, radiation P1, the transport species model with
turbulence used is finite-rate / eddy-dissipation, and
Discrete Phase Model (DPM). The results of this gasi-
fication study were obtained by increasing the highest
Cahyaningtyas, R., Sudarmanta, B. and Saleh, A.
Numerical Study of Multistage Municipal Solid Wate Gasification Downdraft System with Air Ratio Pyrolysis, Oxidation, and Reduction 1:8:1.
DOI: 10.5220/0008548902010205
In Proceedings of the 3rd International Conference on Marine Technology (SENTA 2018), pages 201-205
ISBN: 978-989-758-436-7
Copyright
c
2020 by SCITEPRESS – Science and Technology Publications, Lda. All rights reserved
201

temperature at the addition of air temperature 200
◦
C
at 1004
◦
C in the oxidation zone (924
◦
C experimen-
tally).
2 BACKGROUND
2.1 Basic Gasification Theory
Biomass is a mixture of complex organic matter, such
as carbohydrates, fats, and proteins, which includes
a small amount of minerals, such as sodium, phos-
phorus, and iron (Basu, 2013). The characteristics
of biomass can be known by doing several analyzes,
namely ultimate and proximate analysis, density anal-
ysis, humidity analysis, and heat value analysis. The
proximate and ultimate MSW test results are shown
in Table 1.
The gasification process occurs in four stages,
namely drying (T ¡150
◦
C), pyrolysis / devolatilization
(150
◦
C ¡T ¡700
◦
C), reduction (800 ¡T ¡1000
◦
C), and
oxidation (700
◦
C ¡T ¡1500
◦
C). The gasification pro-
cess consists of a flammable gas, H
2
, CO, CO
2
; non-
flammable gas, namely N
2
and CH
4
, as well as other
compounds, such as sulfur, alkali and tar. Product gas
quality can be viewed from several aspects, namely
gas composition, LHV gas, cold gas efficiency, and
tar content. The composition of gas CO, H
2
, CH
4
is
seen from the results of testing using Gas Crematog-
raphy. The LHV value is calculated by:
LHV
syngas
=
n
∑
i=1
(Yi · LHVi) (1)
Cold Gas Efficiency is the amount of energy that
enters as long as potential energy exits. If M
f
is the
mass of solid fuel processed in the gasifier (kg) to pro-
duce M
g
mass of product gas with a LHV value from
Q
g
, then this efficiency can be stated as follows:
η
cg
=
LHV
g
· M
g
LHV
f
· M
f
(2)
Table 1: Proximate and Ultimate Data of MSW
PROXIMAT
Moisture Content % wt 9,82
Fixed carbon % wt 9,69
Volatile matter % wt 65,78
Ash % wt 14,71
HHV kJ/kg 13843
ULTIMAT
C % wt 39,83
H % wt 6,7
O % wt 38,11
N % wt 0,35
S % wt 0,14
The tar content is calculated using the following equa-
tion:
tar content =
m
tar
syngas volume
(3)
where m
tar
= mass of tar (kg) and volume of syn gas
(m
3
)
Based on its fluidization mode, gasifier is divided
into 3 types, namely: fixed bed gasifier, fluidized bed
gasifier, and entrained flow gasifier. In general, small-
scale gasification uses a fixed bed gasifier (Reed et al.,
1988). Based on the direction of feedstock and gas
flow in the gasifier, fixed bed gasifier can be cate-
gorized into three types, namely, updraft, downdraft,
and cross draft (Gai and Dong, 2012). In the updraft
gasifier, the direction of feedstock flow down while
the direction of gas flow up. In the downdraft gasi-
fier, the direction of the gas and feedstock flow are
both downward. Whereas in the cross draft gasifier,
the direction of gas flow is kept flowing horizontally
with feedstock flow down. Downdraft type gasifiers
have advantages including, suitable to be applied on a
small scale ((Sheth and Babu, 2009; Vyarawalla et al.,
1984)), construction and operation are easy, and pro-
duce low tar.
Tar is classified into three, namely secondary and
tertiary primary tar. Primary tar is formed at pyroly-
sis temperature. Secondary tar is formed at oxidation
temperature (above 500
◦
C) due to oxidants (oxygen,
air or steam). Tertiary tar is formed at a reduction
temperature (more than 800
◦
C). In gasification with
multilevel air input, the addition of air in the pyrol-
ysis zone can increase the temperature in the pyroly-
sis zone itself (auto-thermal) and subsequent zones so
that it is expected to increase the composition of the
gas. The composition of gas products obtained in the
oxidative pyrolysis process is more because it reacts
with O
2
and in the oxidative process of pyrolysis pro-
duces N
2
. In the composition of tar, pyrolysis usually
produces primary tar, whereas in oxidative pyrolysis
it has succeeded in reducing primary tar, and only be-
gins the formation of secondary tar.
2.2 Basic Theory of Numerical Model
Ahmed et al. (2012) classify biomass gasification
modeling into two broad categories, namely mathe-
matical models and simulation models. Mathematical
models include Equilibrium Models, Kinetic Model-
ing, and ANNs Models, while the simulation mod-
els include CFD Models and ASPEN Plus Models.
Computational Fluid Dynamics (CFD) involves mass
conservation equations, momentum, energy flow, hy-
drodynamics, and turbulence in the specified area.
In general, there are three stages that must be done
in CFD simulations according to Tuakia (Tuakia,
SENTA 2018 - The 3rd International Conference on Marine Technology
202
2008), namely pre-processing, processing, and post-
processing. In the pre-processing stage, geometry,
mesh and boundary layer are made. At the process-
ing stage, calculations are done to solve the equations
used. The calculation is done based on iteration to
close to the convergence criteria, which is set accord-
ing to user needs. Post processing is done to analyze
and interpret the calculations that have been made.
The results are presented in the form of x-y graphs,
contours (such as temperature, speed, pressure, etc.),
speed vectors, streamlined plots, and also animations
can be presented with ANSYS Fluent software.
3 NUMERICAL MODEL
Previous modeling was carried out as a whole by ap-
plying all chemical reactions to a downdraft gasifier
simulation. This causes the sequential process circuit
in each zone to be unknown. Therefore, it is neces-
sary to simulate separately for each zone, by applying
the appropriate reaction to the zone. The purpose of
this study was to determine the temperature distribu-
tion and gas composition in the pyrolysis, oxidation,
and reduction zones. Yi is the concentration of com-
bustible gas (CO, H2, CH4), LHVi is LHV syn gas
compound.
4 RESULT AND DISCUSSION
4.1 Performance of the Oxidation Zone
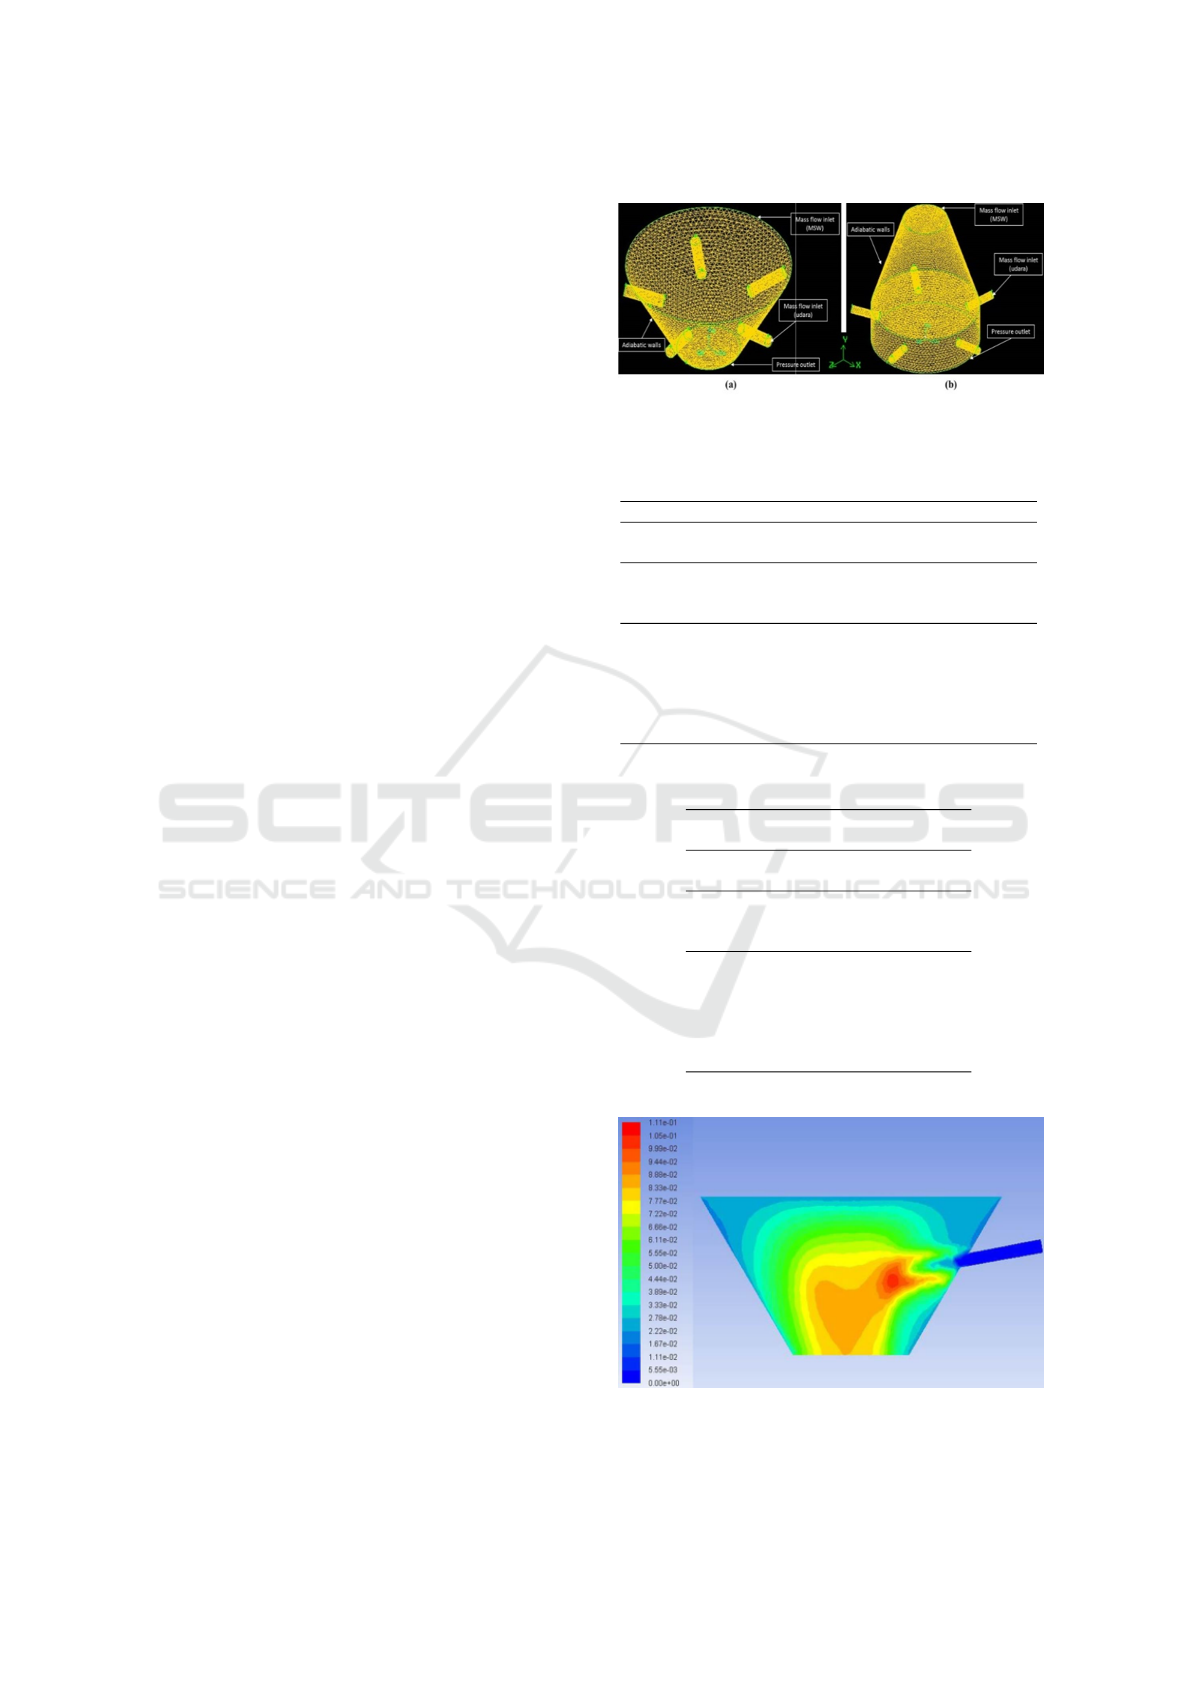
Geometry and mesh (Figure 1) are made using GAM-
BIT software version 2.4.6. with 3-D models using
hybrid mesh (a combination of structured and un-
structured). Meshing in this simulation has 17,698
nodes and 44,491 elements. Maximum quality of Or-
tho Skew at meshing is 0.79 where this value is still
within Ortho Skew’s maximum limit of 0.9. The tur-
bulence modeling used is the standard k-ε model, ra-
diation P1, the transport species model with the reac-
tion model used is finite-rate / eddy-dissipation, and
Discrete Phase Model (DPM). The boundary condi-
tions are based on experimental data obtained during
gasification of MSW. The equivalence ratio (ER) used
for this particular case corresponded to 0.4. The exter-
nal wall is modeled as adiabatic; however, a real pro-
cess has a non-adiabatic condition due to heat losses
to the surrounding. Steady state conditions are also
assumed.
Figures 2 and 3 shows the CFD simulation of the
combustion of MSW proposed in this work. Figure 2
Figure 1: Meshing and Boundary Conditions in the Oxida-
tion Zone (a) and Reduction (b)
Table 2: Kinetic Parameters of Reactions
Zone Reaction ∆H
Pirolysis Volatile → H
2
+ CO+CO
2
+H
2
O+CH
4
C+1/2O
2
→ CO -111
Oxidation CO+0.5 O
2
→ CO
2
-284
CH
4
+O
2
↔ CO
2
+2H
2
O -803
H
2
+0.5× O
2
→ H
2
O -242
Reduction CO+H
2
O ↔ CO
2
+H
2
-41.2
CO
2
+H
2
→ CO + H
2
O
CO+3H
2
↔ CH
4
+H
2
O 206
CH
4
+H
2
O ↔ CO +3H
2
+206
C+CO
2
↔ 2CO 172
C+H
2
0 ↔ CO + H
2
131
Table 3: Kinetic Parameters of Reactions (continue)
Zone A E
(kJ/kmol) (kJ/kmol)
Pirolysis
0.052 6.1× 10
7
Oxidation 2.2× 10
12
1.67× 10
8
4.4× 10
11
1.25× 10
8
6.8× 10
12
1.68× 10
8
Reduction 2.75× 10
10
6.1× 10
7
2.2× 10
7
1.9× 10
8
5.12× 10
14
2.73× 10
4
8× 10
7
2.51× 10
8
0.00732 1.125× 10
8
0.00782 1.15× 10
8
Figure 2: Result for simulation of oxidation zone : temper-
ature profile (
◦
C)
Numerical Study of Multistage Municipal Solid Wate Gasification Downdraft System with Air Ratio Pyrolysis, Oxidation, and Reduction
1:8:1
203
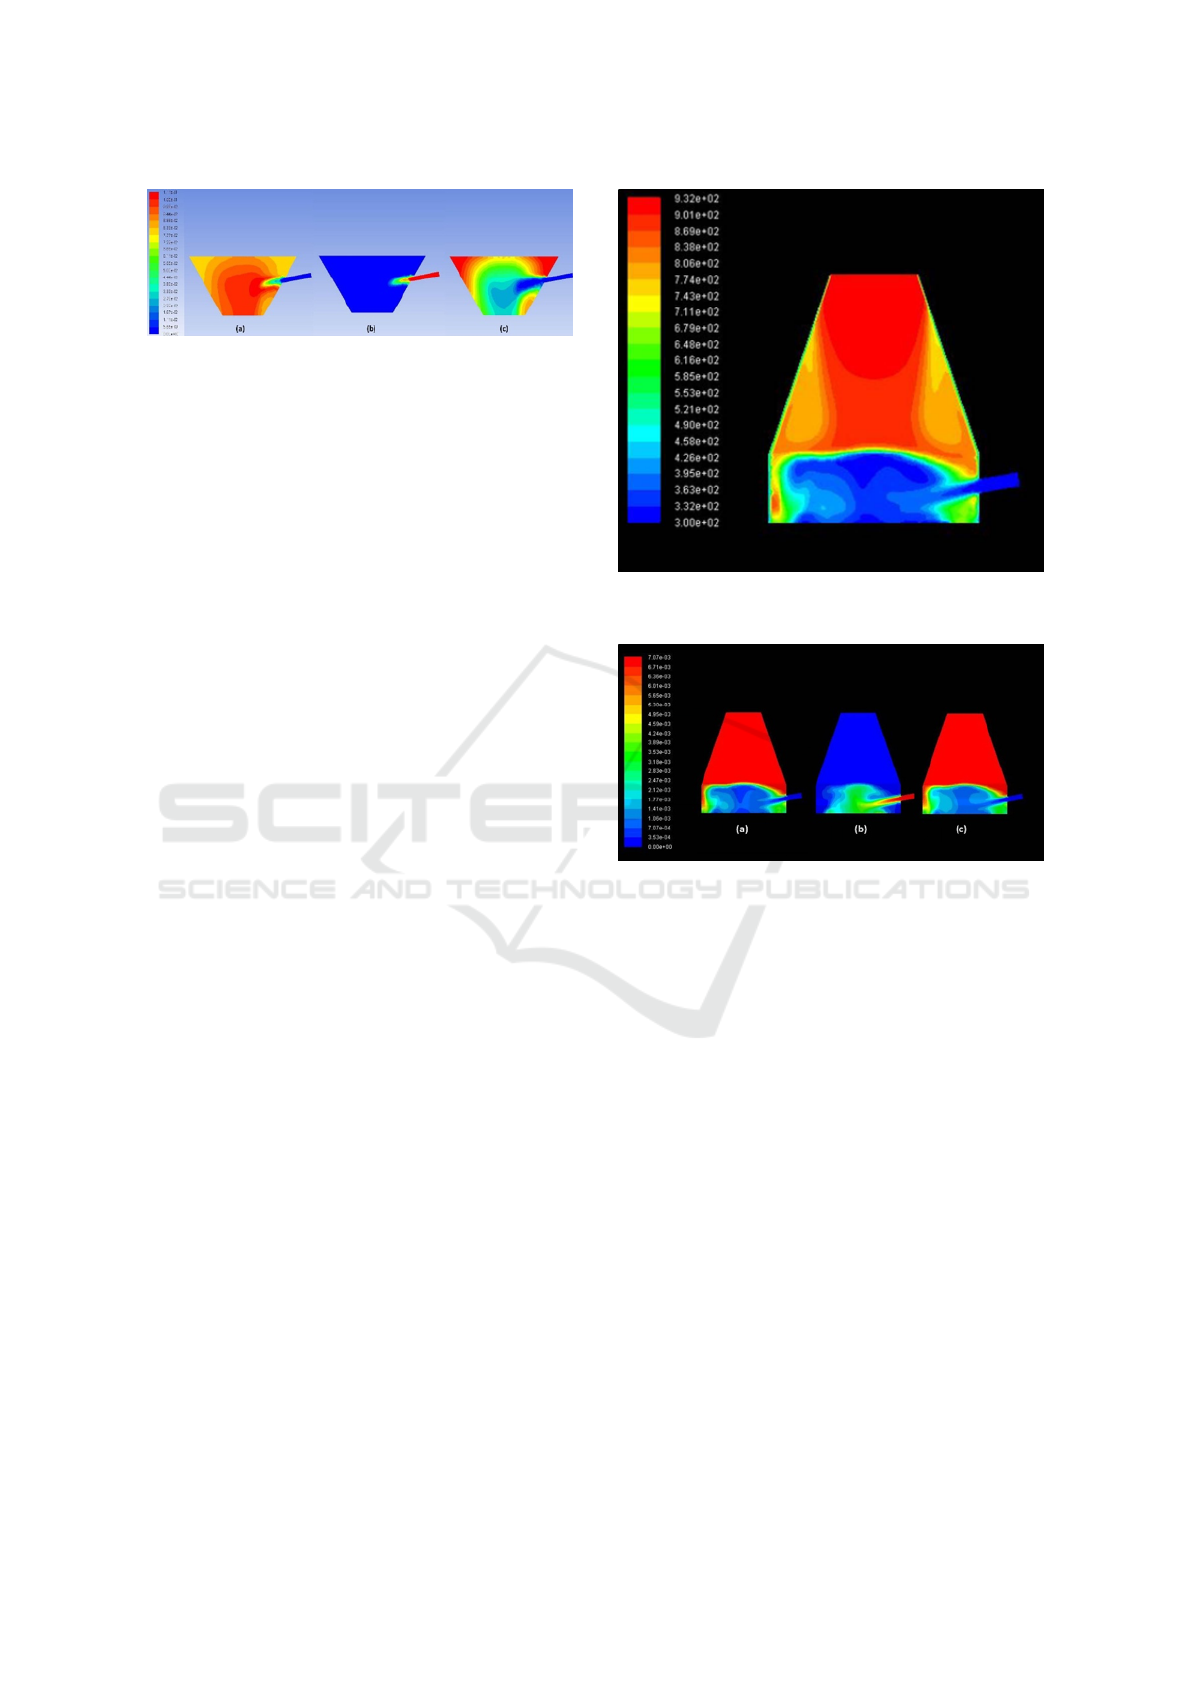
Figure 3: Result for simulation of oxidation zone : contour
of mole fraction of CO
2
(a), O
2
(b), CH
4
(c)
depicts the temperature profile, as expected, the max-
imum is found at the nozzle of the reactor. Such a
temperature results because the combustion process is
considered as adiabatic. The adiabatic flame temper-
ature is attainable when the reactor contains enough
stoichiometric oxygen. It is also observed that the
temperature distribution is not symmetrical with re-
spect to the centerline of the reactor.
The simulation also permits to obtain detailed in-
formation of each species distribution inside the re-
actor. Figure 3(a), shows the CO
2
fraction in the re-
actor. It can be observed that at the center part the
CO
2
concentration distribution is higher than that of
the outer region (walls). However, it is observed a re-
gion with a high quantity of CO
2
located at the upper
part of the reactor, where biomass is injected. Fig.
3(b), on the other hand, is the O
2
fraction in the re-
actor, it shows that at the nozzle of the reactor, the
O
2
fraction is higher than that of the other regions of
the reactor. As expected, the highest O
2
concentra-
tion is observed in the combustion zone where the air
is injected. Contrary to the CO
2
concentration dis-
tribution, the CH
4
concentration distribution is much
higher at the upper part of the gas reactor than that at
the lower part (Figure 3(c)).
4.2 Performance of the Reduction Zone
Figure 4 depicts the temperature profile, as expected,
the maximum temperature is 932.38
◦
C and is found at
at the upper part of the reduction zone, because of the
high temperature coming out of the oxidation zone.
Such a temperature results because the reduction pro-
cess also considered as adiabatic.
Figure 5 indicates that the highest CO
2
(a) and
CH
4
(c) concentrations are at the top of the reduction
zone because these two gases react with high temper-
ature air from the oxidation zone Fig. 5 (b) shows the
entrance of oxygen and its fast consumption in the re-
duction zone just below the nozzle. The sequence of
these events causes a stratified formation with high
porosity at the top of the reactor. The first event of the
thermal analysis corresponds to the moisture release
beginning at 400 K, and then in the pyrolysis stage
Figure 4: Result for simulation of reduction zone : temper-
ature profile (
◦
C)
Figure 5: Result for simulation of reduction zone :contour
of mole fraction of CO
2
(a), O
2
(b), CH
4
(c)
most of thermal energy is consumed by exothermic
reactions occurring in the combustion zone, this takes
place at temperatures which range 600–900 K. The
third event of the thermal analysis represents the re-
duction process where a new homogeneous reaction
occurs to compose into a low heat value syngas.
5 CONCLUSIONS
In this study, a comprehensive model for a downdraft
biomass reactor is developed and applied to the in-
dividual simulation of oxidation and reduction pro-
cesses. The model is able to correctly predict temper-
ature and gas composition. The predicted gas temper-
ature profile is consistent with the experimental data.
The effect that the different operating modes of the
reactor has on important output variables permits to
make suggestions regarding the optimization of the
different hermochemical conversion processes.
SENTA 2018 - The 3rd International Conference on Marine Technology
204

ACKNOWLEDGEMENTS
The author would like to thank the parties associ-
ated with this research and also for the location of re-
search at the Combustion and Fuel Techniques Labo-
ratory, Department of Mechanical Engineering Sepu-
luh Nopember Institute of Technology.
REFERENCES
Ahmed, T. Y., Ahmad, M. M., Yusup, S., Inayat, A., and
Khan, Z. (2012). Mathematical and computational ap-
proaches for design of biomass gasification for hydro-
gen production: A review.
Basu, P. (2013). Biomass Gasification, Pyrolysis and Tor-
refaction: Practical Design and Theory.
Dzulfansyah, D. (2014). Perancangan reactor gasifikasi
sekam padi tipe downdraft menggunakan analisis
computational fluid dynamics. PhD thesis, Sekolah
Pascasarjana IPB, Bogor.
Gai, C. and Dong, Y. (2012). Experimental study on non-
woody biomass gasification in a downdraft gasifier.
International Journal of Hydrogen Energy.
Hidayatulloh, D. (2018). Studi Numerik Pengaruh Variasi
Suhu Udara Inlet Zona Oksidasi pada Proses Gasi-
fikasi Pelet Municipal Solid Waste terhadap Karak-
teristik Reaktor Tipe Downdraft. PhD thesis, Institut
Teknologi Sepuluh Nopember.
Reed, T. B., Das, A., and Technical, S. (1988). Handbook
of Biomass Downdraft Engine System.
Sheth, P. N. and Babu, B. V. (2009). Experimental stud-
ies on producer gas generation from wood waste in a
downdraft biomass gasifier. Bioresource Technology.
Tuakia, F. (2008). Dasar-Dasar CFD Menggunakan Fluent.
Bandung Informatika, Bandung.
Vyarawalla, F., Parikh, P. P., Dak, H. C., and Jain, B. C.
(1984). Utilisation of biomass for motive power gen-
eration - gasifier engine system. Biomass.
Numerical Study of Multistage Municipal Solid Wate Gasification Downdraft System with Air Ratio Pyrolysis, Oxidation, and Reduction
1:8:1
205
