
The Design of Physical Model and Preparation of Experimental
Study on Articulated Tower – Ocean Wave Energy Converter
(AT-OWEC)
Eko B. Djatmiko
1
, Heri Supomo
2
, Setyo Nugroho
3
and Dwi P. Hendradhata
1
1
Department of Ocean Engineering, Institut Teknologi Sepuluh Nopember (ITS), Kampus ITS – Sukolilo, Surabaya 60111,
Indonesia
2
Department of Naval Architecture and Shipbuilding Engineering, Institut Teknologi Sepuluh Nopember (ITS), Kampus ITS
– Sukolilo, Surabaya 60111, Indonesia
3
Department of Sea Transportation Engineering, Institut Teknologi Sepuluh Nopember (ITS), Kampus ITS – Sukolilo,
Surabaya 60111, Indonesia
Keywords: Wave Energy, AT-OWEC, Physical Model, Experimental Study
Abstract: A new concept has been proposed to contribute in the development of national ocean renewable energy
program by the adoption of articulated tower structure for harvesting the ocean wave energy. Therefore the
new concept is designated as the articulated tower for ocean wave energy converter, abbreviated as AT-
OWEC. In the meantime, the establishment of AT-OWEC has come to the stage of the initial physical
modelling and preparation of experimental study. This is commenced by the design of AT-OWEC main
structure physical model by referring to the full scale structure, involving the rules of geometrical, kinematical
and dynamical similarities. Next is the design of instrumentation for motion data measurement and
acquisition, including necessary calibrations. This is followed by the plan of experimental work at the
hydrodynamics laboratory and the expected data to be gathered. Discussion will then be concluded by putting
forward results of numerical modelling on AT-OWEC dynamic behaviours prepared for comparison with
future experimental data.
1 INTRODUCTION
The Director of Various New Energy and Renewable
Energy (VNERE), Ministry of Energy and Mineral
Resources (MoEMR), Republic of Indonesia
describes the current condition of national energy
fulfillment in Indonesia eventually is still dominated
by the fossil energy (Direktur AEBET, 2013). This
comprises of oil 46.77%, coal 23.91% and natural gas
24.29%, therefore in total the proportion is as much
as 94.97%. The rest is supplied by new and renewable
energy (NRE), which contribute only in the order of
5.03%. This condition is recognized by various
parties as a matter of great concern, especially given
the declining national oil reserves. Although
Budiman et al. (Budiman, et al., 2014) is still advising
to increase the utilization of national natural gas and
coal potentials, efforts should be directed towards the
development of NRE.
The Director of VNERE (Direktur AEBET, 2013)
underlines that according to the Presidential
Regulation No. 5 of 2006 on National Energy Policy
the NRE development program has become a national
priority. In the presidential decree, it has been
declared that by 2025 the energy composition should
bring down the contribution of petroleum to 20%,
increasing natural gas to 30%, increasing coal to 33%,
and increasing NRE 17%. The current NRE
variability in Indonesia already includes globally
developed types, including geothermal, microhydro,
and biomass. By 2025 the national NRE variability
will be pushed further, namely geothermal 5%,
biomass 5%, liquid coal 2%, and other NRE up to 5%.
Other NRE types here include nuclear, solar, wind,
and others. Included in other components of NRE is
of course ocean energy.
Ocean energy is not quite developed and operated
globally, especially in Indonesia. The main obstacle
to the limited development of ocean energy,
according to Srikanth (Srikanth, 2014), is that
technology is not yet mature and stable, the cost is
12
Djatmiko, E., Supomo, H., Nugroho, S. and Hendradhata, D.
The Design of Physical Model and Preparation of Experimental Study on Articulated Tower – Ocean Wave Energy Converter (AT-OWEC).
DOI: 10.5220/0008544300120019
In Proceedings of the 3rd International Conference on Marine Technology (SENTA 2018), pages 12-19
ISBN: 978-989-758-436-7
Copyright
c
2020 by SCITEPRESS – Science and Technology Publications, Lda. All rights reserved

still relatively high and far from economies of scale,
only in certain locations and often non-mobile, etc.
Considering this, efforts are being made at various
universities and research institutions to develop a
relatively low cost ocean energy conversion
technology.
To meet the aforementioned challenges, early in
2017 a fundamental research on ocean energy
conversion has been initiated at the Laboratory of
Ocean Structure Hydrodynamics (Lab. OSH),
Department of Ocean Engineering (DOE), Faculty of
Marine Technology (FMT), Surabaya Institute of
Technology (ITS), Surabaya, Indonesia. As described
by Djatmiko et al. (Djatmiko, et al., 2017) the rese-
arch was established by the adoption of the well
known articulated tower (AT) platform technology to
be implemented as an ocean wave energy converter
(OWEC) system. Therefore the new concept is
designated as the articulated tower for ocean wave
energy converter, or shortly referred to as AT-
OWEC.
2 THE CONCEPT OF AT-OWEC
SYSTEM
Detail description on the concept development of AT-
OWEC system has been put forward by Djatmiko et
al. (2017). In principle the system adopts the AT
platform technology widely used in offshore oil and
gas industry since early 1970s as the primary dynamic
structure. The common AT design is preserved with
high stability to assure the safety and effective
operation of offshore oil and gas activities
(Chakrabarti & Cotter, 1980; Halvacioglu & Incecik,
1988; Bar-Avi & Benaroya, 1996; Chakrabarti, 2001;
Murtejo, et. al., 2005; Atkins, 2017). However for the
current AT-OWEC design, AT as the main
component is designed to be unstable by configuring
the buoyancy chamber in such a way the center of
gravity is located well above the structure. Like so it
could be expected AT to endure relatively larger
motion when excited by the wave action. Further, the
motion of the AT-OWEC main structure is restrained
in 1-DOF rotational pitch mode by connecting the
base of the supporting pole to a roller joint in the base
template at seabed.
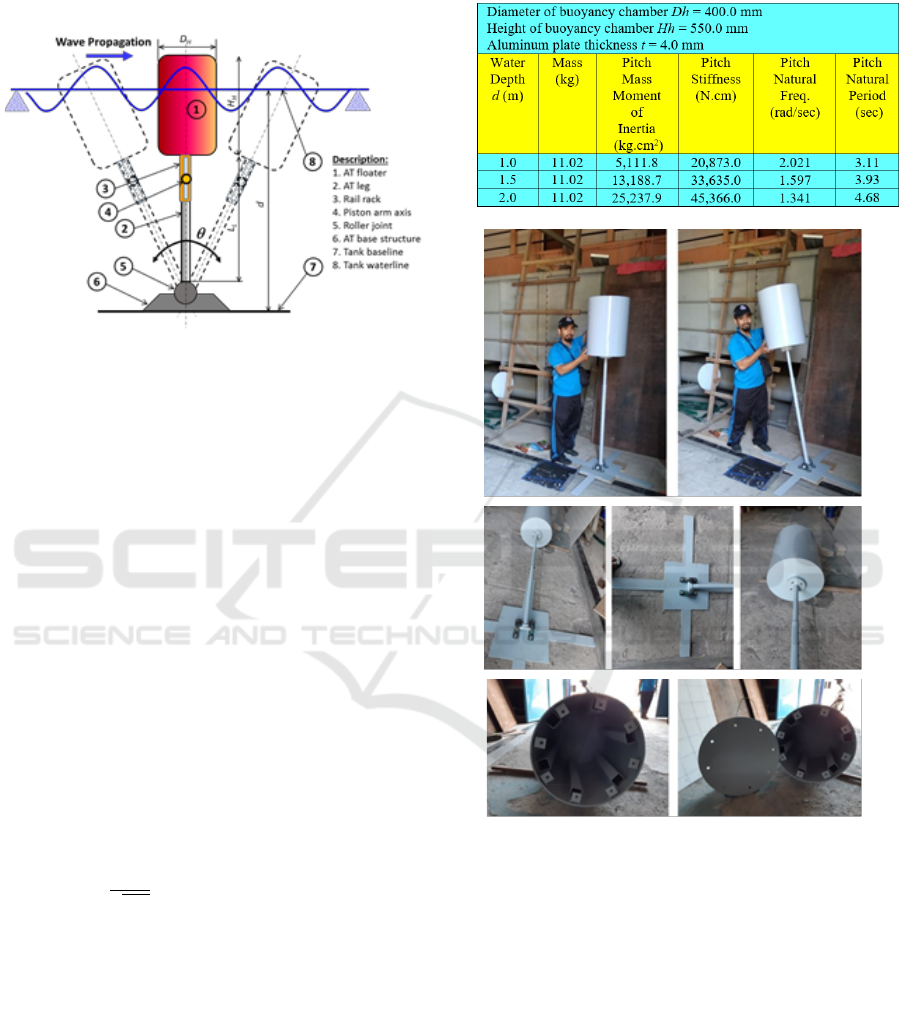
Figure 1: Schematic illustration of AT-OWEC system.
The large rotational pitch motion is then
transformed into translational motion via an axis arm
hinges connected to a double action piston pump
(DAPP) with single pivot, following the idea from
Choy (Choy, 2012). The DAPP is designed with a
single outlet, positioned in the water with an inlet on
each tube, in the plane of pitch motion. The design of
the axis arm hinges in such a way will be able to
transform the rotational motion into translational
motion of the shaft arm, and further the piston move-
ment. Positive or negative rotational motion will
induce the translational motion of each piston in a
double tube in the opposite direction. That way the
AT-OWEC rotational motion is positive and negative
will still produce the water jets out of the pump. The
water jet generated by the DAPP is directed drive a
water turbine and further generate electrical power, as
shown in Figure 1.
3 THE DESIGN OF AT-OWEC
PHYSICAL MODEL
The design of full scale AT-OWEC has been
established as explained in the research report
(Djtamiko, et al., 2017). In this respect parametric
study were carried out on circular and elliptical AT
buoyancy chamber, each with 9 combinations of
diameter Dh and height Hh. Hence overall there are
18 variations of AT-OWEC. For the purposes of
discussions in this paper only one variation is
selected, namely with Dh = 4.0 m and Hh = 5.5 m,
fabricated with steel material of 15.0 mm in
thickness. This structure is hypothetically to be
operated at the sea water depth variations of 10.0 m,
15.0 m, and 20.0 m.
The design of the physical model should meet
three similarity laws, namely: i) geometric similarity,
ii) kinematic similarity, and iii) (hydro)-dynamic
similarity (Djatmiko, 1987; Chakrabarti, 1998;
Grinius, 2006; Chanson, 2008; Munson, et. al., 2013).
The Design of Physical Model and Preparation of Experimental Study on Articulated Tower – Ocean Wave Energy Converter (AT-OWEC)
13
Further, the design also covers the material selection,
as well as structural components or scantlings.
Specifially the design of AT-OWEC main structure is
depicted in Figure 2.
Figure 2: Basic configuration and components of AT-
OWEC main structures.
In the design of AT-OWEC one primary
consideration to be accounted for is the size of towing
tank at Lab. OSH, which has a water depth d
b
of 2.0
m. This water depth is then correlated to the case in
the numerical study, where the system is to be
operated at maximum water depth of 20.0 m. In this
relation the scale factor of the model is then found to
be 1 : 10 for the geometrical similarity, or
l
= 10.
Therefore, the model geometri will be made to have
the size of 1/
l
to the full scale. Furthermore, the
extent of model’s mass, mass moment of inertia for
pitch motion, and the stiffness should comply with the
dynamic similarity, and are governed by the scale of
1/
l
3
, 1/
l
5
, and 1/
l
4
in relation the full scale.
For the kinematic similarity, the model should
have a natural frequency comparable to the full scale.
This is to be determined by the equivalency in the
non-dimensional frequency
w
' as given in the
following equation:
𝜔
"
=
$
%
&/(
(1)
The variables in eq. (1) are, respectively,
w
is the
wave frequency, g is acceleration due to gravity, and
L is length of the object. In the case of AT-OWEC L
is equivalent to Dh.
Further the design taking also the stage of material
selection to assure the model will meet the similarity
lawas as described above. After some exploration it is
then decided to select aluminum as the primary
material for the buoyancy chamber. At this point the
design of AT-OWEC physical model is concluded, as
shown in Table 1, and ready for the construction.
Table 1: Data of AT-OWEC model main structure as
function of water depth variations.
(a)
(b)
(c)
Figure 3: Physical model of AT-OWEC main structure.
The physical model has been constrcuted and its
photos are displayed in Figure 3. In here, Figure 3a
presents the AT-OWEC model in straight up and
inclined positions, making use of the roller joint at the
pole base. Model comprises three main components,
i.e. cylindrical buoyancy chamber, supporting pole,
and base template. Between the pole and cylinder, as
revealed in Figure 3b, is furnished with bolted
connector which could be released to take off the
cylinder from the pole, and other cyinders of different
sizes and configuration whenever available could
then be fitted. Figure 3b also depicts the base template
so designed to ease the installation of the structure on
SENTA 2018 - The 3rd International Conference on Marine Technology
14
the towing tank base. At the center of the base tem-
plate is located a roller joint as the rotational axis of
the AT-OWEC. Figure 3c shows the internal space of
the cylinder which is equipped with some vertical
square tube which can be filled with solid
counterweight to adjust the dynamical properties of
the model. The upper part of the model equipped with
the cover to assure the watertightness during the test
is performed.
4 DESIGN AND ASSEMBLY OF
TEST INSTRUMENTS
Experiments or test models are to be carried out
primarily to measure the motion of the AT-OWEC
structure when subjected to the excitation of regular
wave loads in the towing tank. In this case the motion
measuring instrumentation will be designed
consisting of two types. First is the 3-axis accelero-
gyro instrument or gyroscope, which functions to
measure the model motion based on the acceleration
of translational and rotational motions. The
gyroscope instrument to be used is MPU 6050 GY87,
capable of producing angle output formed by MPU
6050. In MPU 6050 there is an axis of orientation x,
y and z, which will produce the respective angle of
deviations. The magnitude of the angular deviation
will be amplified and received by the Arduino UNO
microcontroller and then be transferred to a laptop
computer in digital quantities. The gyroscope sensor
instrument, as in Figure 4 is placed at the top of the
AT-OWEC cylinder cover.
Figure 4: Gyroscope to measure the model pitch motion.
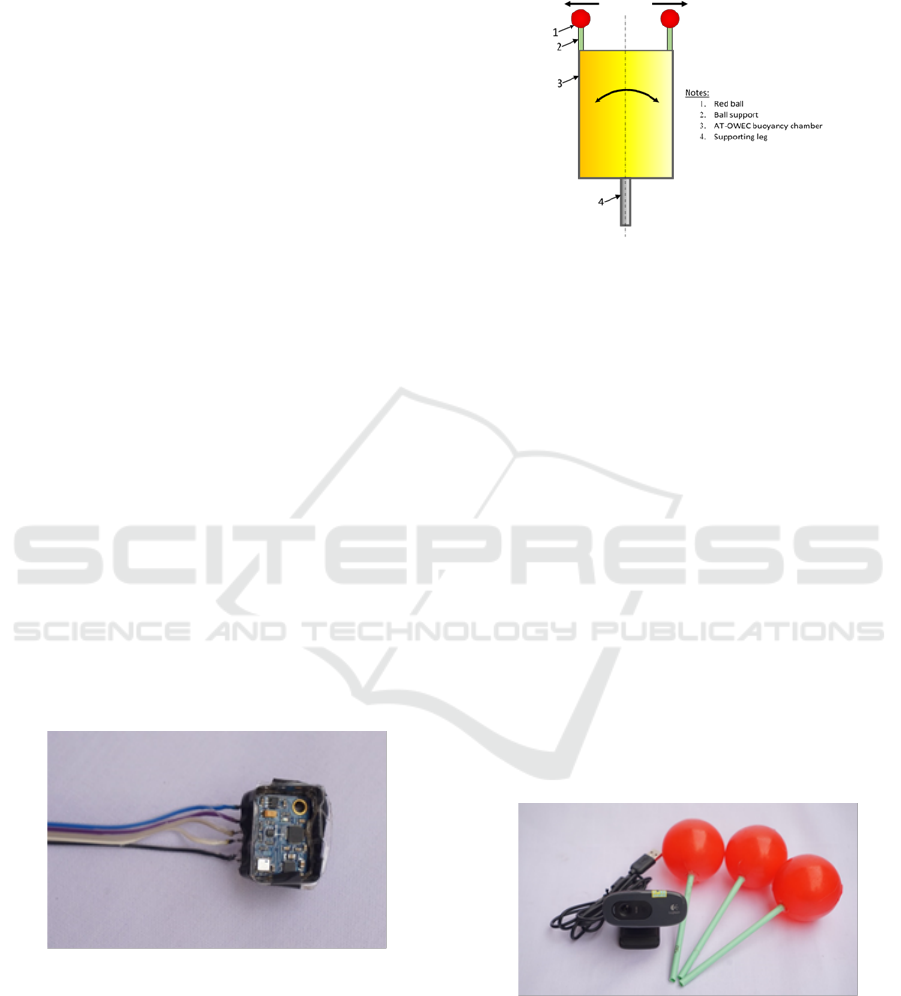
Secondly, as a checking instrument, visual tracer
movements will be used in the form of target objects,
namely two red plastic balls mounted with a support,
and placed in two parallel upright positions at the top
side of AT-OWEC floating cylinder, as can be seen
in Figure 5. The target movement will be recorded by
a video camera. Video recording can be downloaded
by the appropriate software on a data processing
computer, through digital image processing (DIP).
Figure 5: Positioning red balls as visual tracing target.
DIP is the processing of two-dimensional images
by a computer device, which is the process of taking
image attributes with input and output in the form of
images. In this study DIP is used for the detection of
objects in the video which is used to analyze the
translational motion in x-direction or surge that
occurs in the AT-OWEC model when afloats in the
towing tank and is exposed to waves with a number
of period variations. In the process of representation
and modeling of an image, the quantity and character
of the picture element (pixel) describe an object.
Pixels are small units of dots that make up an image.
Each pixel in the image stores the color information
represented by the pixel. The number of pixels that
make up an image depends on the resolution or
density of the desired color. The DIP process here is
done using a Logitech c270 webcam camera, as
shown in Figure 6 which records video. Where from
the video consists of many frames which are then
processed using the help of visual basic c ++
software.
Figure 6: Digital camera and red ball visual tracing
targets.
In addition to instrumentation for measuring the
model structural motions, load cells are also made
available in the test, as shown in Figure 7. These are
The Design of Physical Model and Preparation of Experimental Study on Articulated Tower – Ocean Wave Energy Converter (AT-OWEC)
15
utilized to measure the load acting on the pole of the
structure.
Figure 7: Load cell instrument to measure the load on AT-
OWEC supporting pole.
The next instrument to be used in the test model
are wave probes, which are devices to measure wave
elevation. The wave probes used are three units over
all, one is placed at a distance of about 3.0 m from the
wave maker or wave generator, and the other two are
positioned in the vicinity of the model. Thus, from the
three wave probes, it can be checked if there is a
significant change in the wave profile during one set
of test is executed.
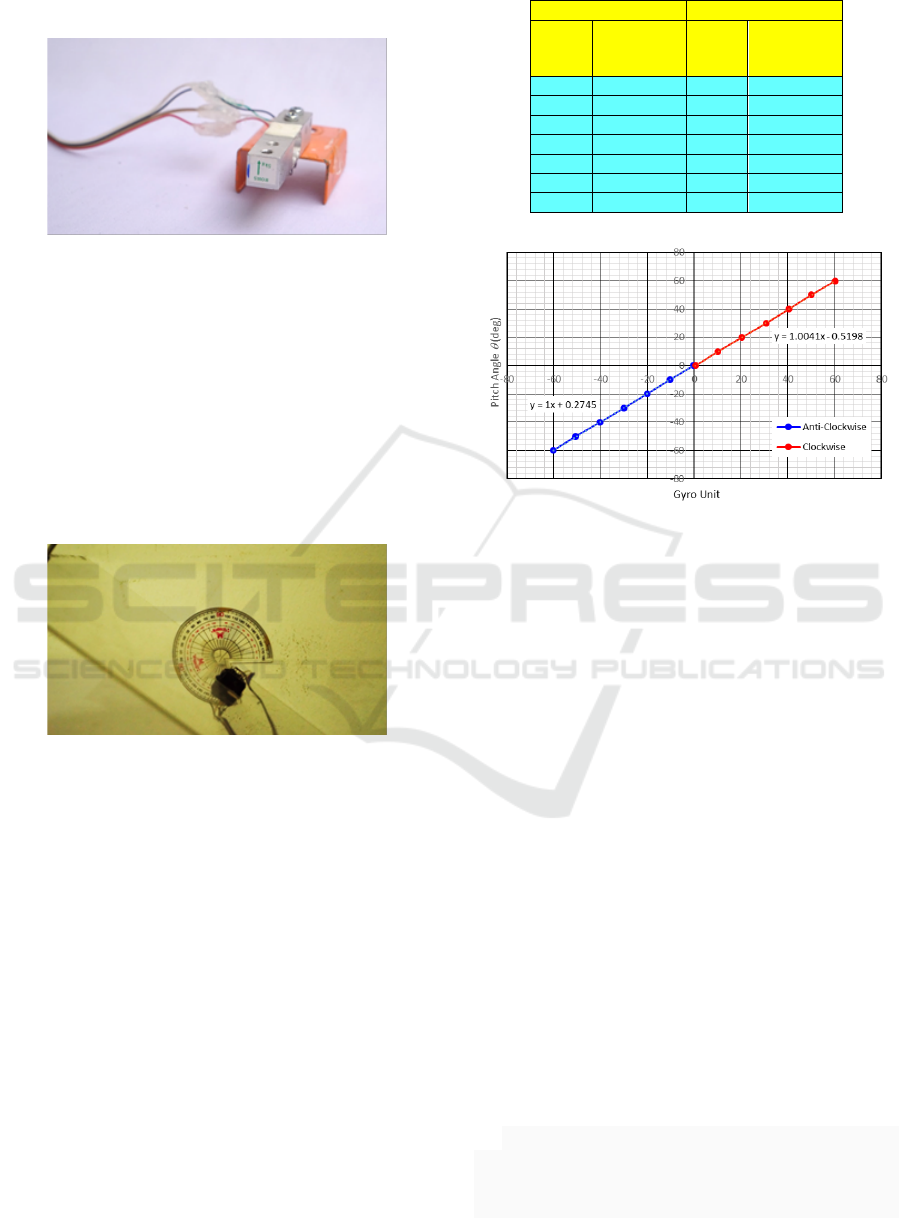
Figure 8: Calibration of gyroscope on swivel board with
ruler arc.
Calibration on all measuring instruments were
conducted to generate reference data to be inputted in
the data acquisition system (DAS). Anytime the test
is run and instruments measure the related variables
to be transferred in the DAS, it will then be adjusted
into the actual values of output data. An example of
calibration is demonstarted for the case of gyroscope.
As shown in Figure 8 it is performed with the aid of a
swivel board equipped a ruler arc. The gyroscope is
placed on the swivel board and then turned gradually
from 0
o
up to 60
o
, at interval of 10
o
. The digital output
of gyroscope is then correlated with the turning angle,
as presented in Table 2. This is further used to plot a
graphical correlation to derive the calibration
equation as contained in Figure 9.
Table 2: Calibation data for gyroscope:
Anti-Clockwise
Clockwise
Angle
(deg)
Gyro
Output
(unit)
Angle
(deg)
Gyro
Output
(unit)
-0º
-0.37
0º
0.60
-10º
-10.38
10º
10.20
-20º
-20.14
20º
20.42
-30º
-30.05
30º
30.75
-40º
-40.18
40º
40.44
-50º
-50.61
50º
50.05
-60º
-60.20
60º
60.30
Figure 9: Calibration chart and equation for gyroscope.
5 DESIGN AND PREPARATION FA
DATA ACQUISITION SYSTEM
Data acquisition system (DAS) is a series of
measurement instruments, supporting instruments
and collecting software and data recorders in a
computer. In this study the DAS is arranged as shown
in Figure 10. The first element is in the form of
measurement instrumentation described in section 4,
namely a gyroscope, a load cell and three wave
probes.
The second element is a multi-channel amplifier,
which functions to increase the voltage generated by
the measuring instrument, which in this case is the
load cell and wave probes. Voltage fluctuations that
occur are derived from the help of resistors or
capacitors that work on the instrument. For the
purpose of transforming from voltage fluctuations
into digital data, it is necessary to first calibrate
related instruments. While the gyroscope does not
require an amplifier. The third component is the
micro-controller, which regulates signal fluctuations
from direct measuring instruments and amplifiers.
From the micro-controller the electronic signal is
transmitted to the micro-processor, as the fourth
component. This equipment consists of digital
circuits, registers, arithmetic logic processors, and
SENTA 2018 - The 3rd International Conference on Marine Technology
16
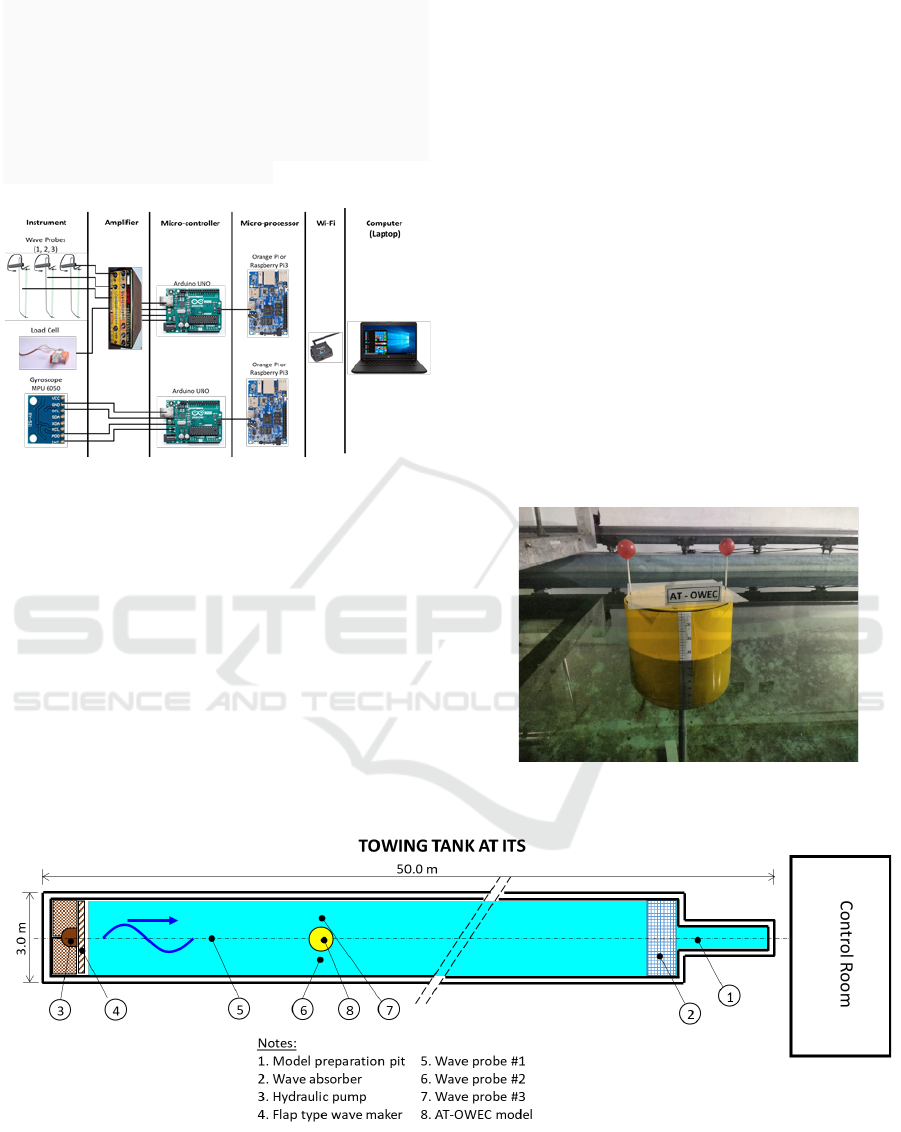
sequential circuits. The role of microprocessors in the
system is as a unit that controls the entire system
work. Take instructions and data from memory, move
data to and from memory, and send signals. Signal
delivery from the microcomputer is done wirelessly
through the help of Wi-Fi, as the fifth component.
Finally the digital signal will be received by the
computer as the sixth component.
Figure 10: The general diagram of data acquisition system.
Inside the computer there is software that will pro-
cess digital data coming from signal wave probes,
gyro-scope, and visual tracer camera recordings. The
raw digi-tal data from each of these equipment will be
processed into real motion elevation data at any
elapsed time, taking into account relevant calibration
data.
6 PREPARATION OF
HYDRODYNAMIC MODEL
TESTING
Figure 11: Towing tank and the positioning of AT-OWEC
model.
Experimental study or hydrodynamic tests on the
physical model of AT-OWEC will be carried out at
the Lab. HBL, DOE - ITS, in a towing tank sized 50
m x 3 m x 2 m (LxBxd). This test tank is equipped
with a wave generator of a flap type, which is driven
by a hydraulic machine. Generated waves can be
either regular or random. But in the present study
regular waves only will be used.
Diagramatically the towing tank can be explained
by referring to Figure 11. At the right end there is a
small pool or pit, as a place to prepare the model
before the test. Right on the lip of the small tank, a
wave absorber is installed. At the left end of the pool
is a hydraulic machine positioned to drive the wave
generator. In this study the AT-OWEC model was
installed at a position of about 25.0 m from the wave
generator. Regular waves will propagate from the
generator towards the wave absorber. With the
absorber, there is a possibility to restraint the
emergence of a reflected wave from the right side,
which is likely to disrupt the generated wave profile.
Figure 12: AT-OWEC model installed in the towing tank.
The AT-OWEC model installed in the towing
tank is as shown in Figure 12. Wave elevations will
be detected by the first wave measuring instrument or
wave probe (WP # 1) positioned in the center axis of
the pull pool at a distance of 15.0 m from the plant.
The Design of Physical Model and Preparation of Experimental Study on Articulated Tower – Ocean Wave Energy Converter (AT-OWEC)
17

With this position allows the measured waveform to
show a profile that is not disturbed by the presence of
objects in the water. Two other wave probes, namely
WP # 2 and WP # 3 are placed on the transverse sides
of the model at a distance of about 0.75 m. Both WPs
will record wave patterns that may be deformed by
the presence of the model.
The test will be carried out by generating waves,
measuring 5.0 cm high or 2.5 cm amplitude. The
wave period is varied from 1.0 sec to 8.0 sec, where
between 1.0 and 5.0 sec the increase interval is 0.5
sec, while between 5.0 sec and 8.0 sec the increase
interval is set to 1.0 sec. Data test recording will be
carried out with a sample density or sampling rate of
10 Hz, or 10 samples per second. Thus it is believed
that it will be able to provide a fairly smooth elevation
curve.
7 NUMERICAL PREDICTION OF
AT-OWEC MOTIONS
The beginning of this study has begun with numerical
modeling of the main structural variants of AT-
OWEC measuring the diameter and height of the
buoyancy chamber, respectively, Dh = 4.0 m and Hh
= 5.5 m, notionally to be operated in three variations
of sea depth d of 10.0 m, 15.0 m and 20.0 m. At this
stage the structure is assumed to be fabricated with
steel material. The choice of this variant is done with
consideration to get a system that has a larger
movement. The main data of the variants reviewed,
including mass, moment of inertia, mass of pitch
movement, stiffness of pitch movement and natural
frequency of pitch movement as a function of water
depth d are as shown in Table 3. It is obvious when
comparing the data in Table 3 and those in Table 1,
although the units are different but the values of mass,
mass moment of inertia, as well as stiffness are quite
similar, i.e. in the order multiplication of
l
= 10. The
differences are also notable for the case of pitch
natural frequencies and periods, due to the scaling as
described in eq. (1).
Table 3: Data of full scale AT-OWEC main structure as
function of water depth variations.
Figure 13: Results of numerical prediction on Pitch RAO of
AT-OWEC sized Dh = 4.0 m and Hh = 5.5 m at three water
depth variations.
Numerical modelling of AT-OWC pitch motion
has been carried out using the software based on 3-D
diffraction theory. Mathematical formulation of
dynamic behaviour was developed with the
implementation of pulsating-source theory
distributed on the panels enclosing the buoyancy
chamber, as described in the references (Murtejo, et.
al., 2005; Atkins, 2017; Choy, 2012; Djatmiko et. at.,
2017). With the input data of the structure in Table 3
the modelling is executed for variations in the regular
wave frequency between 0.2 up to 2.0 rad / sec.
Output data from running the software in the form
of AT-OWEC RAO pitch motion are as presented in
Figure 13. It is interesting to observe this graph,
where the largest response occurs when AT-OWEC
is operated at a depth of d = 10.0 m, with the peak
reaching around 38.0 deg/m. The area under the curve
for this case is also quite large, thus indicating the
capacity to absorb relatively large wave energy.
When the operating depth rose to 15.0 m and 20.0 m
apparently the motion intensity decreased,
respectively, only reaching around 25.0 deg/m and
20.0 deg/m. As a consequence the area under the
curve also decreases. This means that there will not
be enough wave energy that will be absorbed.
Especially if considering the occurrence of waves
with large periods, above 12.0 seconds, the number of
occurrences is relatively rare.
The numerical modelling results so presented are
prepared for a comparative study with the results of
the AT-OWEC model test, which will be
implemented in the near future. In due course the
results of the comparative study will be published in
the appropriate dissemination forum or scientific
journal.
SENTA 2018 - The 3rd International Conference on Marine Technology
18

8 CONCLUSIONS
This paper presents a stage in the development of AT-
OWEC research, which involves the preparation of
physical test models at the Laboratory of Ocean
Structure Hydrodynamics, DOE - ITS. A number of
important aspects that have been explained can
further be summarized as follows:
• The AT-OWEC physical model measures 1 : 10
to the full scale, sized Dh = 400 mm and Hh =
550 mm, made of aluminum material, and has
been designed to meet geometric, kinematic and
dynamic similarities;
• The pitch motion measurement will be carried
out utilizing the gyroscope as primary
instrument, assisted by checking the target
visual tracing recorded through a digital
camera;
• Data acquisition system has been prepared with
appropriate tools to produce outputs that take
into account the appropriate calibration factors;
The results of numerical modelling of pitch moti-
ons have been prepared as data for comparative
studies with the results of the test model, which will
be implemented in the near future.
ACKNOWLEDGEMENTS
The authors are deeply grateful to the Ministry of
Research Technology and Higher Education,
Republic of Indonesia, for providing the research
grant to AT-OWEC establishment through the
Higher Education Primary Basic Research (PDUPT)
scheme in the fiscal year of 2018.
REFERENCES
Atkins, 2017. Chrysaor Solan Development, North Sea
(West of Shetland), WS Atkins Plc.. [Online]
Available at: http://www.atkinsglobal.com/zh-
cn/projects/solan-offshore-development
[Accessed 22 2 2017].
Bar-Avi, P. & Benaroya, H., 1996. Planar motion of an
articulated tower. J. of Sound and Vibration, 198(1), pp.
27-50.
Bar-Avi, P. & Benaroya, H., 1996. Response of a two
degrees of freedom articulated tower to different
environmental conditions. Int. J. of Non-Linear
Mechanics, 31(5), pp. 717-741.
Budiman, A. et al., 2014. Sepuluh Gagasan untuk
Menguatkan Kembali Sektor Energi Terbarukan.
s.l.:Global Energy & Materials, McKInsey &
Company.
Chakrabarti, S., 2001. Stability analysis of interaction of an
articulated tower with waves. WIT Trans. on the Built
Env., Volume 56, pp. 1-10.
Chakrabarti, S. K., 1998. Physical model testing of floating
offshore structures. Huston, Texas, USA, Dynamic
Positioning Conf., Marine Technology Society.
Chakrabarti, S. K. & Cotter, D. C., 1980. Transverse motion
of articulated tower. J. of Waterways, Port, Coastal and
Ocean Division, ASCE, p. 107.
Chanson, H., 2008. Physical modelling, scale effects and
self¬similarity of stepped spillway flows. Honolulu,
Hawai, USA, World Environmental and Water
Resources Congress 2008, ASCE.
Choy, L. T., 2012. Blue Energy - Ocean Power (Piston
Pump & Racks). s.l. Patent No. International Patent
Application No. PCT/SG2011/000232.
Direktur AEBET, 2013. Kebijakan pengembangan dan
peman¬faatan sumber energi terbarukan. Yogyakarta:
Lokakarya Nasional VI: Manajemen Penelitian dan
Pengabdian Kepada Masyarakat di Perguruan Tinggi.
Djatmiko, E. B., 1987. Experimental investigation into
SWATH ship motions and loadings. M.Sc. Thesis ed.
Dept. NAOE, Univ. of Glasgow, UK.
Djatmiko, E. B. et al., 2017. Concept Development of
Articulated Tower – Ocean Energy Converter (AT-
OWEC). Int. Conf. on Marine Tech. SENTA 2017,
Surabaya.
Djtamiko, E. B., Syahroni, N. & Sujantoko, 2017.
Perancangan dan analisis sistem konversi energi
gelombang laut berkonfigurasi articulated tower.
Laporan Akhir Program Penelitian Laboratorium, Dana
Lokal ITS, Surabaya.
Grinius, V. G., 2006. Physical model testing of floating
struc¬tures innovations and challenges. US/EU Baltic
Int. Sympo, Klaipeda, Lithuania.
Helvacioglu, I. H. & Incecik, A., 1988. Dynamic analysis
of coup¬led articulated tower and floating production
sys¬tems. Huston, Proc. of the 7th Int. Conf. on
Offshore Mechanics and Arctic Engineering, ASME.
Munson, B. R., 2013. Fundamentals of Fluid Mechanics.
7th ed. New York: WileyPLus.
Murtedjo, M., Djatmiko, E. B. & Sudjianto, H., 2005. The
influence of buoyancy parameters on the dynamic
behavior of articulated tower. J. Mekanikal, UTM,
Volume 19, pp. 32-47.
Srikanth, N., 2014. Barriers to ocean energy technology
adop¬tion and role of policies & institutional system to
promote in Asia, Presentation Energy Research
Institute, Nanyang Technological University,
Singapore.
The Design of Physical Model and Preparation of Experimental Study on Articulated Tower – Ocean Wave Energy Converter (AT-OWEC)
19
