
The Effect of Angle of Attack and Chord Length of the Foil on Winged
Air Induction Pipe Optimization toward Drag Reduction by using
Numerical Approach
Yanuar
1
∗
, Muhammad Alief
1
, M. Akbar
1
, Fatimatuzzahra
1
, and Made
1
1
Department of Mechanical Engineering, University of Indonesia, Depok, Indonesia
Keywords:
Micro-bubble, Winged Air Induction Pipe (WAIP), foil, Angle of Attack, Chord Length, Drag Reduction.
Abstract:
In response to achieve better energy efficiency on the ship we propose the usage of air lubrication to reduce
ship drag. Winged Air Induction Pipe (WAIP) device that we used, will create micro-bubble to coat the bottom
of the ship by pulling air through induction pipe. Because of this phenomenon the drag reduction will occur.
The customization placement of the foil will give the different result of drag reduction experienced by plate
located after the foil. But, on this research we will see the different results of drag reduction caused by angle
of attack of the foil and its chord length. By using k-ω SST (shear stress transport) model on ANSYS 2-D
fluent in our numerical simulation we can see how those customization and setup affect the result. On the
analysis we see the correlation between chord length and angle of attack of the foil that give most efficiency
for the ship. With this setup the drag reduction reach 3% of efficiency.
1 INTRODUCTION
Ships are the most important aspect on the distribution
of goods all around the world. According to Hydros
Foundation, there are 50.000 Cargo ships that sail ev-
ery day. All of those ships burn around 150 to 300
tons of fuel each day and produce 120 million tons of
carbon dioxide emission gas every year. Even though
it creates such an efficient way on transferring goods,
it becomes such the biggest contributor on why global
warming happens.
Many efforts have been taken to reduce the con-
sumption of fuel and emission gases. One of which
is by reducing the resistances of ship so that the en-
ergy needed by ships will be much lesser. Huge im-
pact given by friction resistance makes it one of main
components needed to be reduced. Reducing friction
resistance can obtain bigger velocity, save more en-
ergy over the pump system, increase efficiency, re-
duce fuel consumption and minimize the operational
bill as well as the emission gases (Pang et al., 2014).
Speaking of which, there are 2 components that
affect ship’s friction resistance which also reduce the
velocity of the ships, they are water density and wet-
ted surface area of the hull. Reducing local water
density can be attained by layering up the ship’s hull
with micro-bubble so that can lower the mean density
of two phases flow in the boundary layer when the
flow is turbulent (Uhlman, 1987; Yanuar et al., 2012;
Zhang et al., 2018). Therefore, the reduction of lo-
cal water density makes not only its viscosity much
lower, but also make the Reynold shear stress.
This method of air lubrication is proved that it is
able to reduce the ship’s friction resistance up to 10-
15% (Kodama et al., 2000). However, this reduction
is accompanied by the undeniable energy needed to
inject micro-bubble into the water. This energy re-
quired adiabatic compression energy, the energy to
generate micro-bubble and mechanical losses in the
compressor (Kumagai et al., 2015). Hence, it causes
the net total reduction around 0-5% and hampers the
application of the full scale ship.
To overcome this, Kumagai et al. (2015) used bub-
ble generating device called Winged Air Induction
Pipe (WAIP). Hydrofoil was attached below micro-
bubble injector to create low pressure area on the up-
per surface of the hydrofoil when the ship was trav-
elling. The low pressure could make the atmospheric
air enter the flow without using compressor. Yet, there
are some variables required, they are shapes and di-
mension of the hydrofoil, angle of attack, clearance
between WAIP to the hull, flow types, etc. These re-
late to the relationship among variables which is diffi-
cult to imagine, so that the determination of how high
Yanuar, ., Alief, M., Akbar, M., , F. and , M.
The Effect of Angle of Attack and Chord Length of the Foil on Winged Air Induction Pipe Optimization toward Drag Reduction by using Numerical Approach.
DOI: 10.5220/0008543401190125
In Proceedings of the 3rd International Conference on Mar ine Technology (SENTA 2018), pages 119-125
ISBN: 978-989-758-436-7
Copyright
c
2020 by SCITEPRESS – Science and Technology Publications, Lda. All rights reserved
119

or low the variables to make the most possible opti-
mum rate is still hard to be defined. Besides, for those
bigger ships which have deep full water, pressure cre-
ated is not so low, so additional blower is needed to
maximize micro-bubble injection.
On their research, Kumagai et al. (2011) used
angle of attack variations by the magnitude about
12
◦
,16
◦
,and 20
◦
with the same length hydrofoil and
injection hole. However, length required for the hy-
drofoil was not elaborated briefly. Therefore, this re-
search is going to make variation on the same amount
of angle of attack about 12
◦
,16
◦
,and 20
◦
but with
length variation of hydrofoil around 30,35,40,45,50
[mm], so that can generate different data variation
each angle of attack in every length of hydrofoil. Con-
sequently, it can be taken from optimal angle of attack
and length of hydrofoil to reduce the resistances of the
ship.
2 THEORY
2.1 Experimental Theory
The moving foil in a flow will result in the negative
pressure of the area in the foil surface (Ockfen and
Matveev, 2009). Then, atmospheric air will be pulled
when the negative pressure value made higher than
the hydrostatic pressure (Series A, 1779), where
∆P ≥ ρgh (1)
where
∆P = 1/2C
p
ρU
2
(2)
and
ρgH = (ρ − ρ
air
)gH (3)
In sequencing, C
p
is the negative pressure coeffi-
cient in the foil, ρ is the density of fluid, U is velocity
of the fluid and H is the distance from draft to the
WAIP installed area.
However, the higher the value of ∆P does not de-
termine that the bubble will be formed. So that we
should still watch the limit of how fluid stream by
U ≥ U
E
(4)
where
U
E
∼
=
s
2gH
C
p
(5)
Therefore, from the formula above, we can notice
that it is the value of C
p
which determines whether
in certain condition the bubble will be formed or not.
In addition, the higher the C
p
value, the higher the
value of P will be while the U
E
will be smaller. In
other words, the first requirement of drag reduction
creation will be fulfilled (Cui et al., 2003)(Shereena
et al., 2013). This is due to the effect of how high the
value of U compare with the value of U
E
when the
bubble is created, which has been proved by Kumagai
et al. (2015).
From the WAIP experiment in towing tank Kuma-
gai et al. (2010) the injected energy will be smaller
when meeting this formula:
C
p
α >
A
B
C
D
∼
=
L
h
b
C
D
sinθ (6)
when L, h
b
and θ in sequence are cord length, air
bubble mixed layer, thickness, and angle of attack of
hydrofoil. With this formulation, L and θ in foil ad-
equately affect the amount of C
p
value. Net power
saving will be greater if the value of C
p
/C
D
is also
greater (Kumagai et al., 2015). Therefore, by arrang-
ing L and θ foil, we will manage to get the same value
of C
D
as we expected then it will result in the highest
net power saving in this phenomenon.
Besides, to understand whether a WAIP is able to
create bubble or not, we can look at how the energies
working in the installed tool area. If the W
t
otal gets
zero, it can be concluded that there is bubble without
extra injection.
W
total
= W
0
−W
L
+W
D
(7)
W
0
is the variable which describes the energy needed
to inject bubble into the stream when the energy de-
termined by how deep the installed tool are (H) and
the flux volume (Q)
W
0
= ρgHQ (8)
W
L
is the variable representing the negative energy
obtained by the the installment of WAIP (foil). The
value of W
L
is determined by how great the C
p
value
and certain flow velocity (U).
W
L
= 1/2C
p
ρU
2
0
Q (9)
W
D
represents the energy formed when the Drag force
in WAIP (foil) installed. C
D
in the foil and the area of
the foil contacted with fluid determine the value of
W
D
.
W
D
= 1/2C
D
ρU
2
0
A (10)
Hence, the energy forming the bubble will touch the
zero point if the value of C
P
in the foil is as high as
possible and the value of C
D
is as low as possible.
SENTA 2018 - The 3rd International Conference on Marine Technology
120

2.2 Computational Theory
Along with set-up when has been prepared, there are
some formulations which can explain how this set-up
is able to represent the model being made. By using
RANS Reynold Averages Navier Stokes Equation we
can simulate how the flow visualised in our simula-
tion. RANS is an equation that explain how the flow
and its component happen. It also describes many
phenomenons such as transient, viscous, incompress-
ible, two phase flow and three dimensional (Muste
et al., 2009). The formulation is described as follow :
∇U = 0 (11)
δρU
δt
+ ∇(ρUU
T
) = −∇p∗ + ∇(µ∇U)+ ∇(ρτ) + S
(12)
where U = (u
x
+ u
y
+ u
z
) is the velocity vector. t
is time. ∇ is vector differential factor. p
∗
is rela-
tive pressure. ρ and µ are fluid properties the density
and the dynamic viscosity, respectively. τ is Reynold
stress tensor for turbulence flow, which we will be
using the k-ω SST equation for this research. With
many factors and considerations we use the k-ω SST
to be our main method and equation on this research.
2.2.1 SST k-ω
Generally, Shear-Stress Transport (SST) k-ω is em-
ployed as the modelling. In the consideration that
this modelling can calculate more accurately on the
turbulent flow near the wall, then this also correct
in the advanced way relating to the roughness effect
in the skin friction and thermal flux which occur on
the modelling process (Olazabal-Loum
´
e et al., 2017).
Roughness is being essential since it is the rough-
ness which causes the friction resistance, the alter-
ation of flow formation and the velocity difference in
the boundary layer. These points should be consid-
ered and emended, reckoning that the foil passing the
flow will bear the phenomena above. Furthermore,
this model can simulate directly two turbulence to-
wards the wall boundary instead of correlating near
wall and far field region by empirical wall function
(Mohanarangam et al., 2009). The formulation is de-
scribed as follow; Kinematic Eddy Viscosity
ν
T
=
a
1
k
max(a
1
ωSF
2
(13)
Turbulence Kinetic Energy
δk
δt
+U
δk
δx
j
= P
k
− βkω +
δ
δx
j
(ν + σ
k
ν
T
)
δk
δx
j
(14)
Specific Dissipation Rate
δω
δt
+U
j
δω
δx
j
= aS
2
− βω
2
+
δ
δx
j
(ν + σ
k
ν
T
)
δk
δx
j
+ 2(1 − F
1
)σ
ω2
1
ω
δk
δx
i
δω
δx
i
(15)
The turbulence kinetic energy k and specific dis-
sipation rate w are estimated from the boundary con-
dition of turbulence quantities turbulence intensity I
and length scale l, where the formulation is ;
k =
3
2
(U
avg
I)
2
(16)
and
ω =
k
1/2
c
1/4
µ
i
(17)
Due to the differences in flow phases after air
sucked in to the water and its mass velocity, the com-
parison of volume of fluid and how the bubble enter-
ing the water, this mixed flow needs to be watched on
how momentum happening in every phases. Besides,
to get the flow following its compressibility, mixing
reactions, and mixture fraction as well as in the turbu-
lence flow, we need to record it so that those can be
explained using the formulations below;
Continuity equation of diffusion
δ
δt
(ρ
m
) + ∇(ρ
m
−→
ν
m
) = 0 (18)
where
−→
ν
m
is the mass velocity as follow;
−→
ν
m
=
∑
n
k=1
a
k
ρ
k
−→
ν
k
ρ
m
(19)
where ρ
m
is the diffusion of density described as fol-
low:
ρ
m
=
n
∑
k=1
a
k
ρ
k
(20)
where a
k
is volume fraction of the phase k.
Therefore the density distinction of the bubble for-
mation of foil will be answered. Consequently, the
density counted is not homogeneous in every situa-
tion. It also says that the density counted is not ho-
mogeneous in every situation.
Due to its curvature the upper surface foil will own
distinctive velocity. Then, its flow will pull the atmo-
spheric air in. This flow, both mixed and not, will
have heterogeneous density where the flowed mass
will be different. Furthermore, velocity will also be
different, especially on upper and below surface foil.
Therefore momentum will be created in the flow. The
following is the formulation used in the modelling of
SST k-ω this time.
The Effect of Angle of Attack and Chord Length of the Foil on Winged Air Induction Pipe Optimization toward Drag Reduction by using
Numerical Approach
121

δ
δt
ρ
m
−→
ν
m
+ ∇
ρ
m
−→
ν
m
−→
ν
m
= −∇p + ∇
µ
m
∇
−→
ν
m
+ ∇
−→
ν
T
m
+ ρmg +
−→
F + ∇
n
∑
k=1
a
k
ρ
k
−→
ν
dr,k
−→
ν
dr,k
!
(21)
where, n is number of phases,
−→
F is body force and
µ
m
is the viscosity of the diffusion. Since the mixed
viscosity is not homogeneous, therefore;
µ
m
=
n
∑
k=1
a
k
µ
k
(22)
−→
ν
dr,k
is drift velocity for secondary phase k, where;
−→
ν
dr,k
=
−→
ν
k
−
−→
ν
m
(23)
where ν
k
defined the dynamic viscosity of the k phase.
The relative velocity is defined as the velocity of a
secondary phase p relative to the velocity of the pri-
mary phase q.
−→
ν
pq
=
−→
ν
p
−
−→
ν
q
(24)
The mass fraction of any phase k given as :
C
k
=
a
k
ρ
k
ρ
m
(25)
Drift velocity and relative velocity
−→
ν
p
q con-
nected by:
−→
ν
dr,p
=
−→
ν
pq
−
n
∑
k=1
c
k
−→
ν
qk
(26)
From the previous continuity equation for sec-
ondary phase p, the volume fraction of the secondary
phase p can be obtained as :
δ
δt
(α
p
ρ
p
) + ∇(α
p
ρ
p
ν
m
) = −∇(α
p
ρ
p
ν
dr,p
)
+
n
∑
k=1
( ˙m
qp
− ˙m
pq
)
(27)
where ˙m
qp
and ˙m
pq
is the mass flow rates. Drift veloc-
ity is important to be inserted due to the flow which
contacts with the plate will have different velocity.
3 COMPUTATIONAL DOMAIN
The model used is a plate with a dimension of 5000
mm in length with a thickness of 200 mm with a mod-
ification of the manufacture of 80 mm wide holes and
the addition of hydrofoil at a coordinates of 2.216 mm
from the bow section (Kumagai et al., 2010). The
Figure 1: Model and WAIP Attachment View from z+
Figure 2: WAIP Design
Modeling is using the Autodesk Inventor 2018 soft-
ware. Details of the model created can be seen in the
picture.
The WAIP device that we used is the NACA
653 - 618 profile according to the power reduction
experiment using hydrofoil (Kumagai et al., 2015).
Boundary condition in this simulation has a dimen-
sion where the inlet part is placed 1-2 Lpp in front of
the hull direction, the outlet part is 3-5 Lpp from the
stern, and the exterior is 1 Lpp from the keel and up-
per exterior is 0.5 Lpp from keel (ITTC, 2011). More
grid numbers does not always produced better numer-
ical results (Gebreslassie et al., 2012). Therefore, a
Grid Independency Analysis (GIA) method is used
to find out the right meshing method. Determination
of the right mesh size using the Grid Independency
Analysis (GIA) method by comparing the results with
the experimental results (Kumagai et al., 2015) with a
similar model as a form of initial validation.
Figure 3: Boundary Condition
SENTA 2018 - The 3rd International Conference on Marine Technology
122

Figure 4: Meshing Model
Figure 5: Zoom In of Meshing Model
4 SETUP (GRID AND
DISCRETIZATION) AND
VALIDATION
4.1 Setup (Grid and Discretization)
At the first time, we have to choose which resolution
of grid we want to use. Because, good results depends
on good quality of meshing. To determine the quality
of the grid, we can use y+ equation ;
y
+
=
∆y
U
r
τ
w
ρ
(28)
where ∆y is the distance from the first node to the
wall. It is important to now about y
+
, where it
is determine the accuracy of the numerical simula-
tion alongside with grid density (Gebreslassie et al.,
2012). Smaller y
+
means more sensitive the grid it-
self. On the other hand, to achieve the efficiency of
simulating we have to find which grid sensitivity and
which quantity of meshing the result had already con-
verged. As we can see on the Table 1. Because the
results had already converged on fine till finest with
slightly different result, we use the grid quantity that
give the result before the converging happen.
4.2 Validation
To see how valid the results are, we compare it with
other journal experimental results. By using the same
properties of the ship and the foil, we compare our
numerical results with the experimental results done
by Kumagai et al. (2015). To achieve below 10% of
error, we used trial and error methods to see which
setup has the closest results as possible. By making
the same condition as the experimental results done
by Kumagai et al. (2015) we got that our setup re-
sults having errors below 10%, as described in table
1. From the Table 1. we can see that our average error
is 1,93% which is acceptable to continue our numeri-
cal setup (Duncan, 1981).
5 RESULTS AND DISCUSSIONS
The result that we got is the force acting on plate c
which is the viscous drag that acting along the plate.
The focus is on the drag reduction caused by the
WAIP that vary on the chord length and angle of at-
tack by compare it with the viscous drag acting along
the plate without WAIP installed. The relation be-
tween chord length, angle of attack and drag reduc-
tion can be depicted on Table 1 which θ, U, D
b
, ∆D
b
and D
R
is angle of attack of the foil, water inlet speed,
total drag on plate c, drag reduction and drag reduc-
tion percentage on plate c respectively.
On the angle of attack, the less drag reduction that
we got caused by the depression (w) which is bigger
as the tip of the foil tend to go deeper as the increase
of the angle. Besides the creation of the bubble by the
flow is getting harder, the mixing flow between air
and fluids mostly appeared on the after position of the
foil. Moreover, bigger angle of attack make the up-
coming flow from x+ axis hit the foil wall much big-
ger. Which make the flow harder to cross and hardly
pulling air into the flow.
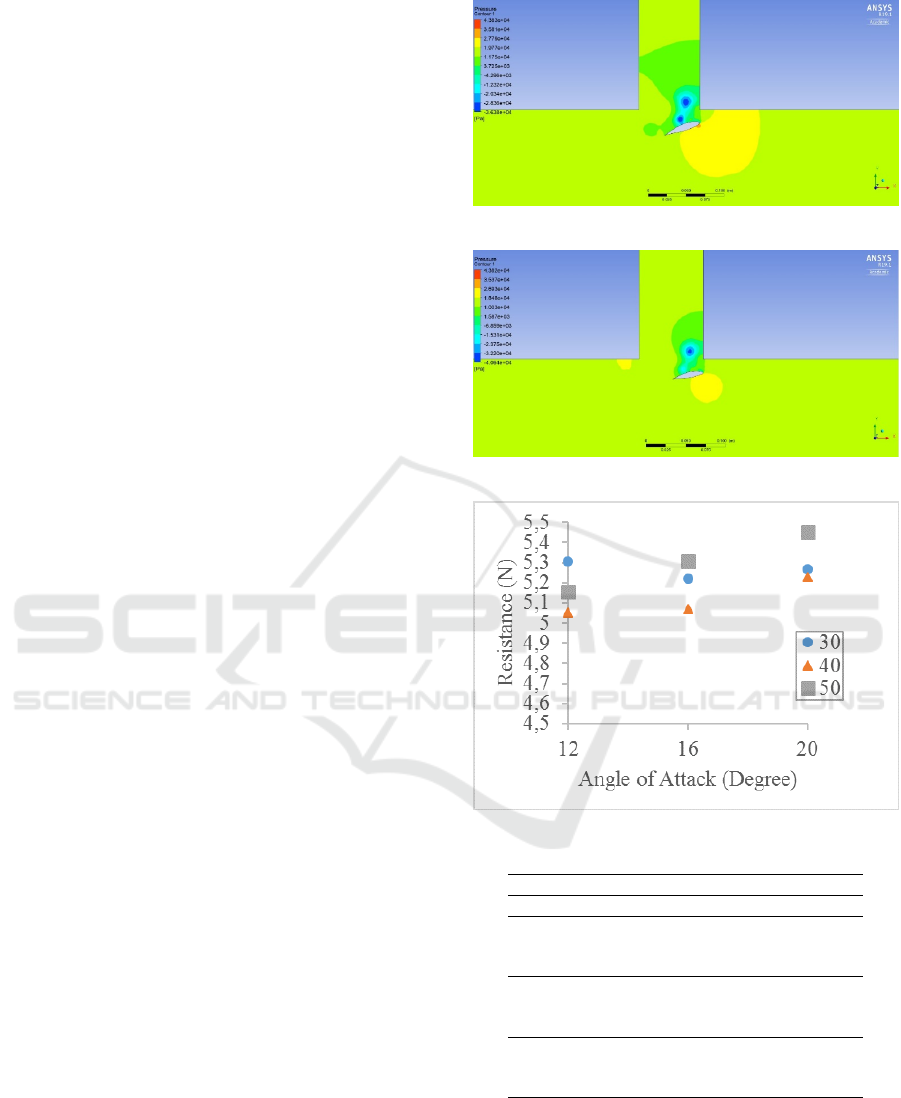
By using ANSYS post-processing, the creation of
bubble can be seen by looking on the pressure area.
On the image, the low pressure area mostly occur on
the upper surface of the foil and after the foil which
is located below the plat c and coated it. By using the
volume of fluid model on this setup, the differences
between pressure occur among regions caused by the
2 phases flow between air and fluid. Between those
figure we can see that the attachment of 20
◦
50mm
foil produce more low pressure than the attachment
of 12
◦
40mm.
Table 1: Error Percentage of Setup Results
Type θ Db (Exp) Db (Num) ∆Db %Error
Bare Bare 181.485 173.55 -7.935 -4.37
WAIP 12 167.751 168.241 0.49 0.29
WAIP 16 166.77 168.331 1.56 0.94
WAIP 20 164.808 168.281 3.47 2.11
Error 1.93
The Effect of Angle of Attack and Chord Length of the Foil on Winged Air Induction Pipe Optimization toward Drag Reduction by using
Numerical Approach
123
On 30 mm foil’s chord length the increase of the
angle of attack decrease the force experienced by the
plat. The biggest drag reduction output comes from
the biggest angle of attack used, by 3.13% DR. On
40 mm chord length it gives the same trend result,
so the biggest drag reduction output alos comes from
the biggest angle, with 3.103% DR. This trend also
happen on 50 mm foil’s chord length, with 3.24% DR.
This phenomena explain the bigger C
p
/C
d
value
the bigger net power saving value done by Kumagai
et al. (2015). Where on 6
th
formula, we can see that
the C
p
/C
d
value relatively bigger as the increase of
the chord length and the angle of attack. However,
we cannot conclude that bigger angle of attack and
longer chord length of the foil surely produce big-
ger drag reduction on plate E. We can see the lowest
drag reduction that is obtained is on the middle of the
chord length range. We can also see the fact that on
chord length 30mm, the correlation of bigger angle
can obtain bigger drag reduction is cannot be said as
a globally correct argument. But the same phenom-
ena does not apply to the changing chord length with
the same value of angle of attack. On the same degree
(angle of attack) variable except 12
◦
the biggest Drag
Reduction output still coming from the biggest chord
length. But the trend is different, where the second
biggest drag reduction output does not come from 40
mm foil’s chord length yet it comes from the smallest
foil’s chord length of 30 mm. On the other hand, the
resulted data on 12
◦
variable shows us that the biggest
drag reduction occurs on 30 mm, the second biggest
drag reduction comes from 50 mm, still the smallest
drag reduction is coming from 40 mm chord length.
The chord length of the foil that varied is affecting
the Reynold number on the foil which is affect the
coefficient pressure. Bigger coefficient pressure that
the foil can obtain produce bigger negative pressure
on the back of the foil that affecting the entertaining
of atmospheric air as can be seen on Figure 1. The
effect of Reynold number on coefficient pressure of
the foil cannot be 100% predicted especially on big
angle of attack. Therefore, the appropriate design can
be obtained by using trial and error method.
The changing of drag reduction that occurs on the
plate comes from the flow produced by the foil. The
characteristic of flow which was occurring on plate
will occur differently because of the properties of the
foil itself. This properties of the foil occur because
of the changing of the chord length. Then the chang-
ing of the chord length make the Reynold Number of
the flow occurred differently. Which is also makes the
different-kind of boundary layer. This unique charac-
teristic of the foil has already been explained in the
foil’s curve data (Naca Properties).
Figure 6: Pressure Area Condition 1
Figure 7: Pressure Area Condition 2
Figure 8: Drag Reduction
Table 2: Numerical Result of Influence of Hydrofoil
θ U (m/s) Db (N) ∆ Db DR (%)
bare 5.6 173.55 - -
12 5.6 168.2417 -5.3083 3.059
16 5.6 168.3313 -5.2187 3.102
20 5.6 168.2817 -5.2683 3.130
12 5.6 168.4979 -5.0521 3.002
16 5.6 168.479 -5.071 3.010
20 5.6 168.3218 -5.2282 3.103
12 5.6 168.3492 -5.1558 3.063
16 5.6 168.2437 -5.3063 3.151
20 5.6 168.0972 -5.4528 3.241
6 CONCLUSION
From this research we can see that bigger angle will
give lesser drag reduction on the plat c while the
longer the chord length give bigger drag reduction on
SENTA 2018 - The 3rd International Conference on Marine Technology
124

the plat c. On the other hand, smaller drag reduction
just make the air entrances the flow a bit harder and
longer chord length of the foil just make the resis-
tance appendages slightly bigger. In this research we
choose the angle of attack 20
◦
and chord length 50 mm
because they were giving the biggest amount of drag
reduction among others by 3.241% drag reduction. In
the future, we hope that the friction losses which is
occur on the foil will be in the future journal.
ACKNOWLEDGEMENTS
Authors are thanks to Department of Mechanical En-
gineering, Faculty of Engineering, Universitas In-
donesia for making facility available and also grant
PITTA No. 2561/UN2.R3.1/HKP05.00/2018.
REFERENCES
Cui, Z., Fan, J. M., and Park, A.-H. (2003). Drag coeffi-
cients for a settling sphere with microbubble drag reduc-
tion effects. Powder technology., 138(2):132.
Duncan, J. H. (1981). An Experimental Investigation of
Breaking Waves Produced by a Towed Hydrofoil. Pro-
ceedings of the Royal Society of London. Series A, Math-
ematical and Physical Sciences, 377(1770):331–348.
Gebreslassie, M., Tabor, G., and Belmont, M. (2012). Cfd
simulations for sensitivity analysis of different parame-
ters to the wake characteristics of tidal turbine. Open J.
Fluid Dyn., 2.
Kodama, Y., Kakugawa, A., Takahashi, T., and Kawashima,
H. (2000). Experimental study on microbubbles and their
applicability to ships for skin friction reduction. Inter-
national Journal of Heat and Fluid Flow International
Journal of Heat and Fluid Flow, 21(5):582–588.
Kumagai, I., Kushida, T., Oyabu, K., Tasaka, Y., and Murai,
Y. (2011). FLOW BEHAVIOR AROUND A HYDRO-
FOIL CLOSE TO A FREE SURFACE. Vis Mech Proc
Visualization of Mechanical Processes, 1(4).
Kumagai, I., Nakamura, N., Murai, Y., Tasaka, Y., and
Takeda, Y. (2010). A new power-saving device for air
bubble generation: hydrofoil air pump for ship drag re-
duction. In Proceedings of the International Conference
on Ship Drag.
Kumagai, I., Takahashi, Y., and Murai, Y. (2015). Power-
saving device for air bubble generation using a hydrofoil
to reduce ship drag: Theory, experiments, and applica-
tion to ships. Ocean Engineering, 95:183 – 194.
Mohanarangam, K., Cheung, S. C. P., Tu, J. Y., and Chen,
L. (2009). Numerical simulation of micro-bubble drag
reduction using population balance model. Ocean Engi-
neering, 36(11):863 – 872.
Muste, M., Yu, K., Fujita, I., and Ettema, R. (2009). Two-
phase flow insights into open-channel flows with sus-
pended particles of different densities. Environmental
Fluid Mechanics, 9:161–186.
Ockfen, A. E. and Matveev, K. I. (2009). Aerodynamic
characteristics of NACA 4412 airfoil section with flap in
extreme ground effect. International Journal of Naval
Architecture and Ocean Engineering, 1(1):1 – 12.
Olazabal-Loum
´
e, M., Danvin, F., Julien, M., and Aupoix,
B. (2017). Study on k-w shear stress transport model
corrections applied to rough wall turbulent hypersonic
boundary layers.
Pang, M. J., Wei, J. J., and Yu, B. (2014). Numerical study
on modulation of microbubbles on turbulence frictional
drag in a horizontal channel. Ocean Engineering, 81:58
– 68.
Series A (1779). Mathematical and Physical Science. Num-
ber 377.
Shereena, S. G., Vengadesan, S. N., Idichandy, V. G., and
Bhattacharyya, S. K. (2013). Cfd study of drag reduction
in axisymmetric underwater vehicles using air jets.
Uhlman, J. S. (1987). The Surface Singularity Method Ap-
plied to Partially Cavitating Hydrofoils. Journal of Ship
Research, 31(02):107–124.
Yanuar, Gunawan, Sunaryo, and Jamaluddin, A. (2012).
Micro-bubble drag reduction on a high speed vessel
model. Journal of Marine Science and Application,
11(3):301–304.
Zhang, J., Yang, S., and Liu, J. (2018). Numerical investi-
gation of a novel device for bubble generation to reduce
ship drag. International Journal of Naval Architecture
and Ocean Engineering, 10(5):629 – 643.
The Effect of Angle of Attack and Chord Length of the Foil on Winged Air Induction Pipe Optimization toward Drag Reduction by using
Numerical Approach
125
