
The Effect of Evaluating Student Learning Outcomes on National
Exam Scores with Final School Exams as an
Intervening Variable
Alia Lestari, Riswan
Institut Agama Islam Negeri Palopo, Sulawesi Selatan,Indonesia
Keywords: Daily Test, Evaluation, Final School Exam, National Examination, Midterm Test, Path Analysis, Task.
Abstract: The purpose of this study was to examine the relationship between evaluating student learning outcomes
conducted by teachers in State High Schools in Palopo City and National Examinations held by the
government nationally. The study also aims to determine whether the final school exam mediates the
relationship between the evaluation of learning outcomes and national examinations. The data used in this
study were obtained from the documentation of the State High School in Kota Palopo in the 2016/2017
academic year consisting of 6 (six) schools with a total of 1,631 students. Sampling is done by using the
Probability Sampling Stratified Random Sampling technique. The sample used was 321 students. Data is
processed using Path analysis techniques. The results of this study indicate that the evaluation of student
learning outcomes consisting of tasks, daily tests, midterm tests and final school exams affect the score of
national exams directly and simultaneously, but not all evaluation outcomes of learning outcomes partially
affect the score of national examinations. while the relationship between evaluating student learning
outcomes is not all mediated by the Final School Exam.
1 INTRODUCTION
Palopo City, one of the cities in the province of
South Sulawesi, continues to strive to improve the
quality of education. Morris Kline in
LisnawatiSimanjuntak stated that "the ups and
downs of countries today depend on progress in the
field of mathematics" (LisnawatiSimanjuntak,
1993). But this year, the average score of the
national examination (UN) level of South Sulawesi's
academic year 2017 decreased from the previous
year. This was acknowledged by the South Sulawesi
Education Office, IrmanYasinLimpo, Thursday
(Rakyatku, 2017).In 2014, the national examination
average for high school in Palopo City was ranked
the 4th highest in South Sulawesi Province, while
this year, Palopo city was not included in the top 5
list. The decline in the average national exam scores
of high school students is certainly something that
needs to be studied more deeply, given that national
exams are one indicator of the success of the
teaching and learning process.
In the teaching and learning process, especially
in the evaluation of learning outcomes, both those
carried out by the teacher in the form of daily
assignments and tasks, carried out by schools such
as Midterm Test (UTS) and Final School Exam
(UAS) and those conducted by the government in
the form of National Examinations through several
stages. The stages of evaluation with one another
correlate and form a causal relationship that has a
pattern of direct or indirect relationships.
Based on the observations, the scores of the
national exam is determined by several variables
such as: Tasks, Daily Tests, and Final School Exam.
These variables form the structure of relationships
between variables. The relationship between these
variables is a correlation and regression relationship
in the form of direct or indirect relationships.
Evaluation of learning outcomes is carried out
continuously to monitor the process, progress and
improvement of results in the form of Tasks, Daily
Tests, Midterm Tests, Final School Exams, and
National Exams. Assignments are given to students
at the end of the learning meeting. Daily tests can be
done if you have completed one or several indicators
or one basic competency, while the final school
exam is done after completing some basic semester
competencies in question. National exams are
carried out nationally at the level of elementary and
secondary education at the end of the school year to
Lestari, A. and Riswan, .
The Effect of Evaluating Student Learning Outcomes on National Exam Scores with Final School Exams as an Intervening Variable.
DOI: 10.5220/0008524004790486
In Proceedings of the International Conference on Mathematics and Islam (ICMIs 2018), pages 479-486
ISBN: 978-989-758-407-7
Copyright
c
2020 by SCITEPRESS – Science and Technology Publications, Lda. All rights reserved
479
find out the extent of students' ability to handle all
the material that has been learned.
The research conducted by IkhsanJailani stated
that there was no significant positive relationship
between semester national exams and national
examinations (Jailani, 2015), while according to
FitriYunita in her research results stated that there
was a significant correlation between final school
exam scores and national examinations(Yunita,
2014). The results of the research by Siti Harlian
have a very strong positive correlation between the
formative test scores and the semester exam scores
(harlian, 2013).Formative tests in school experience
are equated with daily tests because formative tests
are carried out at the end of each. material.
According to FadliHidayat, PujiNugraheni, and
Budiyono in the results of their research stated there
was a positive and significant relationship between
UTS with UAS(Hidayat, Nugraheni, & Budiyono,
2013). Based on several studies above, it can be
concluded that daily tests affect the midterm exam.
The final school exam also influences the national
exam. Whereas the midterm exam does not
influence national exams. But the midterm exam
influences the final school exam.
This study will examine the contribution of
evaluation of learning outcomes conducted in
Palopo City Senior High Schools in the form of
assignments, daily tests, midterm tests on the
national exam scores directly, and through Final
School Exams as intervening variable.
2 RESEARCH METHODS
This type of research is ex post facto research with
descriptive quantitative approach. Student value data
was taken from 6 schools in Palopo District, 312
students from 1,631 students. Sampling was done by
Probability Sampling technique in the Proportionate
Stratified Random Sampling type in 6 schools,
namely SMA 1 Palopo, SMA Negeri 2 Palopo, SMA
Negeri 3 Palopo, SMA Negeri 4 Palopo, SMA
Negeri 5 Palopo, and SMA Negeri 6 Palopo. The
data obtained will be analyzed using Path Analysis.
In the structural equation model, this study has
exogenous variables, endogenous variables, and
intervening variables. Exogenous variables are
variables that are not influenced by previous
variables (antecedents), while endogenous variables
are variables that are influenced by previous
variables. Exogenous variables in this study are
evaluation of student learning outcomes and their
endogenous variables are national examinations.
There is one variable that has an antecedent variable
(previous variable) and consequent variable
(variable afterward) in the equation model, namely
the final school exam which is then referred to as the
intervening variable. The steps to test path analysis
(Path Analysis) 1. Determine the paradigm of
relationships between variables; 2. make a path
diagram model; 3. determine the path coefficient and
the structure equation (Subana, Rahadi, & Sudrajat,
2000).
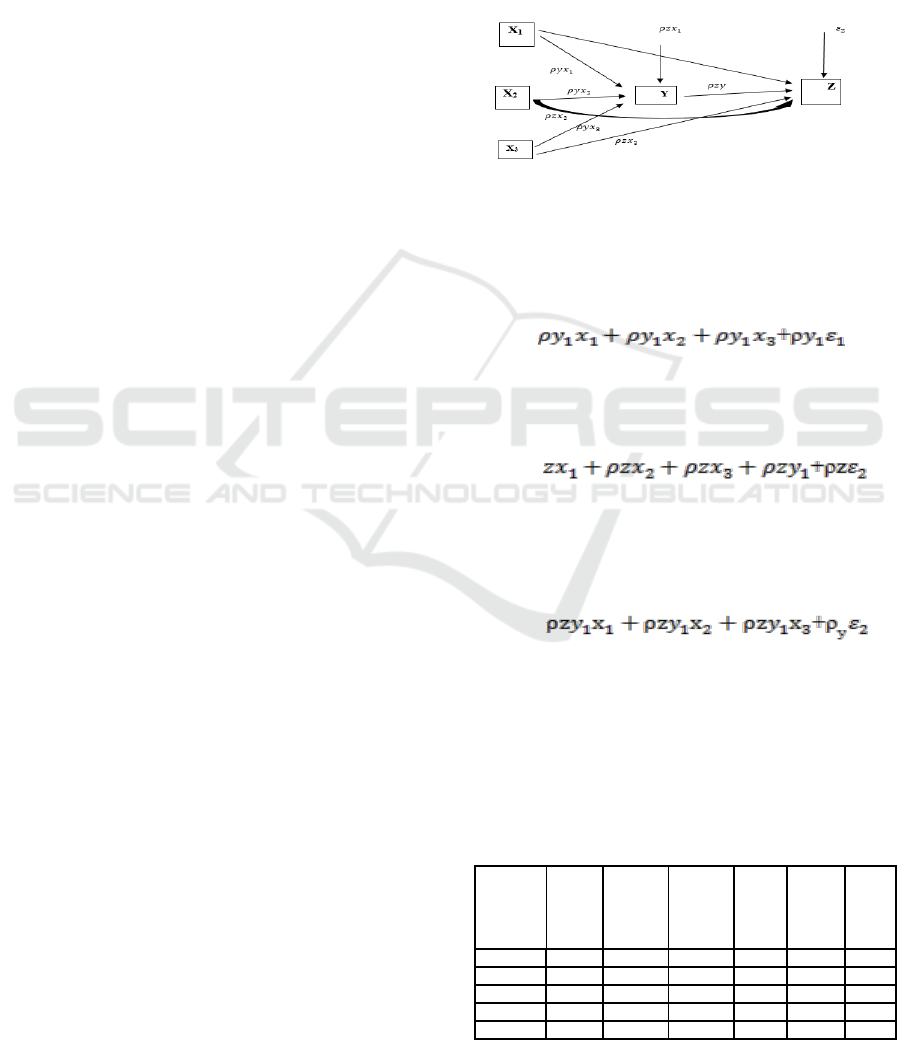
Figure 1: Structural Relationships Variable X
1
, X
2
, X
3
and
Y to Z
▪ Hypothesis Model 1:
Tasks, daily tests and midterm replications
directly influence the school final exam
Sub-Structure 1:
Y =
▪ Hypothesis Model 2:
Task, daily test, midtermtestand final school
exam have a direct effect on national examination
Sub-Structure 2:
Y =
▪ Hypothesis Model 3:
Task, daily tests and midterm replications have a
total effect on national exams through final school
exams.
Sub-Structure 3:
Y =
3 RESULTS AND DISCUSSION
3.1 Descriptive Statistics
The results of the descriptive statistics with SPSS 22
program are obtained as follows;
Table 1: Descriptive Statistics
UN
US
UTS
UH
Tgs
Vali
d N
(list
wise
)
N
321
321
321
321
321
321
Range
82.50
74.00
35.00
38.00
31.00
Min.
12.50
24.00
65.00
60.00
67.00
Max
95.00
98.00
100.00
98.00
98.00
Mean
455.2
841.5
829.01
834.2
851.4
ICMIs 2018 - International Conference on Mathematics and Islam
480
Std.
Deviatio
n
1509.
4
653.6
542.31
604.6
507.5
Variance
22.78
3
42.72
2.941
3.656
25.7
Skewnes
s
.341
-2.402
.436
-.588
-.369
Kurtosis
-.159
22.627
.790
1.378
1.230
3.2 Analysis Requirements
Testing with ANOVA statistics requires that the
analyzed data come from the population with normal
distribution and the variance between sample groups
must be homogeneous. For this reason, normality
and homogeneity tests were carried out. Normality
test uses the Lilliefors test, while homogeneity uses
the Bartlett test.
3.2.1 Normality Test
The results of the normality test with SPSS 22
program are obtained as follows;
Table 2: Data Normality Test
Tgs
UH
UTS
UAS
UN
N
321
321
321
321
321
Normal
Parameter
s, b
Mean
85.14
83.43
82.9
84.34
44.73
Std.
Deviation
5.076
6.046
5.43
6.493
14.81
Most
Extreme
Differenc
es
Absolute
.087
.108
.097
.118
.077
Positive
.063
.052
.097
.092
.077
Negative
-.087
-.108
-.087
-.118
-.048
Test
.087
.087
.108
.097
.118
Asymp. Sig. (2-tailed)
.000c
.000c
.000c
.000c
.000c
Ho: Data normally distributed
Ha: Data not normally distributed
Basic decision making is based on probability. If
the probability value> 0.05 then Ho is accepted
If the probability value is 0.05 then Ho
rejected
Kolmogorov-Smirnov results above, the task is
0.087 which means> 0.05 then the data is normally
distributed. Daily Test Rate is 0.108 which means>
0.05, the data is normally distributed. Midterm test
(UTS) is 0.097 which means > 0.05, the data is
normally distributed. The Final School Exam Value
is 0.118 which means> 0.05, the data is normally
distributed. National Examination Value is 0.77
which means> 0.05, the data is normally distributed.
So that the sample data coming from the population
are normally distributed.
3.2.2 Linearity Test
Test aims to determine whether two variables have a
significant linear relationship or not. Linearity test
results obtained in the following tables;
Table 3: Summary of results of Linearity Test
Effect of Variables
Sig. Value
Ket.
Tgs (X1) to UAS (Y)
0,945Test
Linear
UH(X2) to UAS (Y)
0,001
Not
linear
UTS (X3) to UAS (Y)
0,595
Linear
UAS (Y) to UN (Z)
0.063
Linear
Tgs (X1) against UN (Z)
0.001
Not
linear
UH (X2) against UN (Z)
0.001
Not
linear
UTS (X3) against UN
(Z)
0.079
Linear
It can be concluded that Tasks and UTS have a
linear relationship with UAS. In addition, UTS also
has a linear relationship with the UN. While Daily
test does not have a linear relationship with the
(UAS) and National Examination. Likewise, Daily
Tests with the UN do not have a linear relationship.
so that it is tested to find the right model.
3.2.3 Model Test
Testing aims to determine the right model used to
analyze research data. The test results of the table
model above show that the right model is a quadratic
model with the highest R-square value with a
contribution of 26.0%.
Based on the test results of the models of the
three relations of the three variables in Table 4 it can
be concluded that the right model used is a quadratic
model non-linear regression.
3.2.4 Quadratic
Test A quadratic test is a non-linear regression
which aims to determine the relationship between
the dependent variable (Y) and the independent
variable (X) so that a curve that forms an ascending
curved line (β2> 0) or decreases (β2 <0) will be
obtained (Yusnandar, 2004). So that nonlinear data
will be tested for non-linear quadratic models as in
Table 5.
The Effect of Evaluating Student Learning Outcomes on National Exam Scores with Final School Exams as an Intervening Variable
481
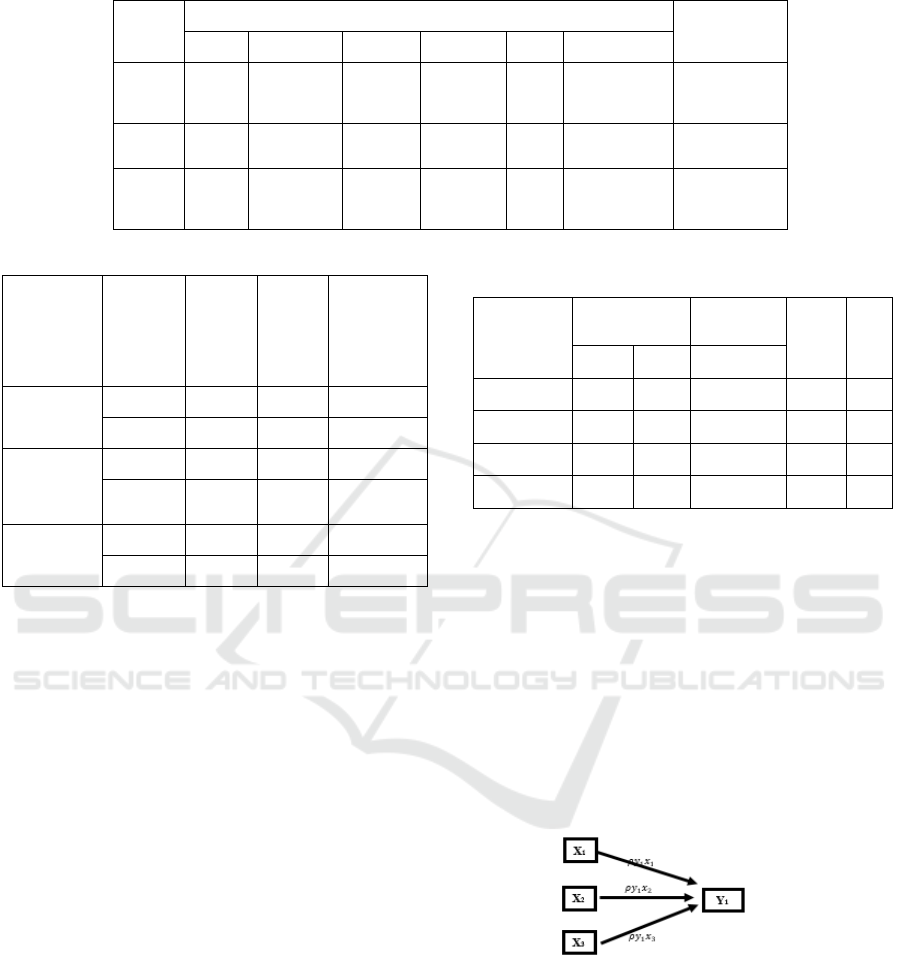
Table 4: Summary of Model Test Results
Variable
R Square
tests used were
Linear
Logarithmic
Inverse
Quadratic
Cubic
Compound
UH-
UAS
0.061
6.1%
0.061
6.1%
0.059
5.9%
0.062
6.2%
0.061
6.1%
0.028
2.8%
Quadratic
6.2%
Tgs-
UN
0.215
21.5%
0.208
20.8 %
0.198
19.8%
0.232
23.2%
0.230
3.0%
0.229
22.9%
Quadratic
23.2%
UH- UN
0.237
23.7%
0.225
22.5%
0.210
21.0%
0.260
26.0%
0.258
5.8%
0.256
25.6%
Quadratic
26.0%
Table 5: Summary of Quadratic Test Results
Influence
of
variables
Value
Value
of
path
coeffic
ients
Sig.
Value
Remark
UH (X2)
to UN (Z)
Height
0.227
0.001
Influence
Low
0.180
0.064
No effect
Tgs (x1)
on UN (Z)
Height
0.465
0.000
Influence
Low
0.085
0.384
No effect
on
UH (X2)
on UN (Z)
Height
0.421
0.000
Influence
Low
0.146
0.134
No effect
3.2.5 Multicollinearity Test
Multicollinearity
Aims to test whether the regression model found
correlation between independent variables. A good
regression model should not have a correlation
between the independent variables (not
multicollinearity). Based on the results of the data
processing by the SPSS Version.22 Program it is
known that the tolerance value of the Tgs(X1), UH
(X2), UTS (X3) successive variables is 0.369; 0.382
and 0.666 greater than 0.10. Meanwhile, the VIF
values of Tgs (X1), UH (X2), UTS (X3) variables
were 2.710, 2.616 and 1.501 respectively, which
means less than 10.00. So, it can be concluded that
there is no Multicollinearity.
Based on Table 6 output is known that the value
of the variable tolerance Instructions (X1), UH (X2),
UTS (X3) and UAS (Y) in a row of 0.359; 0,382;
0.653 and 0.886 greater than 0.10. Meanwhile, the
VIF values of the Tgs (X1), UH (X2), UTS (X3) and
UAS (Y) variables were 2.783; 2,617; 1,526 and
1,129 which means less than 10.00. So, it can be
concluded that there is no multicollinearity.
Table 6: Multicollinearity Test Results of Task
Value Data, UH, UTS, and UAS against UN
Model
Unstandardized
Coefficients
Standardized
Coefficients
t
Sig.
B
Std.
Error
Beta
Tgs Value
.459
.234
.157
1.961
.051
UH Value
.704
.190
.288
3.697
.000
UTS
.330
.162
.121
2.033
.043
US value
.116
.116
.051
.996
.320
3.3 Research Hypothesis Test through
Path Analysis
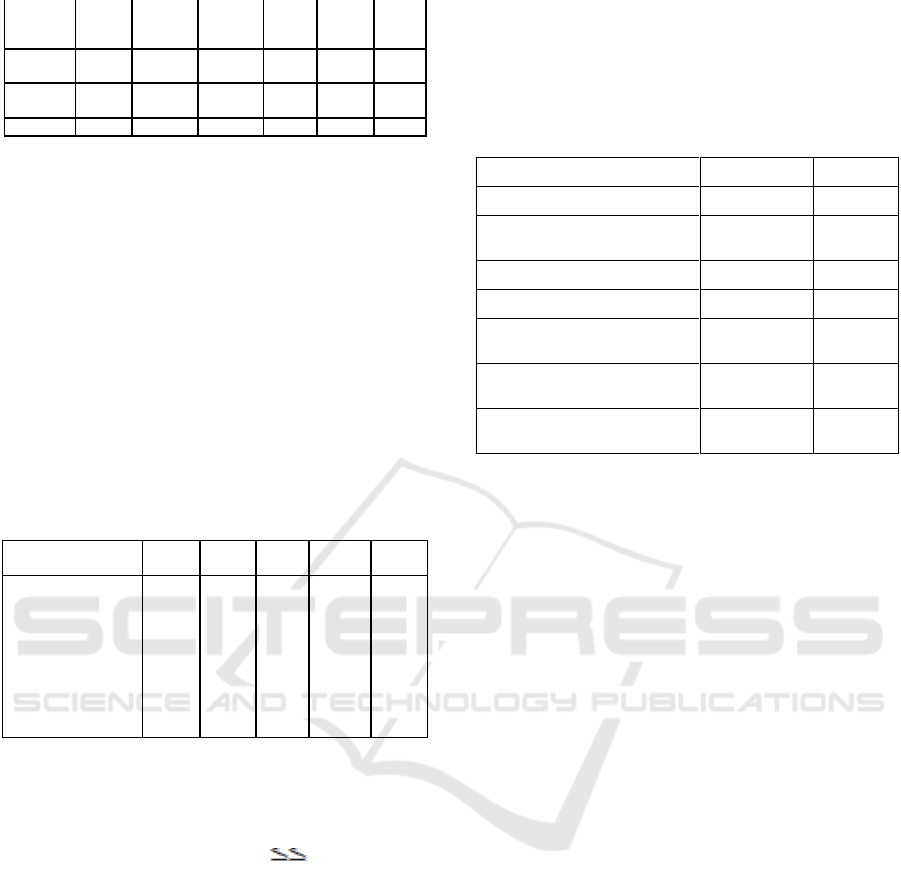
3.3.1 Section Titles
To determine the path coefficients in this one sub-
structure, the researcher previously showed Figure 6
which is a picture of Sub-Structure one, taken from
Figure 5. Sub Structure one is the direct relationship
between Task and Daily Test with Midterm Test
(UTS).
Figure 2: Sub Structure One direct relationship Tgs, UH,
and UTS with UAS
● Test Overall
Hypothesis Testing Hypothesis
Testing Data test as a whole as follows:
ICMIs 2018 - International Conference on Mathematics and Islam
482
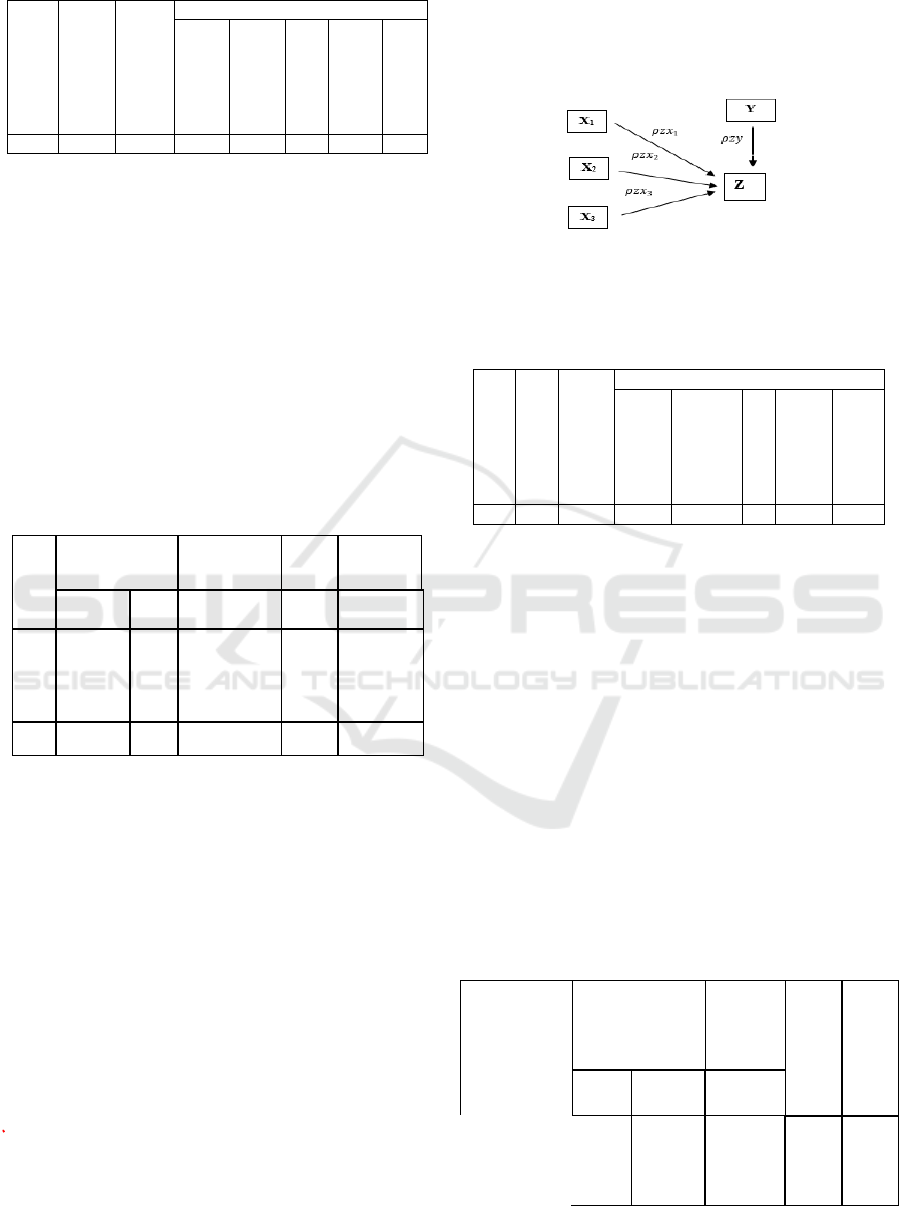
Table 7: Summary Model
R Square
Adjusted R
Square
Std. Error of the
Estimate
Change Statistics
R Square
Change
Change
df1
df2
Sig. F
Change
0.114
0.106
6.141
0.114
13.59
3
317
.000
Ho: Tgs, UH, UTS no direct influence UAS.
Ha: Tgs, UH, UTS directly influence UAS.
The Table 7 above shows the calculated F value
of 13.590 with a probability value (sig) = 0.000.
Because the sig value is 0.000 <0.05, then Ho is
rejected, Task, Daily Test, UTS influences UAS.
Therefore, individual testing can be carried out or
continued.
● Hypothesis Testing Individually
The results of individual hypothesis testing are
shown in the table as follows:
Table 8: Tgs, UH, and UTS Regression Coefficients
on UAS
Model
1
Unstandardized
Coefficients
Standardized
Coefficients
t
Sig.
B
Std.
Error
Beta
44,396
6,275
7,076
.000
(Constant)
Tgs
.111 .254
.324
2.913
.004
UH
-.032
.092
-.030
-.345
.730
UTS
.078 .151
.180
2.328
.021
Ho:Tgs do not have a direct effect on the UAS
Ha:Tgs have a direct effect on UAS;
The table above obtained a beta value of 0.254
and a sig value of 0.004 <0.05, so Ho was rejected,
meaning that the task had a direct effect on the UAS
Ho: UH had no direct effect on the UAS.
Ha: UH has a direct effect on UAS.
From Table 8, the beta value is -0.030 and the
sig value is 0.730 <0.05, so Ho is accepted. This
means that Deuteronomy does not have a direct
effect on UAS
Ho: UTS does not have a direct effect on UAS
Ha: UTS has a direct effect on UAS.
From Table 8 above, the beta value is 0.151 and
the sig value is 0.021 <0.05, Ho is rejected. This
means that UTS has a direct effect on UAS.
So, it can be concluded that the task has a direct
effect on the UAS value. While Daily test does not
directly affect the value of UAS and UTS directly
affects UAS.
a. Hypothesis Testing Sub Two Structure
To determine the path coefficients in these two
previous sub-structures the researcher shows Figure
3 which is part of Figure 1 Sub Structure two is a
direct relationship between Tgs, UH, UTS and UAS.
Figure 3: Sub Structure of two direct relationships
Task, Daily Test, UTS, and UAS with UN
Test Overall Hypothesis Testing The results of
the overall data test are as follows:
Table 9:Summary Model
R Square
Adjusted R
Square
Std. Error of the
Estimate
Change Statistics
R Square
Change
Change
df1
df2
Sig. F
Change
.269
.260
12.737
.269
29.04
4
316
.000
Ho:Tgs, UH, UTS and UAS do not directly affect
the UN
Ha:Tgs, UH, UTS and UAS directly influence the
UN
From the Table 9, the calculated F value is
29.039 with a probability value (sig) = 0.000.
Because the sig value is 0.000 <0.05, Ho is rejected.
This means that Task, Daily Tests, UTS, and UAS
affect the National Examination. Therefore,
individual testing can be carried out or continued.
• Hypothesis Testing Individually Tests
Based on the results of the linearity test shows
that Daily Task and do not have a linear relationship
so there is no individual hypothesis testing, while the
UTS and UAS have linear relationships then the
individual hypotheses will be tested as shown in the
table as follows:
Table 10: UTS regression coefficient of the UN
Model
unstandardize
d Coefficients
Standar
dized
Coeffic
ients
t
Sig.
B
Std.
Error
Beta
1
(Constant)
-40
163
11 768
-3
413
.001
UTS Value
1.02
4
.142
.375
722
9
.000
The Effect of Evaluating Student Learning Outcomes on National Exam Scores with Final School Exams as an Intervening Variable
483
Ho: UTS has no direct influence on the UN
Ha: UTS direct impact on the UN
From Table 10, the beta value is 0.375 and the
sig value is 0.000 <0.05 so Ho is rejected. This
means that UTS directly affects the National
Examination.
From Table 11, the beta value is 0.205 and the
sig value is 0.000 <0.05, so Ho is rejected. This
means that UAS directly affects the National
Examination. So that it can be concluded that Task,
Daily Test, UTS and UAS directly influence the
National Examination.
Table 11: The regression coefficients of UAS to UN
Model
Unstandardiz
ed
Coefficients
Standardized
Coefficients
t
Sig.
B
Std.
Erro
r
Beta
1
(Constant)
5.335
0.56
6
.505
.614
UAS
value
.467
.125
.205
3.73
9
.
000
Ho: UAS does not directly affect the National
Examination.
Ha: UAS directly affects the National
Examination.
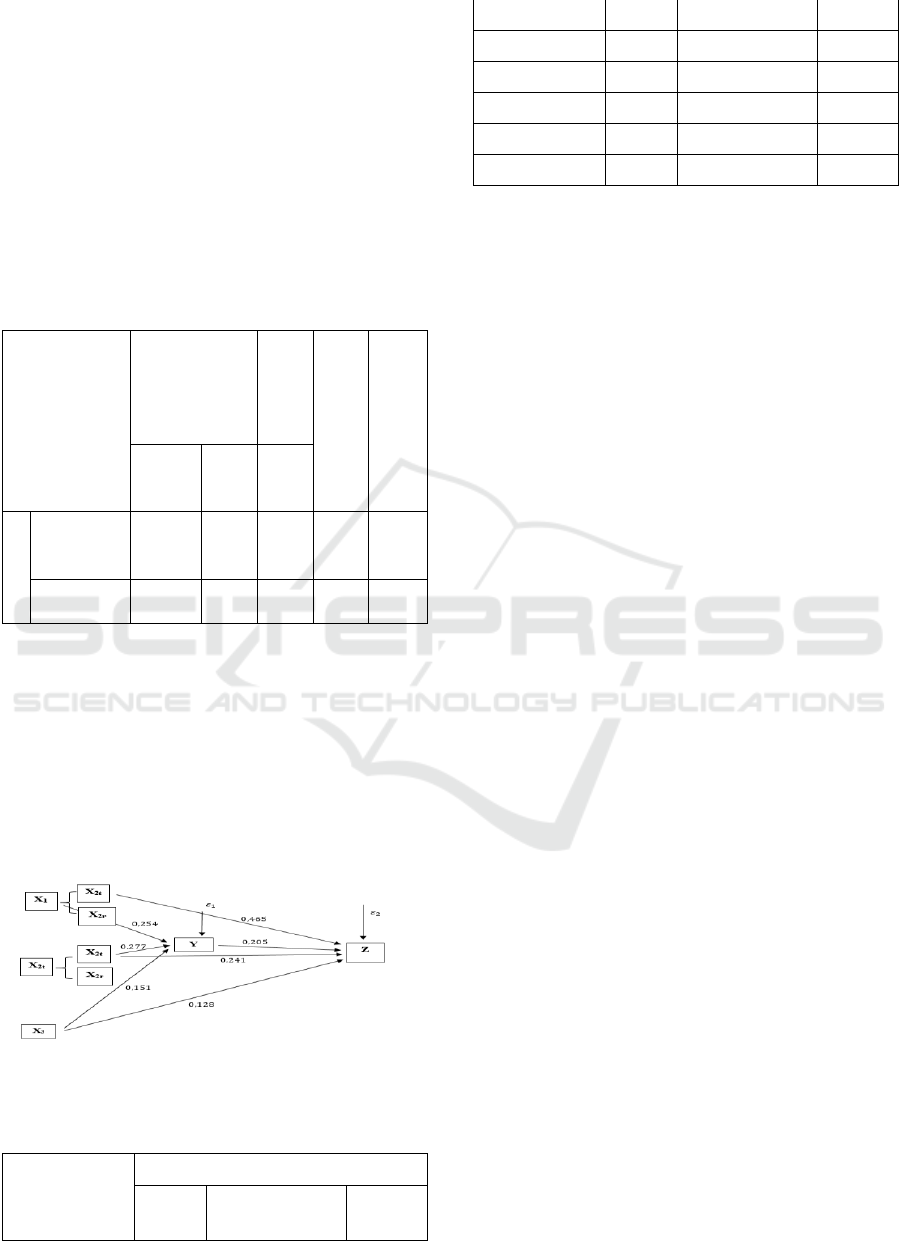
3.3.2 Direct and indirect
Influences As for the direct and indirect influences
of Tasks, Daily Tests, UTS, and UAS on the
National Examination are as follows:
Figure 4: New diagram changes from the path
diagram hypothesized
Table 12: Summary of the path coefficients Effect of
Direct, indirect and total
Influence
variables
Influence of Causal
Direct
Indirect (via
y)
Total
X1 THP Y
0.254
0.254
X1t THP z
0.465
0.052
0.517
X2t THP Y
0.227
0.227
X2t THP z
0.421
0.046
0.467
X3 THP Y
0.151
0.151
X3 THP Z
0.375
0.030
0.715
The results of the above table, it can be seen that
the direct effect of UTS on UAS by 0.375 and
indirect influences of 0.030, which means that the
direct effect is greater than the indirect effect, the
results show that it directly has a significant
influence on the National Examination.
3.4 Discussion of Research Results
3.4.1 The Influence of Tasks, Daily Tests,
Middle test on School Final Exams
The Results of this study are not in accordance with
the expectations of researchers who consider the
value of Tasks, Daily Tests, Midterm test
Examination to influence the National Examination.
Previously, researchers had tested the normality of
the sample data and obtained normal distribution
data. Some of the three evaluations have no effect on
the Final School Exam or on the National
Examination, after being tested on the linearity test.
The results in the field indicate that Daily test has no
direct effect on the Final School Exam.
Task and Midterm test have a linear relationship
to the Final School Exam. Next hypothesis testing.
Hypothesis testing shows a beta value of 0.254 with
a significant value of 0.000 <0.05 for the task
towards the final School Exam so that the Ho
hypothesis is accepted. This means that the task
directly influences the Final School Exam. Whereas
the Midterm test towards the Final School Exam
obtained a beta value of 0.151 with a significant
value of 0.021 <0.05 so that Ho accepted. This
means that Midterm test directly affects the Final
School Exam.
The results of this study, in line with previous
research, especially on the evaluation of Midterm
test on the Final School Exam by FadliHidayat,
Budiyono, PujiNugraheni stated that there was a
positive and significant relationship between the
Midterm test and the Final Examination for School
Mathematics subjects(Jailani, 2015). Likewise, the
results of research by the researchers stated that
there was a linear relationship between Midterm test
and the Final School Exam. However, what is
ICMIs 2018 - International Conference on Mathematics and Islam
484

different from the research of researchers is that it
does not only show the relationship between
Midterm test and the Final Examination of the
School, but shows the relationship between Tasks,
Daily Tests, and Midterm test towards the Final
School Exam. So, this study is a research that shows
whether there is an influence of Tasks, Daily Tests
and Midterm test on the Final School Exam.
Previous research was only on the relationship
between Midterm test and the Final School Exam.
3.4.2 The Influence of Task, Daily Tests,
Middle test on National Exams
The results of this study indicate that Daily Test and
Deuteronomy does not affect the National
Examination. These results are based on a linearity
test that Deuteronomy Daily Tasks and not a linear
relationship, so it is not continuous right on
hypothesis testing. However, after testing the model,
the exact model used was a quadratic model, so that
after the quadratic test it was obtained that a high
Daily Task and Deuteronomy had an effect on the
National Examination.
This study is different from the previous research
conducted by IkhsanJalali on mathematics subjects
in Muhammadiyah I SMP Banda Aceh in
2013/2014, that there was no significant positive
relationship between midterm exams and national
exams(Jailani, 2015). Whereas the results of the
research conducted by the researchers, that UTS has
a direct influence on the national exam in the high
school of Palopo city. So that in the city of Palopo
especially the high school level needs to be
implemented against UTS because it influences the
National Examination.
3.4.3 The Influence of Tasks, Daily Tests,
Middle test, and School Exams on
National Exams through School Final
Exams as intervening variables
The results of the study show that school exams
affect national exams. This is based on linearity test
that there is a linear relationship of UAS variables to
the UN variable. In addition to the hypothesis test
obtained a beta value of 0.375 with a significant
value of 0.000 <0.05 so that the Ho hypothesis is
accepted, meaning that the Final Examination of the
School directly affects the National Examination.
This results in the indirect influence of Tasks, Daily
Tests, Mid-Semester Exams, and school
Examinations on National Exams through the Final
School Exam as intervening variables.
The results are consistent with research
conducted by Fitri Yunita against-IA class XII
student of SMAN 8 Banda Aceh, that there is corella
significant action between the school final exam
scores of National Exam (yunita, 2014). Based on
the results in table 4.13. the summary model shows
that the R square task, daily tests, midterm test, and
final school exam influence simultaneously that
directly affects the National Examination at 0.285.
This means that the contribution of Tasks, Daily
Tests, Middle test, and final School Exam have a
simultaneous effect which directly affects the
National Examination is 26.9%, while the rest is
influenced by other factors that cannot be explained
in this study.
4 CONCLUSIONS
Based on the results and discussion with path
analysis, we can conclude that the evaluation of
student learning outcomes consisting of tasks, daily
tests, midterm tests and final school exams affect the
score of national exams directly and simultaneously,
but not all evaluation outcomes of learning partially
affect the score of national examinations. while the
relationship between evaluating student learning
outcomes is not all mediated by the final school
exam. The contribution of evaluating student
learning outcomes which is only 26.9% indicates
that the evaluation of learning outcomes conducted
by teachers and schools has not fully supported
students to obtain the expected national exam scores.
REFERENCES
Harlian, Siti. (2013). Korelasi Nilai Ujian Formatif
Dengan Nilai Ujian Semester Dalam Mata Pelajaran
IPA SDN 62 Banda Aceh. University Syiah Kuala |
Electronic Theses and Dissertations.
Hidayat, F., Nugraheni, P., & Budiyono. (2013).
Hubungan Uts Dengan Uas Mata Pelajaran
Matematika Siswa Sekolah Menengah Pertama Di
Kecamatan Gombong. Program Studi Pendidikan
Matematika, 6, 164–169.
Jailani, I. (2015). Hubungan nilai ujian semester dengan
nilai ujian nasional pada mata pelajaran matematika di
SMP Muhammadiyah I Banda Aceh tahun pelajaran
2013/2014. Program Studi Pendidikan Matematika.
L. Simanjuntak and Dkk, Metode Mengajar Matematika.
Jakarta: PT Rineka Cipta, 1993.
Rakyatku. (2017). Nilai Rata-rata Hasil UN Sulsel Turun.
Subana, Rahadi, M., & Sudrajat. (2000). Statistik
Pendidikan (Cet. I). Bandung: Pustaka Setia.
yunita, fitri. (2014). Korelasi Nilai Ujian Akhir Sekolah
Dengan Nilai Ujian Nasional Pada Mata Pelajaran
Fisika Siswa Kelas Xii-Ia Sma Negeri 8 Banda Aceh.
SkripsiFakultas.
The Effect of Evaluating Student Learning Outcomes on National Exam Scores with Final School Exams as an Intervening Variable
485

Yunita, F. (2014). Korelasi Nilai Ujian Akhir Sekolah
Dengan Nilai Ujian Nasional Pada Mata Pelajaran
Fisika Siswa Kelas XII-IA Sma Negeri 8 Banda Aceh.
Skripsi Fakultas.
Yusnandar, M. E. (2004). Aplikasi Analisis Regresi Non-
Linear Model Kuadratik Terhadap Produksi Susu
Kambing Peranakan Etawah ( Pe ) Selama 90 Hari
Pertama Laktasi. Informatika Pertanian, 13(Desember
2004), 735–743.
ICMIs 2018 - International Conference on Mathematics and Islam
486
