
Implementation Self Organizing Map for Cluster Flood Disaster Risk
Indi Febriana Suhriani, Lalu Mutawalli, Baiq Rina Ari Widiami and Chumairoh
Universitas Gadjah Mada, Indonesia
Keywords: Cluster, Flood Disaster, SOM.
Abstract: Floods have devastating effects on human, economic, and environmental life. The flood risk can't be avoided
completely so it must be managed. Flood disaster management does not seek to eliminate the danger of
flooding, but to cope with it. Thus, this study aims to (1) classify the provinces in Indonesia based on the
results of flood risk analysis; (2) Identify flood risk characteristics in each group; and (3) Analysist the flood
risk level of each province in Indonesia. The research method used in this research is the method of Self
Organizing Map (SOM) by using software R. This research conducted cluster class based on flood risk
variables, i.e. province, number of incidents, a victim, houses and damages. The results showed the grouping
divided into 6 clusters with members of each cluster are; cluster 1 (central of java and east java), cluster 2
(west java), cluster 3 (Aceh, North Sumatra, West Sumatera, Riau, Jambi, South Sumatra, Bengkulu,
Lampung, Bangka Belitung, Kepulauan Riau, DKI Jakarta, Bali, Nusa Tenggara Barat, East Kalimantan,
North Sulawesi and Papua), cluster 4 (Banten, West Papua), cluster 5 (South Kalimantan), and cluster 6
(central).
1 INTRODUCTION
Indonesia is one country that has disaster-prone areas,
one of the disasters that often befall Indonesia is
flooded. Floods have an impact that can be bad for
human life. Flood disaster can affect the disruption of
the economy and the environment (UNISDR. 2015).
Negative impacts caused by floods are important for
anticipatory steps. To take anticipatory steps requires
knowledge of the hazards of their impact (Zischg, et
al., 2018). There have been several previous studies
on the analysis of the negative impacts of floods.
Studies show that the impact of flooding is not only
on aspects of buildings and materials. However, the
effect on the prevalence of increased psychological
illnesses after the flood disaster (Zhong, et al. 2018).
To explore the linearity of relationships using
spatial analysis and temporal variants of the impact of
floods. The results show that most and most affected
are nonlinearly properties especially those close to the
river (Rajapaksa, Zhu, & Lee, 2017). Hydrographic
construction design for the study of climate change
impacts, informative hydrograph development in
flood disaster impact studies (Brunner, Sikoska, &
Seibert, 2018). Factor analysis that influences flood
by using weighted overlay technique approach,
research result can give information about danger
zone of food for early (Azmeri, Hadihardja, & Vadia,
2016)
Several previous studies have conducted various
analysis approaches to the impact of floods. In this
study we propose anticipatory steps in obtaining flood
information in the territory of Indonesia. This
research can provide knowledge by conducting flood
risk level analysis at every province in Indonesia. In
order for prevention and mitigation measures to be
carried out properly, effectively and efficiently.
The method proposed in this research is the Self
Organizing Map method (SOM) and the aid of
computation method using R programming language
to support the faster analysis process done. The self-
organizing map is a statistical data analysis method of
the branch of unsupervised learning, whose goal is to
determine the properties of input data without explicit
feedback from a teacher (Martin & Obermayer,
2009). The SOM algorithm creates mappings which
transform high-dimensional data space into low-
dimensional space in such a way that the topological
relations of the input patterns are preserved (Köküer
& Green, 2007). Some previous studies used the self-
organizing map method. The use of SOM integrated
with image processing to model the detection of
damaged gaps in bridges (Chen, et.al, 2017). SOM
implementation can be used to model traffic
Suhriani, I., Mutawalli, L., Widiami, B. and Chumairoh, .
Implementation Self Organizing Map for Cluster Flood Disaster Risk.
DOI: 10.5220/0008522604050409
In Proceedings of the International Conference on Mathematics and Islam (ICMIs 2018), pages 405-409
ISBN: 978-989-758-407-7
Copyright
c
2020 by SCITEPRESS – Science and Technology Publications, Lda. All rights reserved
405
disruption patterns (Steiger, et.al., 2016). SOM
implementation can effectively help better rescue
planning in the aftermath of a disaster. The built
model is used to produce a risk map of survival. Some
problems can be modeled and, in the map, using the
SOM approach. The SOM method adopted in this
study to cluster can provide clustering of areas most
affected by floods. This study aims to provide early
knowledge about the potential for flood disasters in
the territory of Indonesia.
2 RELATED WORK
2.1 Self Organizing Map
Kohonen Self Organizing Maps is a network found
by Teuvo Kohonen is one of the most widely used
networks. Named "self-organizing" because this
method does not require a special surveillance and
SOM approaches through unsupervised competitive
experiments. The word "maps" it self because this
method using the map in weighting input data. Each
node in this network works to present each data input,
therefore this network can also be called "Self-
Organizing Feature Maps", the concept of "features"
becomes an important and valuable thing, specifically
the topology relationship between the inputted data
will be maintained and original when mapped in the
SOM network (Guthikonda, 2005).
In perspective, SOM can be seen not only as a
tool but as a toolbox that contains the features of
numbers and can be more interesting in different
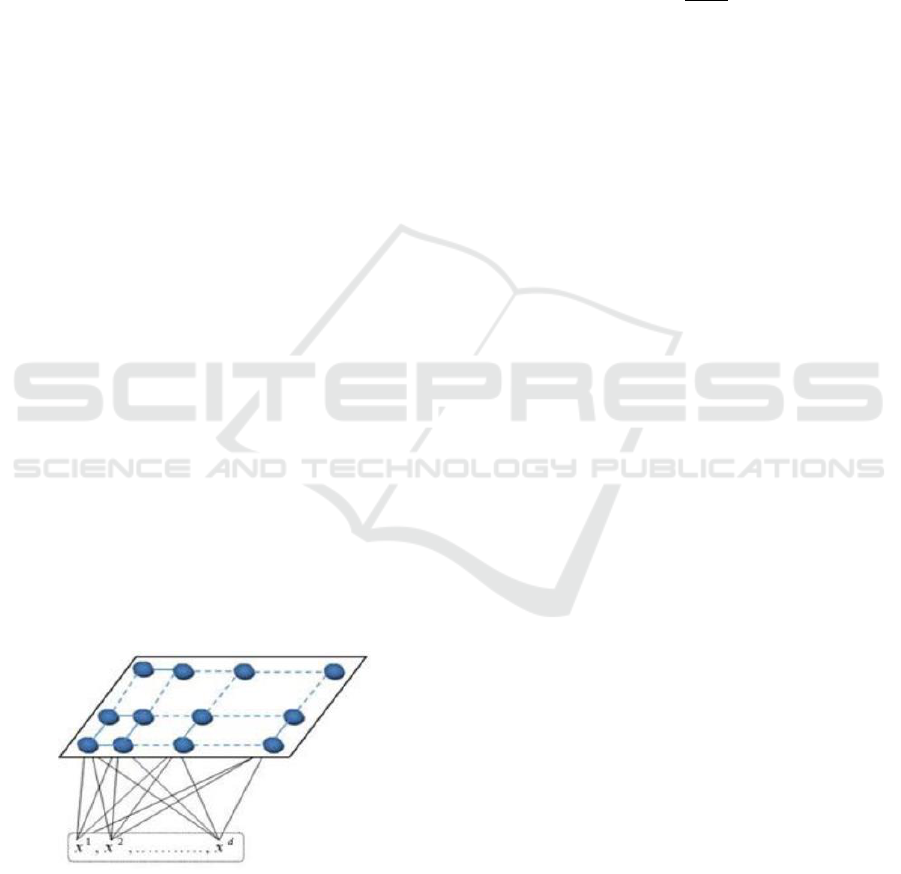
situations. SOM Kohonen network has three topology
types, namely linear array, rectangular, and
hexagonal. Linear array topology shows cluster units
arranged linearly
Figure 1: Kohonen Topological Map.
Source: Yusob, B., et al., (2013)
2.2 Cluster Validation
Cluster validation is a procedure that evaluates the
results of quantitative and objective cluster analysis.
Index Dunn is one part of the cluster validity such as
the Davies-Bouldin index or the Silhouette index in
this case Dunn index is an internal evaluation scheme
where the result is an internal evaluation scheme.
(1)
d
min
= smallest distance between observations on
different clusters
d
max
= largest distance in each data cluster
3 RESULTS AND DISCUSSION
Based on the objective of this research is to group the
provinces in Indonesia and identify the characteristics
based on flood disaster risk in 2008-2018 by using
Self Organizing Maps method. The Kohonen network
is used to divide input patterns into clusters. Suppose
the input is a vector consisting of n components to be
grouped within a maximum of group m. SOM
network requires a training progress to minimize the
average distance of an object to the nearest.
In figure 2 below is below is the number of
progress training that shows the number of iterations
against the average distance to the nearest unit.
Progress or iteration training is used to find out how
much it takes for the cluster to be optimal, the more
iterations are carried out, the smaller the distance of
cluster units and the results of grouping will be better.
After passing an iteration of approximately 4000
shows that the progress of the training begins to
stabilize with the average cluster unit distance below
0.05 and the researcher uses 10,000 iterations to do
this grouping. To help researchers determine which
clusters produced in SOM can be done using the
Cluster Amount of Squares (WCSS). The Cluster
Sum of Squares (WCSS) is able to help groups
desired by researchers.
ICMIs 2018 - International Conference on Mathematics and Islam
406
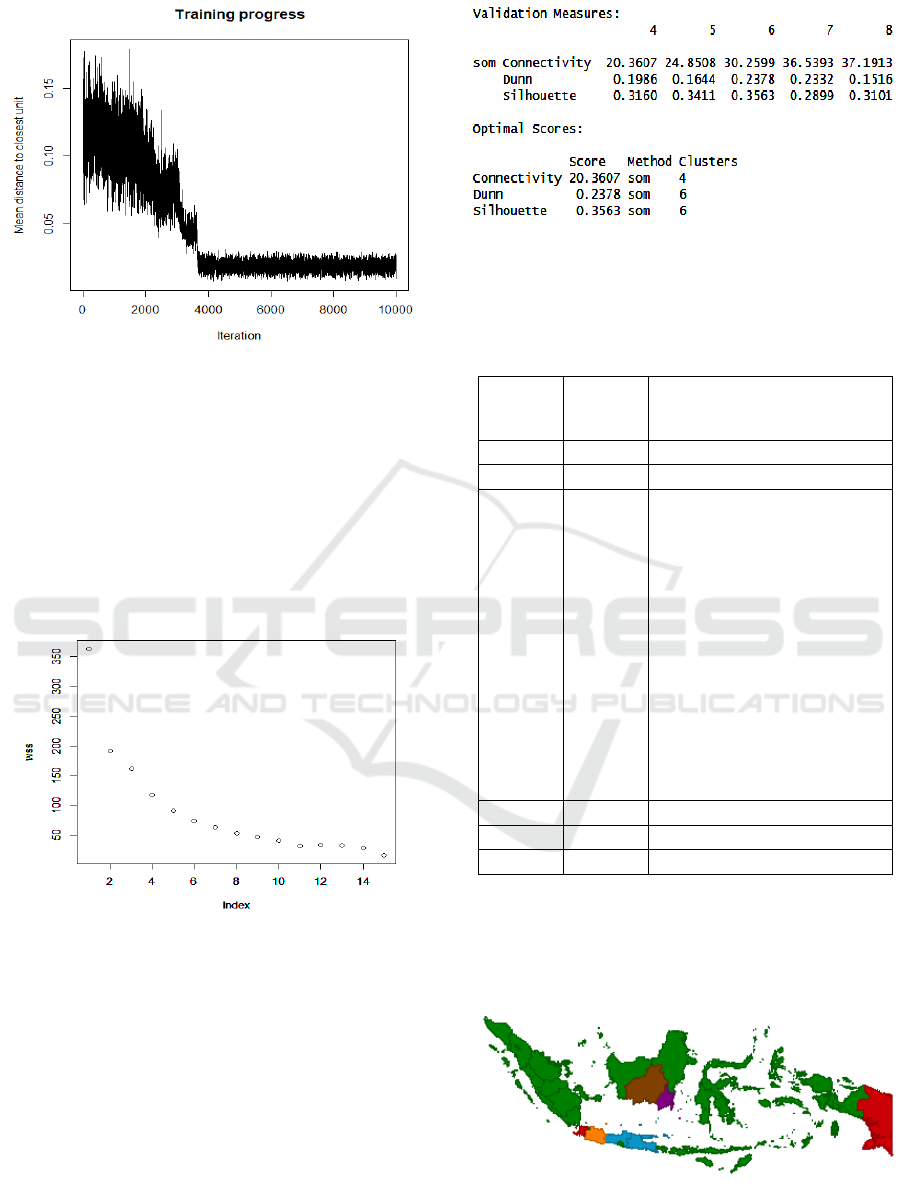
Figure 2: Training Process.
Figure 3. Seen at the time of forming one cluster,
curve still shows steepness and increasingly sloping
according to cluster increase. In essence the number
of clusters that are formed when the number of
members who joined fewer and fewer. To prove
whether the number of clusters selected is correct or
has not been used cluster validity test, the following
is the output of programs R on the test of cluster
validity:
Figure 3: Within Cluster Sum of Squares.
Figure 4 cluster validation can be known if the
cluster to be formed is 4 clusters up to 8 cluster then
the best cluster is 6 clusters, as shown in the picture
above optimal scores shows there are two methods
that choose the 6 most reverse clusters are Dunn and
Silhouette, while connectivity shows that 4 clusters
are the best number of clusters, because there are 2
that say that 6 clusters are the best result, the
researcher will use 6 clusters for flood disaster
grouping in Indonesia by province using 6 clusters.
After the number of clusters is determined then the
next process is to make fan diagram.
Figure 4: Cluster Validity Test.
The results of the provincial grouping using SOM
are as shown in table 1 below.
Table 1: Number and Grouping Members.
Group
Number
of
Member
Members of the group
1
2
Central Java, East Java
2
1
West Java
3
27
Aceh, North Sumatera, West
Sumatera, Riau, Jambi, South
Sumatera, Bengkulu,
Lampung. Bangka Belitung
Islands, Riau Islands, DKI
Jakarta, Yogyakarta, Bali,
West Nusa Tenggara, East
Nusa Tenggara, West
Kalimantan, East Kalimantan,
North Sulawesi, North
Sulawesi, Central Sulawesi,
South Sulawesi, Southeast
Sulawesi, Gorontalo, West
Sulawesi, Maluku, North
Maluku, Papua
4
2
Banten, West Papua
5
1
South Kalimantan
6
1
Central Kalimantan
The mapping results from the grouping analysis
using Self Organizing Maps are shown in Figure 5.
Figure 5: Mapping Using SOM Algorithm.
Implementation Self Organizing Map for Cluster Flood Disaster Risk
407

SOM grouping table and SOM mapping visually
and see the table of group average, cluster 1
consisting of Central Java and East Java has the
largest number of occurrences. Successively 929 and
963 incidents with the number of house damage
(heavily damaged, medium, light, submerged) also
have a high value. This group corresponds to the one
associated with the blue circle in Self Organizing
Maps.
West Java in an orange circle is cluster 2 in Self
Organizing Maps output has a high number of
occurrences with damage of house (damaged heavy,
medium, light, submerged) which is most numerous
than a group. Victims (died, injured, suffered) are
high while the number of injured is very large that is
37195 inhabitants, higher than other groups. The
green circle is associated with 27 provinces: Aceh,
North Sumatera, West Sumatera, Riau, Jambi, South
Sumatera, Bengkulu, Lampung, Bangka Belitung
Islands, Riau Islands, Jakarta, Yogyakarta, Bali, West
Nusa Tenggara, East Nusa Tenggara, West
Kalimantan, East Kalimantan, North Kalimantan,
North Sulawesi, Central Sulawesi, South Sulawesi,
Southeast Sulawesi, Gorontalo, West Sulawesi,
Maluku, North Maluku, Papua are incorporated in
cluster 3 has an average.
The number of occurrences with the category of
damage to the house (heavily damaged, medium,
light, submerged) is very small, so it has a low
average value too. On average the number of victims
(died and missing, injured, suffered and displaced)
and also broke facilities (health, worship, education).
Banten and West Papua are associated in a red circle
on Self Organizing Maps, which is cluster 4, where
this cluster has the lowest number of events compared
to other clusters.
Table 2: Cluster Profile.
Cluster 1
Cluster 2
Cluster 3
Cluster 4
Cluster 5
Cluster 6
Number of events
946
786
126.96
85.5
184
116
People Died and
Missing
112
148
28.93
250
44
2
Injuries
14731.5
37195
532.96
8351
381
860
Suffered and
displaced
996364.5
2013938
257086.8
319338.5
4860178
398342
Heavy Damage
House
1791
4839
759.22
966
262
0
Houses Damaged
Medium
1954
2455
130.3
81
8
0
Light Damaged
House
6928
9232
2776.81
179.5
275
3349
House Submerged
393278
647737
51033.3
48395
235426
58527
Health facility
0.5
1
0.78
0
0
48
Worship Facilities
13
115
4.44
0
13
131
Educational Facilities
29.5
44
10.63
1
15
158
The low number of damages to houses (severely
damaged, medium, light, submerged) and poor
facilities (health, worship, education) are still needed
for education or training on disaster mitigation due to
the average. The highest number of deaths and
disappearances compared to other clusters, while the
number of victims (injured, suffered and displaced)
has a moderate average. In cluster 5, South
Kalimantan is associated with a purple circle, for this
cluster has the lowest number of events, and the low
number of damage to the house (damaged, medium,
light) is accompanied by low facility damage (health,
worship, education), but the number of houses soaked
in water is so high that the number of displaced
persons also has the highest number among other
clusters. Finally, central Borneo is associated in a
brown circle with a low number of incidents, and a
low number of (low, medium, light, submerged)
damage to homes, and low casualties (dead and
missing, injured, suffered and displaced) also, in this
case need improvements in terms of facilities (health,
worship, education) because it has the highest
damage value compared with other clusters.
4 CONCLUSIONS
The number of groups formed as many as 6 groups, is the
number determined by researchers with the approach using
Within Cluster Sum of Squares. The use of Self Organizing
Maps algorithm resulted in a grouping with a group of 27
provinces, two groups of 2 provinces and three groups of 1
province each. Groups 1 and 4 each consist of Central Java,
East Java and Banten, West Papua. Groups of 2.5.6 and 4
ICMIs 2018 - International Conference on Mathematics and Islam
408

each consist of West Java, Central Kalimantan, and South
Kalimantan. Group 3 consists of Aceh, North Sumatera,
West Sumatera, Riau, Jambi, South Sumatra, Bengkulu,
Lampung, Kep. Bangka Belitung, Kep. Riau, DKI Jakarta,
In Yogyakarta, Bali, West Nusa Tenggara, East Nusa
Tenggara, West Kalimantan, East Kalimantan, North
Sulawesi, North Sulawesi, Central Sulawesi, South
Sulawesi, Southeast Sulawesi, Gorontalo, West Sulawesi,
Maluku, North Maluku, Papua.
ACKNOWLEDGEMENTS
Thanks to the Islamic University of Indonesia which has
provided budget support for the implementation of the
research process and budget to attend the international
conference which will be held by the Universitas Islam
Negeri Mataram West Nusa Tenggara.
REFERENCES
Azmeri, Hadihardja, I., & Vadia, R. 2016. Identification of
Flash Flood Hazard Zones in Mountainous Small
Watershed of Aceh Besar Regency Aceh Province
Indonesia. The Egyptian Journal of Remote Sensing
and Space Science, Vol 19(1), 143-160.
Brunner, M. I., Sikoska, A., & Seibert, J. 2018. Bivariate
Analisis of Flood in Climate Impact Assessments.
Science of The Total Environement, 1392-1403.
Chen, J. H., Su, M. C., Cao, R., Hsu, S. C., & Lu, J. C. 2017.
A Self Organizing Map Optimization Based Image
Recognition and Processing Model for Bridge Crack
Inspection. Automation in Construction, Vol 73, 58-66.
Guthikonda, S. M. 2005. Self-Organizing Maps. In
Kohonen, & Teuvo, Self-Organizing Maps (p. 10). US:
Springer.
Köküer, M., & Green, R. 2007. Towards Automatic Risk
Analysis for Hereditary Non-Polyposis Colorectal
Cancer Based on Pedigree Data. Outcome Prediction in
Cancer, 319-337.
Martin, R., & Obermayer, K. 2009. Self-Organizing Maps.
Encyclopedia of Neuroscience, 551-560. Academic
Press.
Rajapaksa, D., Zhu, M., & Lee, B. 2017. The Impact of
Flood Dynamics on Property Values. Land Use Policy,
Vol 69, 317-325.
Steiger, E., Resch, B., Albuquerque, J. P., & Zipf, A. 2016.
Mining and Correlating Traffic Events from Human
Sensor Observations with Official Transport Data
Using Self Organizing Maps. Transportation Research
Part C: Emerging Technologies, 73, 91-104.
UNISDR. 2015. Making Development Sustainable: The
Future of Disaster Risk Management. United Nations:
Geneva.
Yusob, B., et al. 2013. Spiking Self-Organizing Maps for
Classification Problem. Technology Came, Vol 11, 57-
64.
Zhong, S., Yang, L., Toloo, S., Tong, S., Sun, X.,
Crompton, D., et al. 2018. The Long Term Physical and
Pysicological Health Impacts of Flooding: A
Systematic Mapping. Science of The Total
Environment, 165-194.
Zischg, A. P., Hofer, P., Mosimann, M., Röthlisbergerab,
V., Ramirez, J., Keiler, M., et al. 2018. Flood Risk (d)
Evolution: Disentangling Key Driver of Flood Risk
Change with a Retro Model Experiment. Science of The
Total Environment, 195-207.
Implementation Self Organizing Map for Cluster Flood Disaster Risk
409
