
Misconceptions of English Students on Education Statistic
Mutia
State Islamic Institute of Curup, Rejang Lebong District, Bengkulu Province, Indonesia
Keywords: Misconceptions, Students, Education Statistic.
Abstract: This study aims to identify the misconceptions of English students in the Education Statistics course which
consists of descriptive statistics and inferential statistics. Research subjects are students of English semester
IV class B State Islamic Institute of Curup Academic Year 2017/2018 selected by purposive sampling. Data
collection techniques use written tests, interviews, and documentation. Test of data credibility in this research
is using technique triangulation. The results showed that students’ misconception in the use of parameters and
statistics so that further difficulty in determining the use of formulas for both single data and groups data and
misconceptions in the determination of hypotheses and statistical tests are used in accordance with the
research problems given to result in the wrong research conclusions. Result of the concept of descriptive
statistics are still weak and the students also have misconception in inferential statistics, so it is important to
understand the basic concepts in descriptive statistics in order to avoid a greater misconception in inferential
statistics because the two are highly interrelated. Students who are less rigorous in the process can also be a
source of misconception of students in solving statistical problems both descriptive and inferential.
1 INTRODUCTION
Mathematics, in its very nature, is full of abstract
representations. It is a hierarchical build-up of
concepts, skills and facts. The successful learning of
mathematics involves a systematic building up of
such a hierarchy of concepts (Ruberu, 1992) and ideas
need to be understood and woven together in order for
concepts to build on one another (Ashlock, 2002).
Mathematics is the study of quantity, structure, space,
and change. Mathematicians seek out patterns,
formulate new conjectures, and establish truth by
rigorous deduction from appropriately chosen axioms
and definitions (Schleicer & Lackmann, 2011).
Mathematics is taught from concrete, semi-concrete,
to abstract, and teaches concepts from simple to
complex concepts. During the past decades, research
on statistical literacy and statistics education has
established itself as an important and rapidly growing
research field (Callaert, 2002). Statistics is one of the
branches of mathematics studied from Elementary to
High School level which has many concepts, only at
the college level, the statistics studied are more
abstract and lead to research problems. Statistics in
college is a knowledge related to ways of collecting
data, processing, presenting, analyzing, and drawing
conclusions based on data and analysis performed.
The statistics section covers the methods and methods
of collecting, presenting, processing and analyzing
descriptive data called descriptive statistics and the
part which involves drawing conclusions called
inferential statistics (Setyo Winarni & Harmini,
2011). Both statistics are different types and different
studies. However, there is interrelation between
ability in inferential statistics and descriptive
statistics: if the ability of descriptive statistics can be
well controlled then the inferential statistics would be
able to do well. Sutrisno & Murtianto (2016) argue
that the mastery of descriptive statistics is desperately
needed inferential statistics courses used in
quantitative research.
Angle (2007) explained that many mathematical
concepts can be understood only after the learner has
acquired procedural skill in using the concept. More
than often in schools, teachings of mathematics are
more focused on rules, procedures and formulas used
to arrive at the correct answers rather than teaching
students’ basic concepts. Skemp (Orton, 2004)
suggests that mathematical concepts are structured
hierarchically, one concept being the basis for other
concepts. This means that the concepts in studying the
material are interrelated, to learn a new concept must
have to master the old concept first and in learning
mathematics always happen that way. While Irawati
Mutia, .
Misconceptions of English Students on Education Statistic.
DOI: 10.5220/0008522103690377
In Proceedings of the International Conference on Mathematics and Islam (ICMIs 2018), pages 369-377
ISBN: 978-989-758-407-7
Copyright
c
2020 by SCITEPRESS – Science and Technology Publications, Lda. All rights reserved
369

et al. (2014) argued that the concept or material is an
extension or deepening of the material that has been
studied. It becomes very bad if the students are more
and more teachers have a misconception or
inappropriate to a certain mathematical concept or
called misconception.
Holmes, Midema, Nieuwkoop, & Haugen, (2013)
explained that misconceptions arise from the problem
of conceptual misunderstanding. Errors come from
calculations or minor accidents. On the other hand,
Thompson & Logue (2006) describe misconceptions
as ideas that provide a misconception about such
ideas, objects, or events built on one's experience.
Dzulfikar & Vitantri (2017) also explain that the
misconception of mathematics can also be a mistake
in the application of a rule or inappropriate
generalization. When someone systematically uses
the wrong rules or uses the right rules, but is used
outside his application. (Suparno, 2013) also suggests
that misconceptions are conceptual understandings
that are inconsistent with scientific understanding or
agreement of experts in the field. Essentially,
misconceptions are different from errors. Luneta &
Makonye (2010) defined an error is a mistake, slip,
blunder or inaccuracy and a deviation from accuracy.
While, Hansen (2011) also suggest that error is a
mistake made by someone due to carelessness,
misinterpretation of the problem, lack of experience
in solving problems related to a given topic or due to
the inability to check the answers obtained.
Misconceptions and errors must not be seen as
obstacles or 'dead ends' but must be regarded as an
opportunity to reflect and learn. Teachers should
recognize these misconceptions; prescribe
appropriate instructional strategies to be more
diagnostically oriented in order to avoid any
subsequent major conceptual problems. Diagnosis
should be continuous throughout instruction
(Roselizawati, Sarwadi & Shahrill, 2014).
Based on several notions of misconception above,
it can be concluded that misconception is a mistake in
understanding concepts or concepts that are not in
accordance with the concepts that have been put
forward by experts.
Misconceptions are caused by a variety of things.
Generally can be caused by students themselves,
teachers who teach, learning context, way of
teaching, and textbook (Suparno, 2013). The
identification of misconceptions is important in order
to locate misconceptions and their causes. Salirawati
(2011) explains that to simplify the process of
identification of misconception is categorized into
three criteria that is not understanding the concept,
misconception, and understand the concept. Irawati et
al. (2014) mentions that the location of
misconceptions experienced by learners is in re-state
the concept, classify objects according to certain
characteristics in accordance with the concept,
example on a concept, using and utilizing and
selecting a particular procedure or operation and
apply the concept or algorithm on solution to
problem. If these misconceptions occur continuously,
it will result in low student learning achievement.
Andini (2012) also points out that sustainable
misconceptions if not addressed properly and
addressed early may pose problems in subsequent
learning.
The problem of statistical misconception of
Tadris English students at IAIN Curup actually
originated from the difficulties experienced by the
students. Students basically also have gained the
concept of statistics when in school. However, it is
still often found difficulties when working on the
matter of statistics. This can be caused by several
things based on the observation results of the Tadris
English students IAIN Curup academic year
2017/2018 are: 1) the student forgot and there is no
understanding of the concept he has gained at the
school level both at the primary and middle level; 2)
majoring in current study is more about the science of
English than science especially mathematics. In the
Faculty of Tarbiyah English IAIN Curup is currently
only studying the branch of mathematics is statistics
and does not study other branches of mathematics
such as basic mathematics, so it is very influential in
understanding the symbols and mathematical
notation; 3) the level of motivation and academic
ability of different students, which cannot be equated
with one another. Though studying statistics is very
important because statistics will continue to be used
until the preparation of Student Final Project in the
form of thesis. Starting from the problem, then many
students who have difficulty in learning to cause
misconception both in descriptive and inferential
statistics. Research conducted by Firmansyah (2017)
also explains the same problem in studying statistics
that students have varied learning ability statistics and
students have a tendency of negative attitudes on the
course. In another study, Maizam (2009) also
explained that the topic in descriptive statistics is the
scale of measurement, summation and presentation of
data, relationships and correlations between two
variables. Most students consider statistics to be
nothing more than numbers and formulas with limited
use in their daily lives or their future professions. In
addition, some students believe that they understand
statistics if they are able to declare and put numbers
into the wrong formula because statistics are not
ICMIs 2018 - International Conference on Mathematics and Islam
370
about inserting numbers into formulas, but a process
for obtaining information (Chance, 1997 in Rumsey
2002) and performing calculations not the same as
understanding the statistics (Gal, 2000 in Rumsey,
2002). For example, the student's ability to calculate
standard deviations does not indicate a student's
ability to understand what standard deviations and
what is measured or how they are used. In addition,
students also feel that the usefulness of educational
statistics is limited only to answering in tests and
exams. The type of Asian students, these students are
also quite passive in the classroom. Statistical
misconceptions have been observed among students
on various topics including relationships and
correlations, hypothesis testing. On the other hand,
Zaidan, Ismail, Yosuf, & Kashefi (2012) also
explained that some students exhibit misconceptions
such as averages as a mean multiple, averages as the
sum of values of variables, and averages can only be
generated from a constant value and equal to that.
Based on these matters, the researchers are
interested to follow up in the form of research.
Researchers want to identify misconceptions of
English students in the Education Statistics course
which consists of descriptive statistics and inferential
statistics. In this study, descriptive statistics are
limited to conceptual misconceptions related to data
presentation, data central tendency, and data
dispersion. While inferential statistics are limited to
misconceptions of concepts related to hypothesis
testing.
2 METHOD
This research is a research with qualitative descriptive
approach with subject 3 (three) students of fourth
semester of Tadris English Faculty of Tarbiyah IAIN
Curup academic year 2017/2018. In this research,
researcher use purposive sampling that is technique
of taking sample of data source with certain
consideration. The main instrument in this study is the
researchers themselves (Sugiyono, 2011). The
instruments used are written tests and interviews. Test
the credibility of the data using triangulation
technique that is comparing the results of written tests
with interviews.
3 RESULTS
In the methodology, the researcher used purposive
sampling in sampling of data source that is 3 (three)
students who most misconception based on written
analysis. The three subjects were given a written test
of the concept of descriptive and inferential statistics.
These three subjects are presented in the following
table:
Table 1: Research Subject.
No
Initial
M/F
Code
1
AG
F
1
2
DU
F
11
3
FA
F
18
In the Table 1, the initials containing AG, DU,
and FA are the three students selected for data
collection and interviewed further to locate
misconceptions and their causes. For M/F column
indicates student's gender while the code column
indicates the student's absence number. Each
misconception will be explained in this discussion.
The following issues are used in this research
instrument:
Figure 1: Question Item.
Here are the results of the work of the three research
subjects:
1. Subject with initials AG
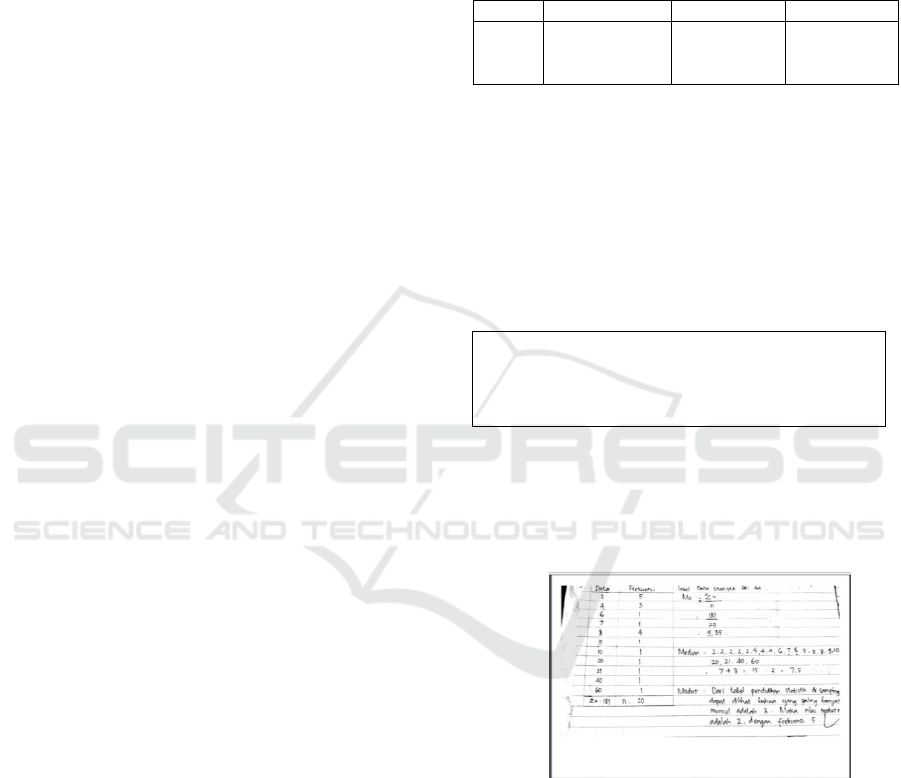
Figure 2: Misconception by AG about data presentation and
central tendency.
Students are seen to be able to present data in the form
of tables namely Single Data Frequency Distribution
Table. It's just that in the use of notation is still a
mistake. In the table looks
when it should be
because the data is presented in the form of
frequency tables that have a frequency. Here students
seem to misunderstand the concept of
and
.
If
is the sum of all known data, then
is the
sum of the multiplication of each data with a lot of
Calculate the mean, median, mode, variance, and
standard deviation from the following data:
2
8
4
2
4
8
2
9
2
10
20
8
4
21
40
60
2
8
7
6
Calculate the mean, median, mode, variance, and
standard deviation from the following data:
2
8
4
2
4
8
2
9
2
10
20
8
4
21
40
60
2
8
7
6
Misconceptions of English Students on Education Statistic
371
data (frequency). This results in a false end result.
Likewise, with the use of the average formula (mean)
and notation that should be and not Me. This shows
that students cannot distinguish between the average
notation and median (Me).
In addition, in the median, the student also still
looks not yet able to write and the median formula for
even data is
. If the data
given more number, then the student will more
difficult to calculate. These misconceptions fall into
the concept of presentation data size and central
tendency data. As for the concept of data dispersion
can be shown in the results of students as follows:
Figure 3: Misconception by AG about data dispersion.
In answer to the above variance, the student is quite
good considering the formula and write it down.
However, there is a slight disadvantage that in the
previous table students have created a frequency
distribution table, so students should write
to make it easier and simpler to complete the
calculation. For that, students should use auxiliary
tables only tables that have been made developed
again for the needs of calculation of standard
deviation in order to facilitate the calculation of the
difference in data with the average which then
squared and facilitate multiplication with the
frequency.
Then, the answer also shows that students are
wrong in entering data. The student enters the value
of n = 20 (n=
into the value of x in the formula
when it should be x each is the data in the table, for
example x
1
=1, x
2
= 2, etc., which is then summed, by
therefore, it is necessary to multiply with frequency
to facilitate calculation. Students also do not
understand the sign of sigma in the formula, so at the
end of the settlement gives wrong results. This gives
researchers predictions to students that students have
not understood the concept of using the
If
this continues, it leads to continuous errors when
calculating statistical tests that require the calculation
of variance and standard deviation.
Based on the student's conversation with the
researcher about the above mistakes, the following
information is obtained:
Students realize not yet understand the use of
notation
and
, whereas the intended by the
student is wanted to sum up the data by multiplying
the data known by the number of frequencies each
data. However, finally just add the data in the left
column (figure 1) i.e.
=187, when it should be
. Students do not realize that for data x
1
=2 it has a frequency of 5 and so on. As for the use
of the symbol of the average, it is due to forget.
Visible then students write back / justify the simbol
before the formula.
For writing the median symbol, students explain
forgetting to write the symbol. As for the use of the
formula, the student realizes it does not remember and
does not understand the use of the median formula
that has been given during the lecture. As a result, do
not understand the concept, then be do not remember.
At the completion of the variance, the student
realizes that he does not understand the settlement
procedure. When entering the value of x, the student
does not understand the value of x which will be
included in the formula so that finally choose to enter
the value of n. During this time students are
accustomed to memorizing the formula given,
without understanding how to use it. Whereas in the
frequency distribution table, has written
, where
the data symbolized by x. In addition, the student is
also unaware that the formula should be used by using
frequency multiplication by the difference of data
then squared i.e..,
because the frequency is
already known in the table, so it is not necessary sum
up each difference in data with more than one
frequency.
2. Subject with initials DU
For explanation of picture 4. In student initials DU,
basically have been able to arrange settlement
procedure systematically and count well. However, it
is a mistake to write a notation for the number of N
sample sizes that should be n, even if the value
entered is the same. The difference is about where the
data comes from, whether population or sample. In
the use of notation, the average student is also still
inconsistent with the notation that has been agreed by
the expert that is . In addition, the students at DU are
also unable to present data with frequency
distribution tables in either single data or group data.
ICMIs 2018 - International Conference on Mathematics and Islam
372
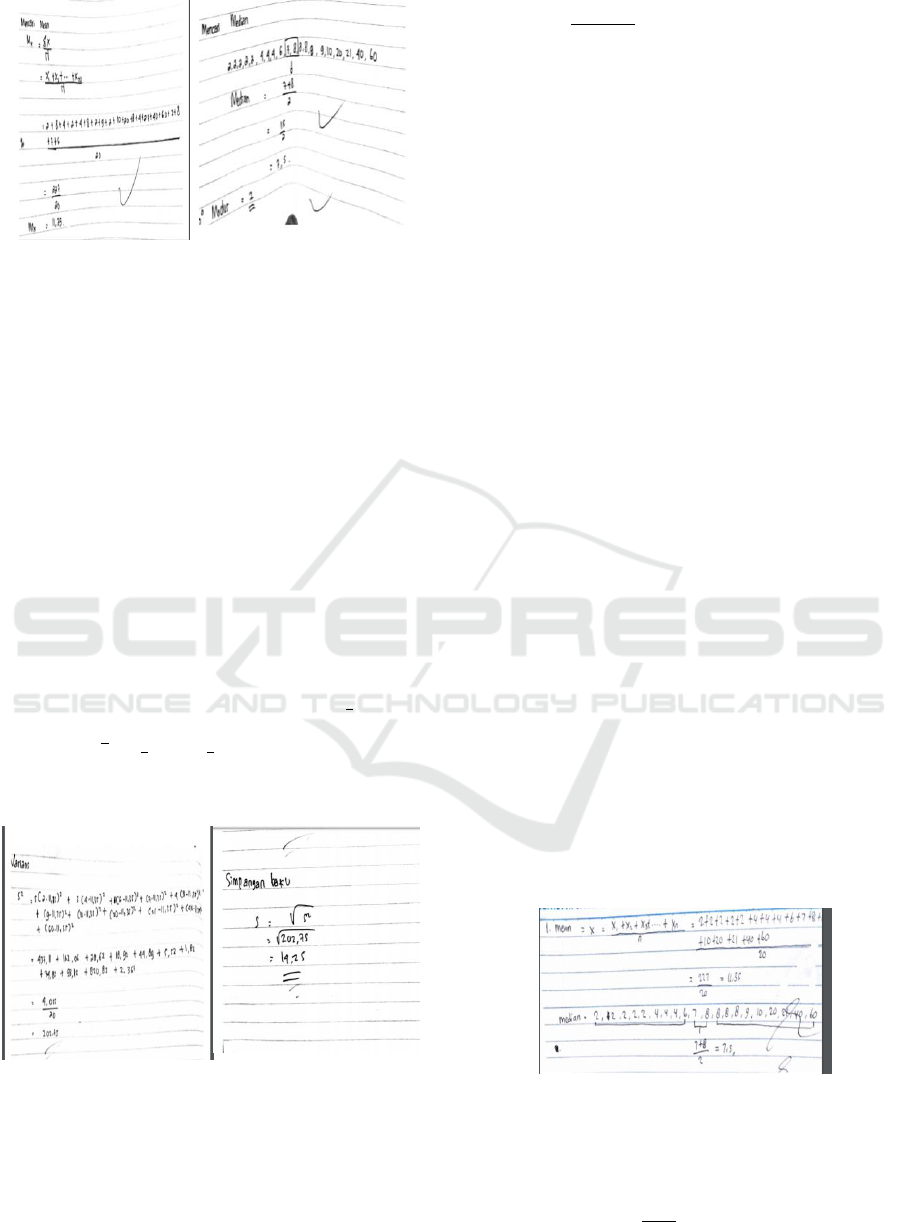
Figure 4: Misconception by DU about central tendency.
Basically, students not only learn about the
centralization of data, but also about the location of
data. In the student's reply, the student understands
the location of the median in the location of quartile
data 2 or symbolized by Q
2
. Quartiles are a placement
measure that divides a data group into four equal parts
(Subana, Rahadi, & Sudrajat, 2000). Namely Q
1
, Q
2
,
and Q
3
. The location of Q
2
is the position in the
middle of the data that divides the data into two parts.
In the answer is seen students divided the data into
two equal parts. Thus, the median value is written as
the sum and division of the two data in the middle
position. In fact, in the central tendency, has written
the median formula for even and odd data so that
students can more easily solve it. Worrying if the data
provided in large numbers, students will have
difficulty completing it even if it gives the same
results. The formula for even n is
and
for odd
. Researchers suspect
students find it difficult to use the formula that is to
understand the notations and enter the values.
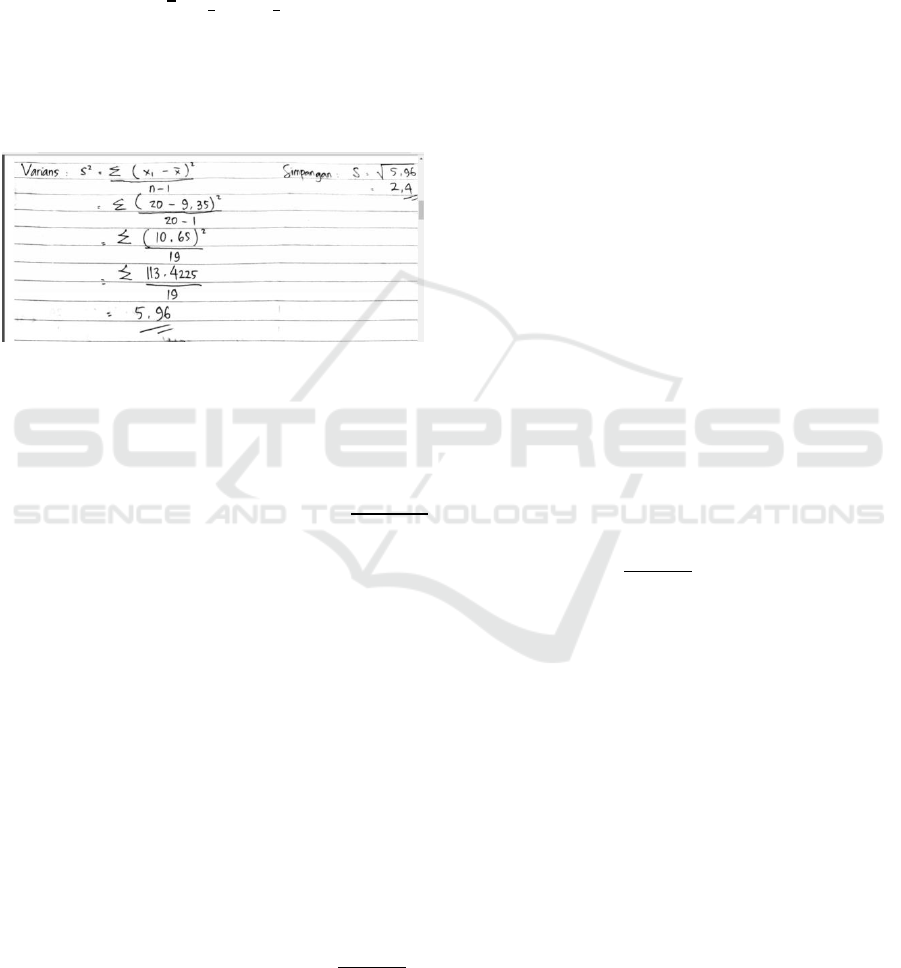
Figure 5: Misconception by DU about data dispersion.
In the student answer above, it appears that the
student is not perfect in solving the problem that is
not writing the formula first. At the completion, it was
seen that students entered n only and not n-1. Even
though it should use n-1 because this is the sample
data where
. Not only that, the calculations
(60-11,35)
2
also experience errors so that the sigma
(addition) of the difference and the square becomes
wrong. As for writing the standard deviation formula
is good is the square root of the value of variance.
However, the final value is wrong because the value
of the variance is also incorrect. Therefore, the
calculation of the variance must be more precise so as
not to result in the standard deviation value. Here it
needs a good understanding of the concept to avoid
errors in the next.
On the subject of initials DU, obtained interview
results as follows:
a. Students understand the concept of calculating the
average of summing all the data then divided by a
lot of data and students also understand the
difference of parameters and statistic that is N and
n. However, the student is aware of his mistake in
writing the notation for the number of data sizes
that should use the n notation as it is the sample
data.
b. After being interviewed about presentation of data
in the table form. Students admitted better without
using tables. However, when given more data,
students are aware of the difficulty of counting.
Moreover, calculate median for even and odd
data. Students unable to remember the median
formula well and students also do not understand
the use of the formula. Students understand that
median location is when the data is divided into
two equal parts or called middle value.
c. Students realize less accurate in calculating and
less thoroughly using the formula that should be
n-1 but written into n. This is because students
rush, but in paper graffiti has written the formula
using n-1.
3. Subject with initials FA
Figure 6: Misconception by FA about central tendency.
In the above point about the central tendency, the
student has been able to calculate the mean (mean) of
a data, although it does not use the formula agreed by
the experts that
. Likewise, with the median
Misconceptions of English Students on Education Statistic
373
value (Me), it appears that it does not use a mutually
agreed formula. Researchers suspect students still do
not understand in the use of these formulas. In
addition, in the use of notation / symbol for the
average, students also cannot write well. It can be
seen from the way students write that writing x, it
should be For presentation data, students also can
not present data in the table so that the written
procedure is not systematic.
Figure 7: Misconception by FA about data dispersion.
When viewed from the student answers above, it can
be explained that the students are not understanding
the concept. Here also seen students do not use
textbooks but using the formula from google. In
writing the notation for the formula is not very clear
as
So the settlement procedure is not clear.
While the final result is correct. So, need further
confirmation to the subject of research about it
through interview.
Based on the mistakes made by the students, then
obtained confirmation between the researchers and
students initials FA as follows:
a. Students realize that they are weak in
remembering and using existing formulas which
should be used to calculate the average and
median.
b. On the variance error, the student realizes not
memorizing the variance formula and does not
understand the use of the formula. When it was
confirmed why the answer was correct and the
process was wrong, the student testified that the
answer was his friend's reply. Students are also
even difficult to read his own writing that is not
neat and unstructured.
In general, if simple concepts in descriptive
statistics are not well understood, it will affect the
completion of inferential statistical questions such as
the following :
a. In a student with the initials AG, there are
misconceptions such as error in using
and
not notation. This misconception is not
actually bad because it actually contains the same
meaning, only when the data is presented in the
table and the frequency is not counted, it will
produce a seriously error. Because it will result in
the mean calculation and then will result in the use
of the hypothesis test formula that is t test to see
the average, t =
with degrees of freedom n-
1, which in the use of the formula requires an
average value. If the incorrect value entered is
incorrect, the calculated test value is also false
and then on hypothesis testing will lead to a false
conclusion that is rejected or accepted based on
the t
count
and t
table
values.
The following is the description of the student's
answer which caused misconception in the work on
the matter of
and hypothesis test (in figure 7).
After interviewed, the students gave information that
initially when working the students are still confused
to calculate the amount of data using that frequency
is
, so the results obtained are different from
what is written when calculate the average that is 811.
But then the students re-confirm the correct answer is
because there is one data having
frequency 2 that is value 81. Thus, it needs to be
added back 811 and 81 so that it becomes 892, then
the average calculation then become true and on the
calculation of t test it also corrects.
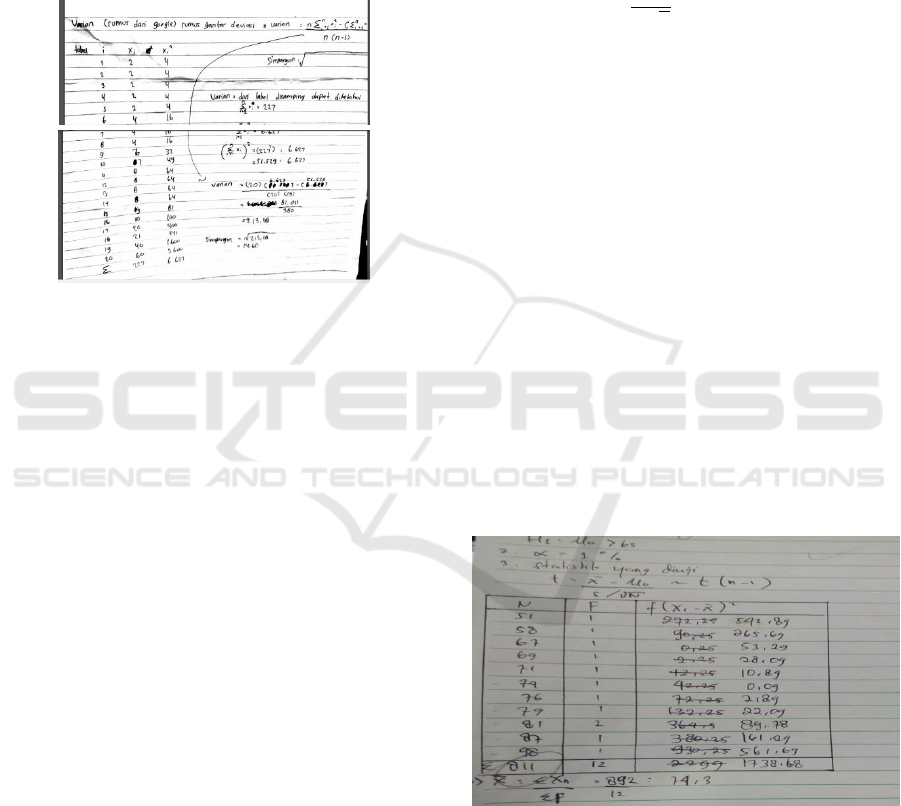
Figure 8: Answer of student in solving hypothesis test
problem.
a. In students with initials DU, there are
misconceptions in the use of parameters and statistics
are N and n. The difference is about where the data
comes from, whether population or sample. Such an
error then continues while working on the inferential
ICMIs 2018 - International Conference on Mathematics and Islam
374
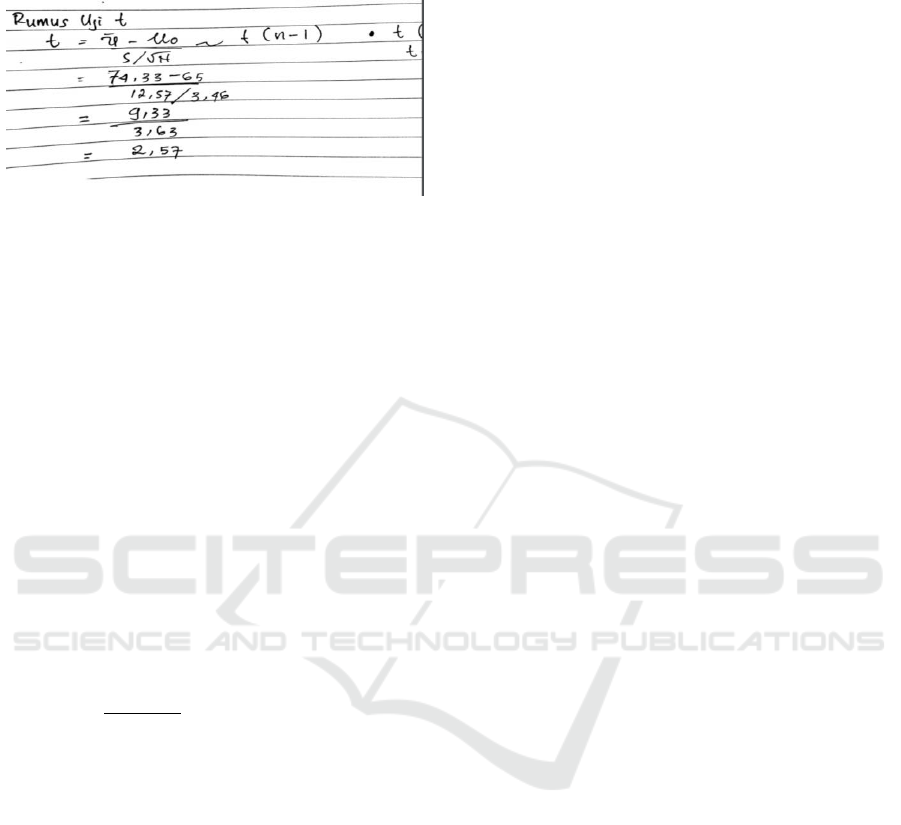
statistics problem, the student still uses the N notation
that shows the population data (as in figure 9).
Figure 9: Answer of student in solving hypothesis test
problem.
b. In students with the initials FA, there is a
misconception in remembering and using
formulas. This is due to material that has not been
well mastered, incomplete understanding of a
concept, and neat and structured writing
difficulties.
In this research, we will look for suitability of
written test analysis with interview result based on
technological triangulation such as:
a. Misconception in the use and development of help
tables is calculated as when calculating
multiplication between data x and its frequency f
and when calculating variance.
b. Students experience misconception on the use of
and
not notation. Basically, both
formulas have the same meaning, but it becomes
fatal when the frequency is not included in the
calculation. Not only that, on the use of the
formula
, the students also still have
difficulties.
c. Misconception determines the use of parameters
and statistics according to the origin of given data
such as n and N, then n and n-1, which then leads
to a miscalculation.
d. Misconception in entering x values, calculating
data differences, and so on.
e. Misconceptions in the use of average symbols,
medians, variance, and standard deviations such
as , Me, Var, s
2
, etc.
f. Misconceptions in remembering formulas and
using formulas so often have difficulty when
using formulas.
g. In inferential statistics, students still make many
mistakes in calculations looking for variance and
standard deviation, determine hypotheses, and test
hypotheses, and conclusions. In the hypothesis
determination, many students still do not
understand how to write more than () and less
than (). This is as a result of the students not
getting basic mathematics in previous lectures, so
it cannot distinguish mathematical notation and
cannot write what is meant in the matter of
hypotheses to be proved (e.g. wanting to prove the
average hypothesis of educational statistics value
is more than 70). While the misconception that
occurs when testing the hypothesis is a
misunderstanding in determining the statistical
test used and the use of these formulas involving
statistics in descriptive statistics. Thus, if the
concept of descriptive statistics is weak, then the
process of hypothesis testing and the conclusion
of students will experience a misunderstanding.
Misconceptions and learning Mathematics is a
common occurrence different group (Mulungye M. et
al., 2016). As an effort to overcome the problem of
misconception that occurs in mathematics is to do
remedial. They explained that teachers’ knowledge
on students’ errors was investigated together with
strategies for remedial teaching. Their studies also
showed that teachers need assistance not only in error
identification but also how the errors would be built
in the whole process of learning.
4 CONCLUSIONS
Statistics in college is a knowledge related to ways of
collecting data, processing, presenting, analyzing,
and drawing conclusions based on data and analysis
performed. The statistics section includes methods
and ways of collecting, presenting, processing and
analyzing descriptive data called descriptive statistics
and parts which include drawing conclusions called
inferential statistics. Both statistics are different types
and different studies. However, interrelated where
inferential statistics would be able to do well if
descriptive statistics can be well controlled.
Misconception is an error in understanding a concept
or concept that is not in accordance with the concepts
that have been put forward by experts.
Misconceptions are caused by a variety of things. In
general, it can be caused by students themselves,
teachers who teach, learning contexts, teaching
methods, and textbooks. The identification of
misconceptions is important in order to locate
misconceptions and their causes because sustained
misconceptions if not addressed properly and
resolved early may pose problems in subsequent
learning. Misconceptions in educational statistics
consist of misconceptions in the use and development
of help tables of calculations, misconceptions in the
use of
and
notations, misconceptions in
determining the use of parameters and statistics,
Misconceptions of English Students on Education Statistic
375

misconceptions in entering x values, calculating data
differences, misconceptions in using symbols
average, median, variance, and standard deviation,
misconceptions in remembering formulas and using
formulas so that they often experience difficulties
when using formulas, in calculating the search for
variance and standard deviation, determining
hypotheses, and testing hypotheses, and conclusions.
The misconception of educational statistics is
basically the mistakes that students have made when
solving statistical problems related to data
summation, data presentation, and so forth. However,
it cannot be entirely the student's mistake, because
misconception can be caused by several things such
as teacher / lecturer, student / student, learning
context, model / learning method, and textbook or
other learning resources provided by the teacher /
lecturer. In this study, misconceptions occur as a
result of students' desire to learn and try hard to solve
statistical problems are still very low, agree with the
statement expressed by (Maizam, 2009) that most
students consider statistics to be no more than
numbers and formulas with limited use in everyday
life. Furthermore, the lecturer's model / method also
needs to be reflected in order to improve the mindset
of the students in solving the statistical problems. The
use of various textbooks or learning resources also
needs to be agreed upon to make no difference in the
use of notations and formulas and provide a good
understanding of the basic concepts of notations and
formulas.
ACKNOWLEDGEMENT
I would like to thank Rector of State Islamic Institute
of Curup and Vices of Rector in the institute. Thanks
should also be bestowed upon Reviewer, who
conscientiously reviewed the abstract, introduction,
and finally this paper. And also would like to thank
my family for the constants support.
REFERENCES
Andini, D., 2012. Miskonsepsi Siswa dalam Mata Pelajaran
Matematika di Sekolah Dasar. Retrieved from
https://www.academia.edu/9746128/Miskonsepsi_Mat
ematika_Siswa_Sekolah_Dasar
Angle, D., 2007. What is conceptual understanding?
Retrieved from https://www.maa.org/external_archive/
devlin/devlin_09_07.html
Firmansyah, M. A., 2017. Analisis Hambatan Belajar
Mahasiswa pada Mata Kuliah Statistika. Jurnal
Penelitian dan Pembelajaran Matematka, 10(2), 115–
127. http://dx.doi.org/10.30870/jppm.v10i2.2036
Ashlock, R. B., 2006. Error Patterns in Computation: using
Error Patterns to Improve Instruction. New Jersey:
Pearson Merrill Prentice Hall.
Callaert, H., 2002. Understanding Statistical
Misconceptions. ICOTS6, 1-4.
Dzulfikar, A., & Vitantri, C. A., 2017. Miskonsepsi
Matematika pada Guru Sekolah Dasar. Suska Journal
of Mathematics Education, 3(1), 41–48.
Hansen, A., 2011. Children Errors in Mathematics:
Understanding Common Misconceptions in Primary
School. Exeter: Learning Matters.
Holmes, V-L, Miedema, C., Nieuwkoop, L., & Haugen, N.,
2013. Data-Driven Intervention: Correcting
Mathematics Students’ Misconception, not mistakes.
Journal of Mathematics Educator, 23(1), 24–44.
Irawati, R., Indiati, I., & Shodiqin, A., 2014. Miskonsepsi
Peserta Didik dalam menyelesaikan Soal pada Materi
Relasi dan Fungsi Kelas VIII Semester Gasal SMP
Negeri 4 Kudus. Prosiding Mathematics and Sciences
Forum, pp. 805-812. Retrieved from
http://prosiding.upgris.ac.id/index.php/masif2014/masi
f2014/paper/viewFile/511/451.
Luneta, K., & Makonye, P. J., 2010. Learners Errors and
Misconceptions in Elementary Analysis: A Case Study
of a Grade 12 in South Africa. Acta Didactica
Napocensia, 3(3), 35–46.
Maizam, A., 2009. Integrating Technology into Classroom
Instructions for Reduced Misconceptions in Statistics.
International Electronic Journal of Mathematics
Education, 4(2), 77–91.
Mulungye M., M., O‘Connor, M., & Ndethiu S., 2016.
Sources of Student Errors and Misconceptions in
Algebra and Effectiveness of Classroom Practice
Remediation in Machakos County- Kenya. Journal of
Education and Practice, Vol.7 (10), 31-33.
Orton, A., 2004. Learning Mathematics: Issues, Theory and
Classroom Practice (3 edition). London: New York
Continuum.
Roselizawati, Sarwadi, & Shahrill, M., 2014.
Understanding Students’ Mathematical Errors and
Misconceptions: The Case of Year 11 Repeating
Students. Mathematics Education Trends and
Research, Vol 2014, Article ID metr-00051,
https://doi.org/10.5899/2014/metr-00051.
Ruberu, J., 1992. How Mathematical Concepts are
Understood and Misunderstood. Science and
Mathematics Education, 1(2), 2–6.
Salirawati, D., 2011. Pengembangan Instrumen Pendeteksi
Miskonsepsi Kesetimbangan Kimia pada Peserta Didik
SMA. Jurnal Penelitian dan Evaluasi Pendidikan,
15(2), 232–249.
Schleicer, D., & Lackmann, M., 2011. An Invitation to
Mathematics: from Competition to Research. Retrieved
from www.springer.com/978-3-642- 19532-7.
Winarni, E. S., & Harmini, S., 2011. Matematika Untuk
PGSD. Bandung: PT Remaja Rosdakarya.
Subana, M., Rahadi, M., & Sudrajat, 2000. Statistik
Pendidikan. Bandung: Pustaka Setia.
ICMIs 2018 - International Conference on Mathematics and Islam
376

Sugiyono, 2011. Metode Penelitian Kuntitatif, Kualitatif,
dan R&D. Bandung: Alfabeta.
Suparno, P., 2013. Miskonsepsi dan Perubahan Konsep
dalam Pendidikan Fisika. Jakarta: Gramedia
Widiasarana Indonesia.
Sutrisno, & Murtianto, Y. H., 2016. Miskonsepsi
Mahasiswa pada Mata Kuliah Statistika Deskriptif
Materi Ukuran Tendensi Sentral, Ukuran Dispersi, dan
Ukuran Letak. Media Penelitian Pendidikan: Jurnal
Penelitian dalam Bidang Pendidikan dan Pengajaran,
10(1 JUNI). https://doi.org/10.26877/mpp.v10i1
JUNI.1256
Thompson, F., & Logue, S., 2006. An Exploration of
Common Student Misconception in Science.
International Education Journal, 7(4), 553–559.
Zaidan, A., Ismail, Z., Yosuf, Y. M., & Kashefi, H., 2012.
Misconceptions in Descriptive Statistics among
Postgraduates in Social Sciences. Procedia - Social and
Behavioral Sciences, 46, 3535 – 3540.
Misconceptions of English Students on Education Statistic
377
