
Segmentation of Karhutla Hotspot Point of Indragiri Hilir Regency
2015 and 2016 using Self Organizing Maps (Soms)
Achmad Isya Al Fassa and Ayundyah Kesumawati
Department of Statistics Faculty of Mathematics and Natural Sciences, Islamic University of Indonesia
Keywords: Hotspot Point, Cluster Analysis, Self-Organizing Maps, Disaster Prone Areas.
Abstract: The hotspot point is an indicator to see forest and land fires occurring in the field. Hotspots are usually in the
form of hotspot coordinates. Given the hotspot point is an important role in disaster prevention in Indonesia,
one of which is the disaster of forest and land fires. So, in this case done research to know comparison of
hotspot point and to know disaster prone area at Regional Disaster Management Agency of Indragiri Hilir
Regency - Riau. Cluster analysis using Self Organizing Maps (SOMs) method is one of the methods that can
be used to know the comparison of hotspot points from year to year and to the grouping of disaster prone
areas. The variables used are Hotspot Point 2015, Hotspot Point 2016, Number of Villages, and Area (Km²).
Of all the variables obtained results where Hotspot Point 2015 higher than the Hotspot Point 2016. So that all
the available variables obtained one area that is disaster-prone areas, namely the District Kempas.
1 INTRODUCTION
Indragiri Hilir regency is one of the districts in Riau
Province. Where is Indragiri Hilir regency is one of
the districts that have forest and land large enough
and big, which have disaster problem that is Karhutla
(Fire Forest and Land). Land and Forest Fire
Disasters is one of the major disasters which in the
Regulation of the Minister of Environment and
Forestry of the Republic of Indonesia Number P.32 /
MenLHK / Setjen / Kum.1 / 3/2016 About Forest and
Land Fire Control that Forest and Land Fires are an
event the burning of forests and / or land, either by
nature or by human actions, resulting in
environmental damage that causes ecological,
economic, socio-cultural and political losses. In this
research there are several studies relating to research
conducted by the author, among others : Setiani and
Hakim (2015) "Clustering of Sustainable
Development Indicators in Indonesia Using the
Kohonen Self Organizing Maps Algorithm", Kasih,
Sulhaerati, Septian, Al Fassa, Maulina (2017), in the
research "Cluster Analysis of Polio Immunization
Data in Indonesia in 2016" Using the Self Organizing
Maps Method, Ambarwati and Winarko in (2014).
The purpose of his research is to create an application
system for grouping news articles using the Self
Organizing Maps algorithm, Anis and Isnanto in
(2014). in this study the Self Organizing Maps
method is used to classify geo-referenced data that
integrates the visualization of the output space in
cartographic representation through color
management, and explores the use of the width of the
border line between elements with geographic
references, calculated according to the best distance
in the input space between locations, and Akbar
(2016) in a research report on practical work at the
Jakarta Capital Region Regional Disaster
Management Agency with the title "Cluster Analysis
Using Self Organizing Maps Method for Grouping
Fire-Prone Hazardous Areas Based on Types of
Damaged Facilities in DKI Jakarta Province 2013-
2015".
2 LITERATURE REVIEW
2.1 Disaster
According to the causes, disasters can be divided into
(1) Natural Disasters due to natural factors, (2) Non-
Natural Disasters due to non-environmental factors,
and (3) Social Disasters due to human factors.
(Sarwidi, 2015).
336
Fassa, A. and Kesumawati, A.
Segmentation of Karhutla Hotspot Point of Indragiri Hilir Regency 2015 and 2016 Using Self Organizing Maps (SOMs).
DOI: 10.5220/0008521603360341
In Proceedings of the International Conference on Mathematics and Islam (ICMIs 2018), pages 336-341
ISBN: 978-989-758-407-7
Copyright
c
2020 by SCITEPRESS – Science and Technology Publications, Lda. All rights reserved

2.2 Forest and Land Fires
Forest and Land Fires, hereinafter referred to as
Karhutla, are an event of burning of forests and / or
land, both natural and by human acts, thus causing
ecological, economic, socio-cultural and political
losses. (Number P.32 / MenLHK / Setjen / Kum.1 /
3/2016 Article 1).
2.3 Descriptive Statistics Analysis
Descriptive Statistics are methods or ways used to
summarize and present data in the form of tables,
graphs or numerical summary of data (Hasan, 2001).
Explain that descriptive statistics are part of statistics
that studies how data collection and data presentation
are so easy to understand. Descriptive statistics only
deal with the matter of deciphering or providing
information about a data or state. With the word
descriptive statistics function explain the state,
symptoms, or problems.
2.4 Cluster Analysis with Self
Organizing Maps
According to (Han et al, 2011) Clustering is the
process of grouping the data set into several groups
so that objects within a group have many similarities
and have many differences with other group objects.
Differences and their similarities are usually based on
the attribute value of the object and can also be a
distance calculation. Clustering itself is also called
Unsupervised Classification, because clustering is
more to be learned and noticed. Cluster analysis is the
process of partitioning a set of data objects into
subsets. Each subset is a cluster, so objects that are in
a cluster are similar to each other, and have
differences with objects from other clusters.
Partitions are not done manually but with clustering
algorithms. Therefore, Clustering is very useful and
can find unknown groups in the data. There are
several approaches used in developing clustering
methods. The two main approaches are Clustering
with Partitioning and Clustering approaches with a
hierarchical approach. Clustering with partitioning
approach or often referred to as partition-based
clustering grouping data by sorting through the data
that is analyzed into existing clusters. Clustering with
hierarchical approach or often called hierarchical
clustering classifies data by creating a hierarchy of
dendrograms where similar data will be placed in
adjacent hierarchies and not in a remote hierarchy. In
addition to both approaches, there is also Clustering
with automatic mapping approach (Self Organizing
Maps / SOM). Self Organizing Map is a leading
method of neural network approach for clustering,
after competitive learning (Han & Kamber 2001).
SOM is different from competitive learning that is the
nerve in a learning environment to recognize the
environmental part of the input space. SOM
recognizes the distribution (such as competitive
learning) and topology of input vector through
training process (Demuth & Beale 2003) SOM shows
three characteristics: the competition is each vector of
weights competing each other to be the winning node,
the cooperative ie each winning node in cooperation
with its environment, and adaptation of the winner's
node change and environment (Larose 2004).
3 METHODS
This research was conducted while carrying out
practical work on January 16 until February 16, 2017
at the Regional Disaster Management Agency
Indragiri Hilir.
3.1 Data Source
The data obtained by the researcher is secondary data
taken from documents / archives of Regional Disaster
Management Agency of Indragiri Hilir Regency and
Central Statistics Agency of Indragiri Hilir Regency.
The variables in this study are variables
Hotspot Point 2015, Hotspot Point 2016, Number
of Villages, and Area (Km²).
3.2 Step Analysis
The method used in this research is descriptive and
comparative statistics to determine the general
description of the existing data variables, while for
grouping the existing variable used Cluster Analysis.
Where Cluster Analysis is used to identify areas
prone to forest and forest land (Karhutla). The
software used in this analysis is SPSS, Mic. Excel, R,
and Software Support.
3.3 Self-Organizing Maps
According to experts (Han et al, 2011) Clustering is
the process of grouping data into several groups so
that objects in one group have many similarities and
have many differences with objects in other groups.
Segmentation of Karhutla Hotspot Point of Indragiri Hilir Regency 2015 and 2016 Using Self Organizing Maps (SOMs)
337
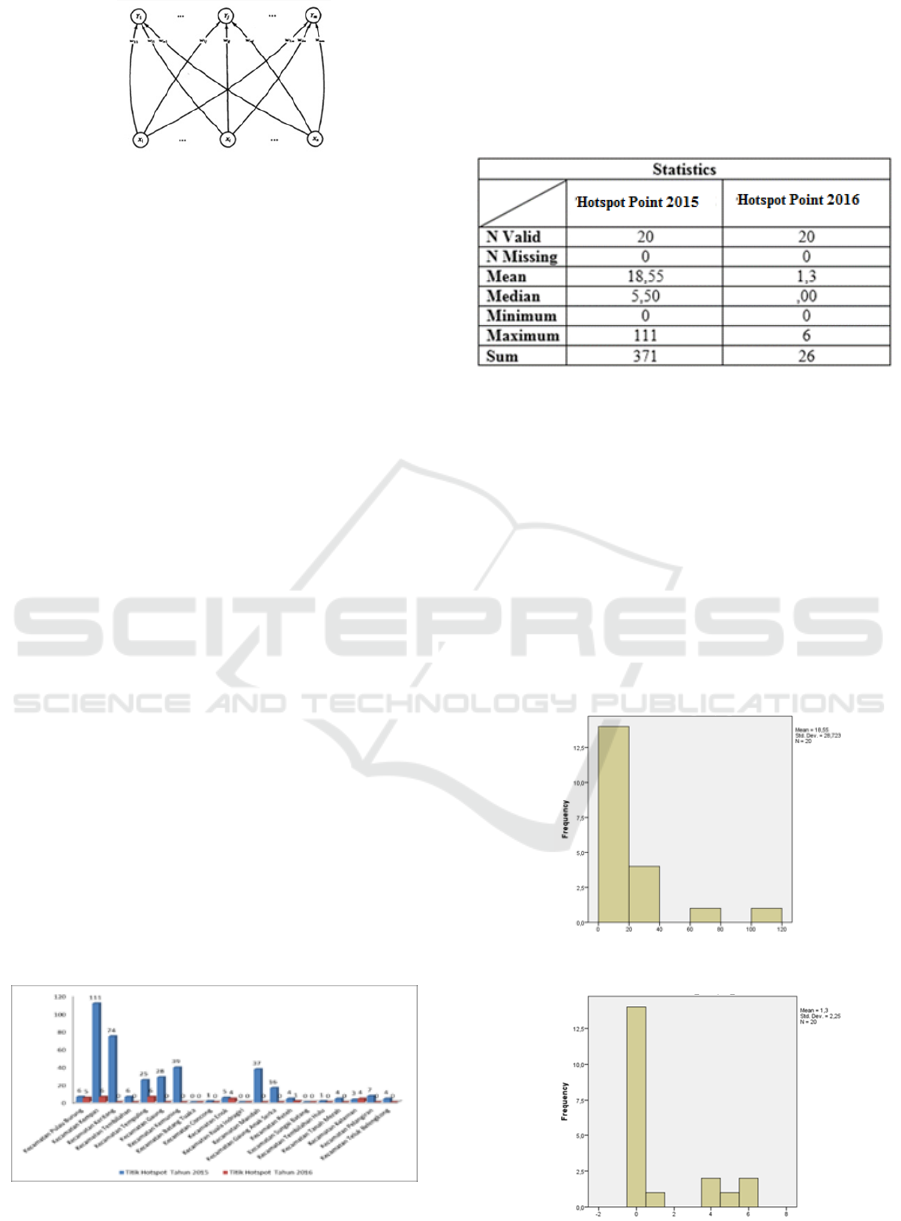
Figure 1: Architecture of Self Organizing Maps.
In cluster analysis there is a measure of distance
where distance measurements are applied to metric
scale data. Actually, it is a measure of dissimilarity,
where large distances show little similarity whereas
short / small distances indicate that an object is more
similar to another object. The difference with the size
of the correlation is that the size of the distance focus
is on the magnitude of the value. The most commonly
used size is the Euklidian distance. Euklidian distance
is the magnitude of the distance of a straight line that
connects objects. Suppose there are two objects,
namely A with coordinates (x) and B with coordinates
(j), the distance between the two objects can be
measured by the formula :
D(w j , xn ) = Σk=i (wij − xni )
2
(1)
Description :
D (j) = Distance between object i
and object j
xni = The object value of the
variable i to k
w = The object value of the variable
i to k
= Many variables
observed
4 RESULTS AND DISCUSSION
Figure 2: Karhutla Hotspot Point Chart 2015-2016.
In figure 2 above is a bar graph hotspot point
karhutla 2015-2016. Where the graph shows the
number of hotspots of forest and land fires occurring
in all districts in Indragiri Hilir Regency. Where in
figure 2 hotspot areas that have the highest point is
the District Kempas.
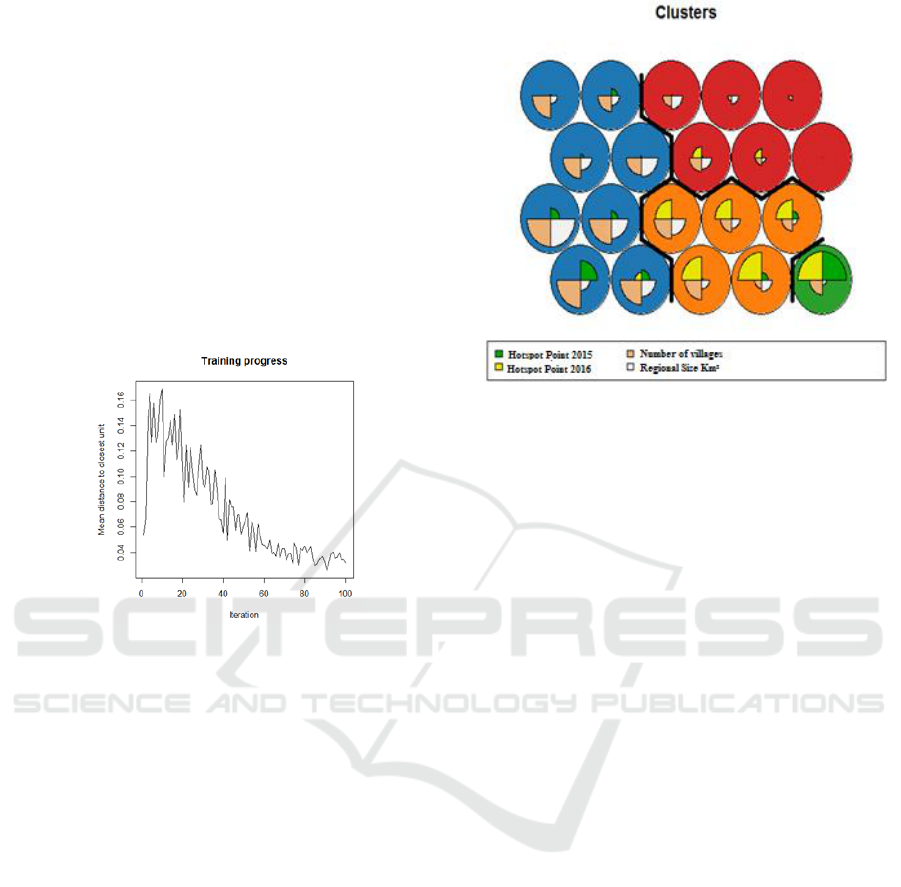
Figure 3: Descriptive Statistics Analysis of Karhutla
Hotspot Point Data Year 2015 and 2016.
From Figure 3 during 2015 the value of N Valid =
20 and N Missing = 0. This shows that valid data in
2015 has 20 data and no missing data. Mean Value =
18.55, Median Value = 5.50, Minimum Value = 0,
Maximum Value = 111, and
Sum Value = 371. While in 2016 the value of N
Valid and N Missing is the same as 2015, N Valid =
20 and N Missing = 0 it also shows that valid data in
2016 has 20 data and no missing data. Mean Value =
1.30, Median Value = .00, Minimum Value = 0,
Maximum Value = 6, and Sum Value = 26.
Figure 4: Histogram Hotspot Point 2015.
Figure 5: Histogram Hotspot Point 2016.
n
ICMIs 2018 - International Conference on Mathematics and Islam
338
From Figure 4 and Figure 5 is the output of
descriptive statistical analysis using SPSS software.
Where from Figure 4 and Figure 5 it can be concluded
that the data used by researchers, be it data hotspot
point 2015 and 2016 hotspot data point is abnormal
data.
After the descriptive statistical analysis, then in this
cluster analysis, researchers used multiple variables,
namely: District, Point 2015 and Point Hotspot 2016
Number of Rural and Regional Area (km2). The
results of the cluster analysis performed by the
researchers is to divide or classify subdistricts in
Indragiri Hilir into several groups: high, medium,
light, and very light, according to the number of
points hotspots owned by each district.
Figure 6: Training Progress Iterate.
The results of the training progress output are the
results showing the number of iterations against the
average distance to the nearest unit. It can be seen that
iteration shows the convergence from the 60th
iteration. Based on this training progress chart it can
be seen that iteration can be done 100 times iteration.
The process in Self Organizing Maps creates a Self-
Organizing Maps model and, in the process, using R
application will generate a diagram containing
several circles that will be closely topological if the
characteristics are the same.
Figure 7 is the result of cluster analysis above shows
the result of clustering previously explained by
researchers, in figure 7 above can be seen the
researcher make Venn diagram by using hexagonal
display with grid 4 x 5. This diagram is based on the
data input then processed using Kohonen algorithm
by using 4 variables.
Figure 7: Output Clustering Self Organizing Maps.
Once formed Venn diagram can be seen the identity
of each circle contained from the output obtained, in
each circle there are identities of each variable are:
green color is a hotspot point in 2015, yellow color is
a hotspot point 2016, cream color is the number of
villages, and the white color is the area, with the
description as follows:
1. Cluster I: This cluster is green; this cluster
shows as a vulnerable area or high group.
2. Cluster II: This cluster is blue; this cluster shows
the moderate category.
3. Cluster III: This cluster is orange; this cluster
shows the category of light category.
4. Cluster IV: This cluster is red; this cluster shows
as a very lightweight group.
In this cluster analysis, cluster number of 20 clusters
is obtained based on the number of sub-districts in
Indragiri Hilir Regency. There are 4 groups in the
cluster analysis conducted by the researcher that is:
high, medium, light, and very light. This group is
based on the number of hotspots that exist in each
sub-district in Indragiri Hilir district with 2015
hotspot variables, hotspots 2016, number of villages,
and total area.
Segmentation of Karhutla Hotspot Point of Indragiri Hilir Regency 2015 and 2016 Using Self Organizing Maps (SOMs)
339
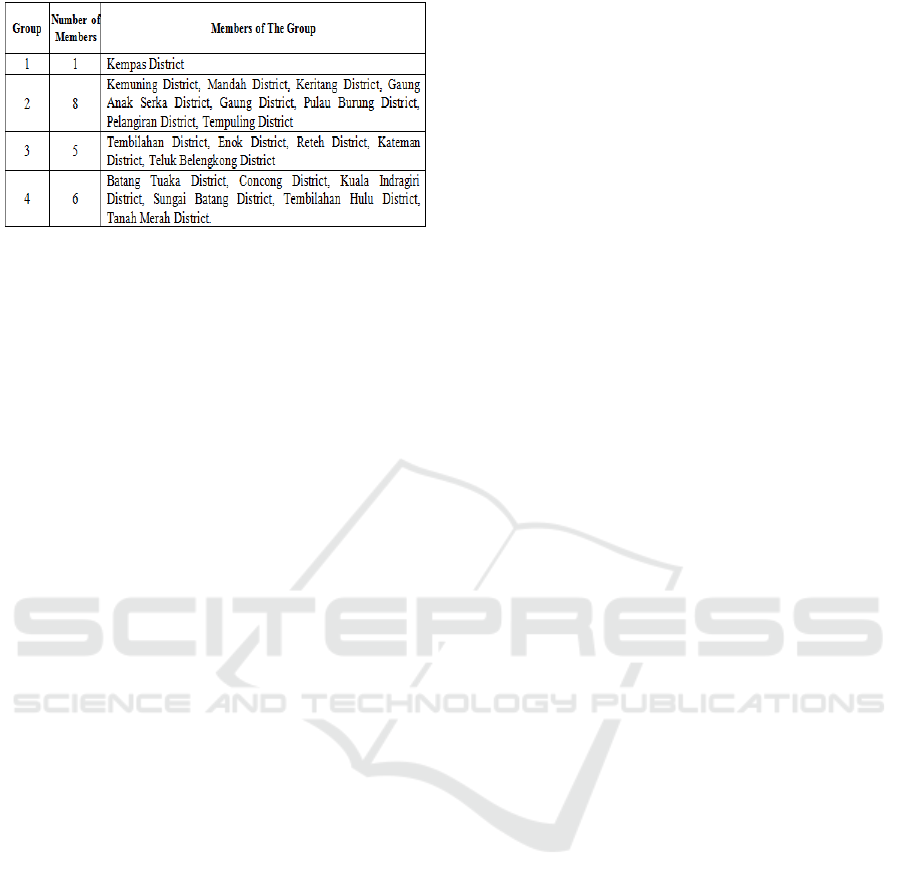
Figure 8: Results Cluster Analysis with Self Organizing
Maps.
From Figure 8 is the result of clustering Cluster
analysis using Self Organizing Maps Method. Where
in group 1 is a group that is categorized by high
category, group 2 is categorized by medium category,
group 3 is categorized by light category, group 4 is
categorized with very light category. From the results
of the grouping the researchers get a conclusion that
group 1 is categorized by high category is the area of
disaster-prone forest fire and land.
5 CONCLUSIONS
Based on the results of comparison, descriptive
analysis and discussion Cluster Analysis, in the case
study, it can be concluded that:
1. The condition of forest and land fires in
Indragiri Hilir Regency in 2015 until 2016 has
decreased the number of fire incidents. This is
due to the hotspot point data obtained in 2016
less than 2015, according to the comparison
results described by previous researchers.
2. Descriptive Analysis Results in 2015 N values
Valid = 20 and N Missing = 0 this shows that
valid data in 2015 there are 20 data and do not
have missing data. Mean Value = 18.55, Median
Value = 5.50, Minimum Value = 0, Maximum
Value = 111, and Sum Value = 371. While in
2016 the value of N Valid and N Missing is
equal to 2015, N Valid = 20 and N Missing = 0
It also shows that valid data in 2016 has 20 data
and no missing data. Mean Value = 1.30,
Median Value = .00, Minimum Value = 0,
Maximum Value = 6, and Sum Value = 26.
3. Grouping is done by Self Organizing Maps
method that produces cluster. Where cluster I is
an area that has high hotspot point of 1
subdistrict, cluster II is an area that has hotspot
point which consist of 8 districts, cluster III is
area having hotspot point which consist of 5
districts, and cluster IV is area having a very
light hotspot point that consists of 6 districts.
Cluster I has members of Kempas Sub-district.
Cluster II consists of Bird Island Sub-District,
Keritang Sub-District, Tempuling Sub-District,
Gaung Sub-District, Kemuning Sub-District,
Mandah Sub-District, Gaung Anak Serka Sub-
District, Pelangiran Sub-District. Cluster III
consists of District Tembilahan, District Enok,
District Reteh, District Kateman, Belengkong
Bay District. Cluster IV consists of Batang
Tuaka Subdistrict, Concong Sub-District, Kuala
Indragiri Sub-District, Sungai Batang
Subdistrict, Tembilahan Hulu Sub-District,
Tanah Merah Sub-district.
REFERENCES
Akbar, Purnama. 2016. Analisis Cluster Menggunakan
Metode Self Organizing Maps (SOM) Untuk
Pengelompokan Daerah Rawan Bencana Kebakaran
Berdasarkan Jenis Sarana yang Rusak di Provinsi DKI
Jakarta Tahun 2013-2015. Laporan kerja praktek tidak
diterbitkan, Jurusan Statistika, Fakultas MIPA
Universitas Islam Indonesia, Yogyakarta.
Demuth H, Beale M. 2003. Neural Network Toolbox for
Use with MATLAB. USA: The MathWorks, Inc.
Hasan, I. 2001. Pokok-Pokok Materi Statstik 2. Jakarta:
Bumi Aksara
Han, J., Kamber, M., Jian, P. 2011. Data Mining: Concepts
and Techniques, 3rd ed. Morgan Kaufmann.
Han J, Kamber M. 2001. Data Mining: Concepts and
Techniques. USA: Academic Press.
Larose DT. 2004. Descovering Knowladge in Data: An
Introduction to Data Mining. USA: John Wiley&Sons
Inc.
Liputan6.com/read/2322792/sisa-kebakaran-hutan-di-riau-
kembali-membara
Peraturan Kepala Badan Nasional Penanggulangan
Bencana Nomor 3 Tahun 2008 tentang BNPB.
Peraturan Kepala Badan Nasional Penanggulangan
Bencana Nomor 3 Tahun 2008 tentang BPBD.
Peraturan Kepala Badan Nasional Penanggulangan
Bencana Nomor 9 Tahun 2008 tentang TRC (Tim
Reaksi Cepat).
Peraturan Menteri Lingkungan Hidup dan Kehutanan.
Nomor P.32/MenLHK/Setjen/Kum.1/3/2016 Pasal 1.
Tentang Kebakaran Hutan dan Lahan (Karhutla).
Peraturan Menteri Lingkungan Hidup dan Kehutanan.
Nomor P.32/MenLHK/Setjen/Kum.1/3/2016 Pasal 1.
Tentang Hutan.
Peraturan Menteri Lingkungan Hidup dan Kehutanan.
Nomor P.32/MenLHK/Setjen/Kum.1/3/2016 Pasal 1.
Tentang Lahan.
Sarwidi. 2015. Pengetahuan Dasar Kebencanaan dan
Kegempaan. Universitas Islam Indonesia. Yogyakarta.
Statistikolahdata.com/2010/10/analisis-perbandingan.html
ICMIs 2018 - International Conference on Mathematics and Islam
340

Sipongi.menlhk.go.id/hotspot/luas_
Sigama.web.id/index.php/kebakaran-hutan.html
Tnrawku.wordpress.com/category/kebakaran-hutan-dan-
lahan/
Undang-Undang Nomor 26 Tahun 2007 tentang Wilayah.
Yulianto, Safa’at., K.H. Hidayatullah. 2014. Analisis
Klaster Untuk Pengelompokan Kabupaten/Kota di
Provinsi Jawa Tengah Berdasarkan Indikator
Kesejahteraan Rakyat. Akd. Statistika Muhammadiyah
Semarang
Segmentation of Karhutla Hotspot Point of Indragiri Hilir Regency 2015 and 2016 Using Self Organizing Maps (SOMs)
341
